| Param | Original file | Final file |
|---|---|---|
| Filename | modeM0/AS1T03_183T01_9000003606_24537cztM0_level2.evt | modeM0/AS1T03_183T01_9000003606_24537cztM0_level2_quad_clean.evt |
| Size (bytes) | 477,400,320 | 121,521,600 |
| Size | 455.3 MB | 115.9 MB |
| Events in quadrant A | 3,111,839 | 827,183 |
| Events in quadrant B | 3,523,433 | 840,974 |
| Events in quadrant C | 3,161,497 | 787,387 |
| Events in quadrant D | 4,212,377 | 763,938 |
| Mode M0 | |||
|---|---|---|---|
| Quadrant | BADHDUFLAG | Total packets | Discarded packets |
| A | 0 | 13599 | 2 |
| B | 0 | 14650 | 6 |
| C | 0 | 13712 | 2 |
| D | 0 | 17125 | 2 |
| Mode SS | |||
|---|---|---|---|
| Quadrant | BADHDUFLAG | Total packets | Discarded packets |
| A | 0 | 134 | 0 |
| B | 0 | 134 | 0 |
| C | 0 | 134 | 0 |
| D | 0 | 134 | 0 |
| Mode M9 | |||
|---|---|---|---|
| Quadrant | BADHDUFLAG | Total packets | Discarded packets |
| A | 0 | 18 | 0 |
| B | 0 | 19 | 0 |
| C | 0 | 19 | 0 |
| D | 0 | 19 | 0 |
| Quadrant | Total seconds | Saturated seconds | Saturation percentage |
|---|---|---|---|
| A | 6615 | 19 | 0.287226% |
| B | 6614 | 58 | 0.876928% |
| C | 6614 | 58 | 0.876928% |
| D | 6614 | 62 | 0.937406% |
Noise dominated data is calculated using 1-second bins in cleaned event files. If a bin has >2000 counts, and if more than 50% of those come from <1% of pixels, then it is considered to be noise-dominated and hence unusable.
| Quadrant | # 1 sec bins | Bins with >0 counts | Bins with >2000 counts | High rate bins dominated by noise | Noise dominated (total time) | Noise dominated (detector-on time) | Marked lightcurve |
|---|---|---|---|---|---|---|---|
| A | 7555 | 6616 | 0 | 0 | 0.00% | 0.00% | 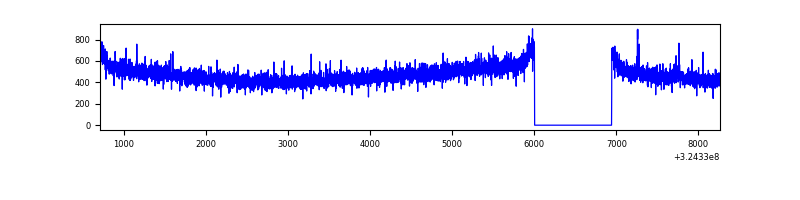 |
| B | 7554 | 6615 | 18 | 18 | 0.24% | 0.27% | 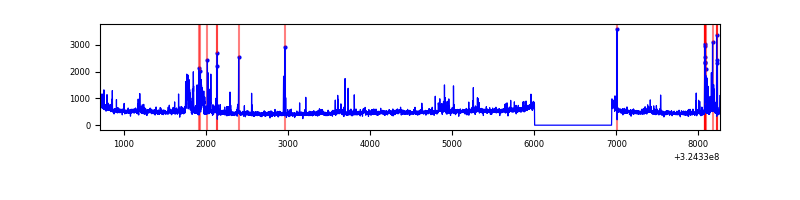 |
| C | 7554 | 6615 | 11 | 11 | 0.15% | 0.17% | 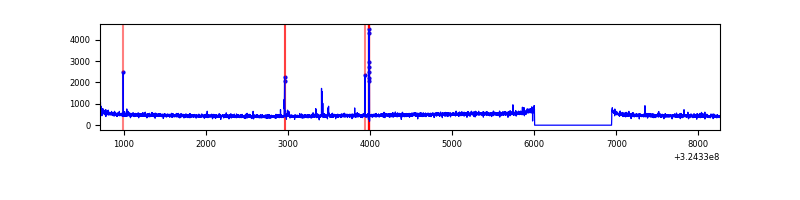 |
| D | 7554 | 6615 | 35 | 35 | 0.46% | 0.53% | 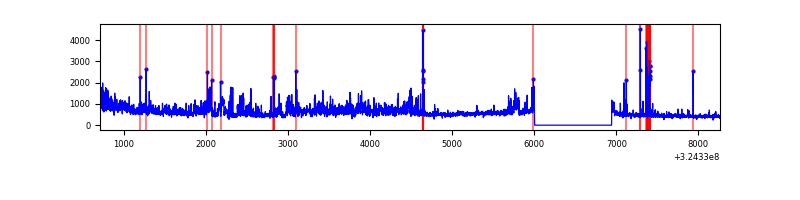 |
Top three noisy pixels from each quadrant. If the there are fewer than three noisy pixels in the level2.evt file, extra rows are filled as -1
| Pixel properties | Quadrant properties | ||||||
|---|---|---|---|---|---|---|---|
| Quadrant | DetID | PixID | Counts | Sigma | Mean | Median | Sigma |
| A | 13 | 254 | 10377 | 59.6 | 803 | 790 | 160.9 |
| A | 14 | 111 | 7844 | 43.85 | 803 | 790 | 160.9 |
| A | 3 | 137 | 7256 | 40.2 | 803 | 790 | 160.9 |
| B | 3 | 64 | 358525 | 2369.76 | 803 | 786 | 151.0 |
| B | 12 | 111 | 18337 | 116.26 | 803 | 786 | 151.0 |
| B | 11 | 111 | 16085 | 101.34 | 803 | 786 | 151.0 |
| C | 14 | 238 | 124071 | 692.11 | 764 | 770 | 178.2 |
| C | 2 | 16 | 55953 | 309.75 | 764 | 770 | 178.2 |
| C | 13 | 61 | 5327 | 25.58 | 764 | 770 | 178.2 |
| D | 1 | 52 | 1005463 | 5395.84 | 765 | 742 | 186.2 |
| D | 8 | 195 | 183349 | 980.69 | 765 | 742 | 186.2 |
| D | 12 | 218 | 66485 | 353.07 | 765 | 742 | 186.2 |
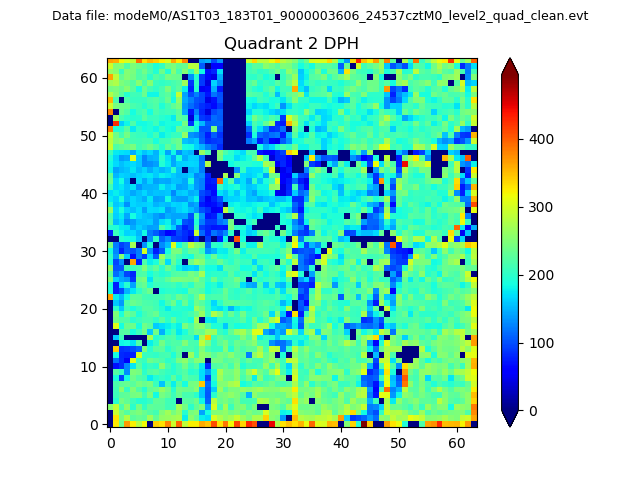
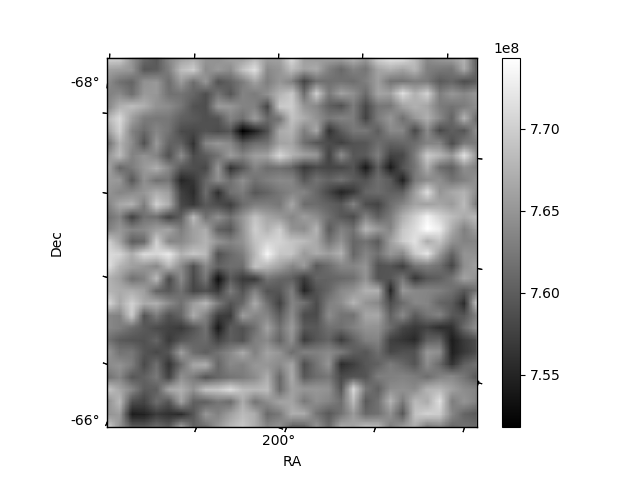
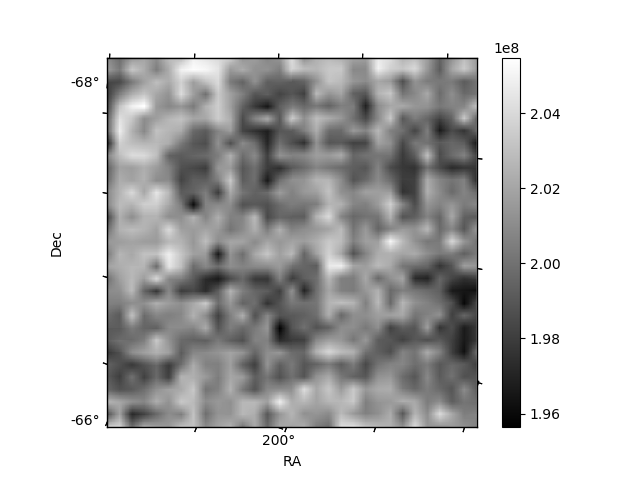
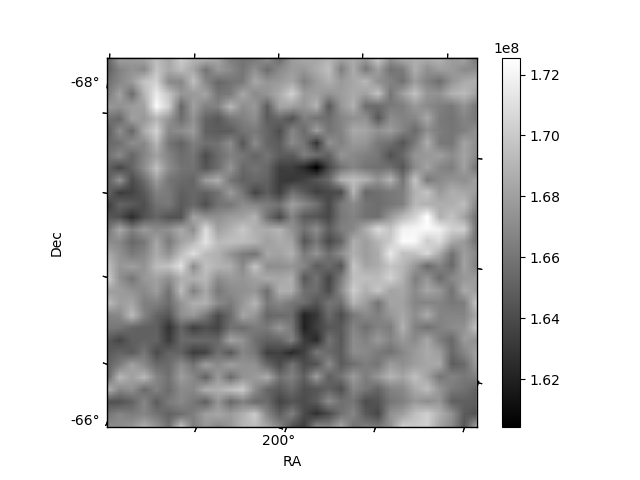
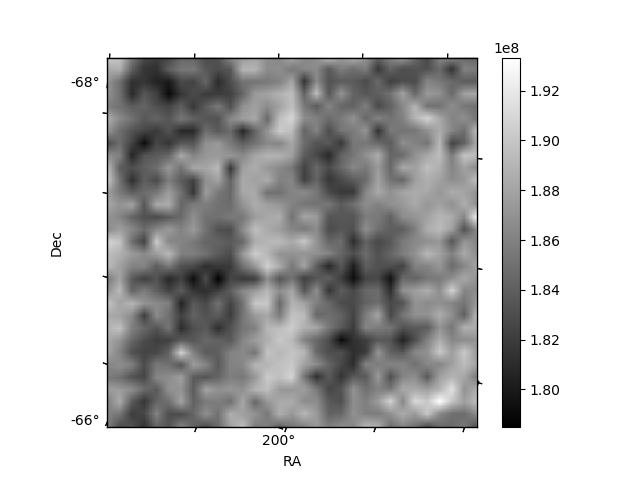
Histogram calculated using DETX and DETY for each event in the final _common_clean file
| Quadrant A | 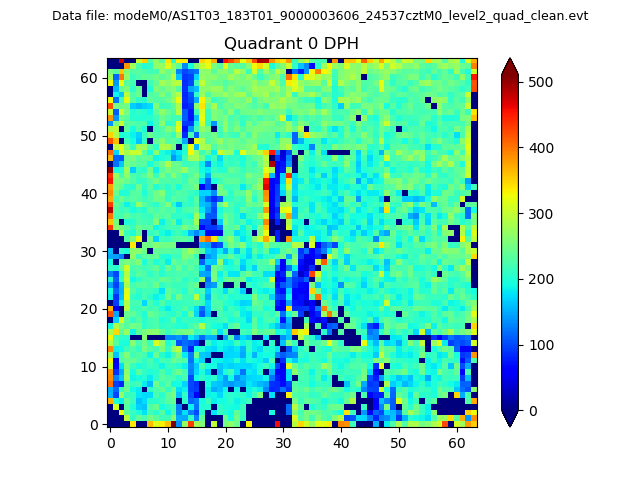 |
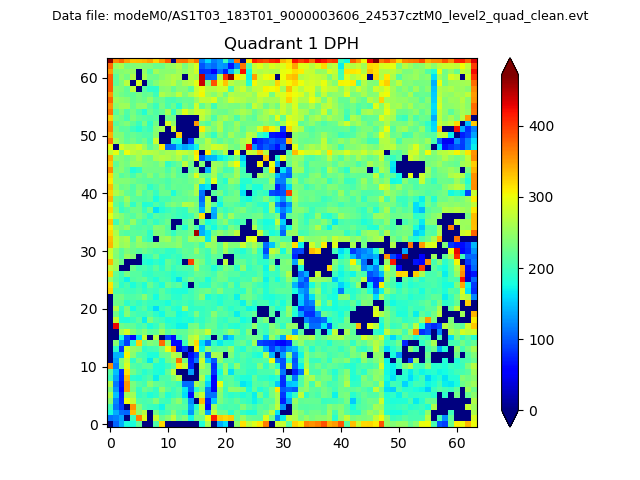 |
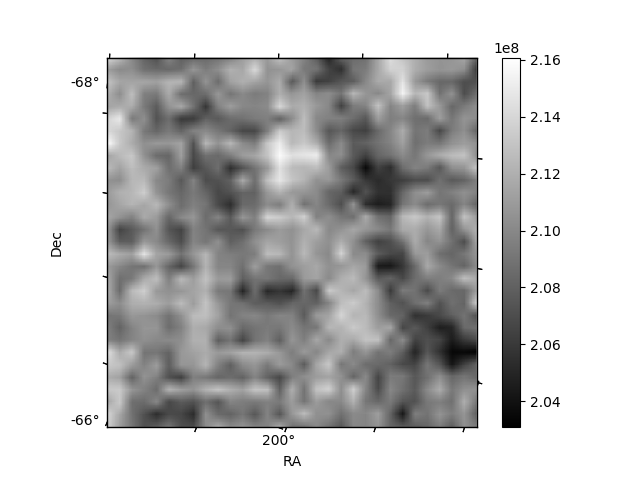
Quadrant B |
|---|---|---|---|
| Quadrant D | 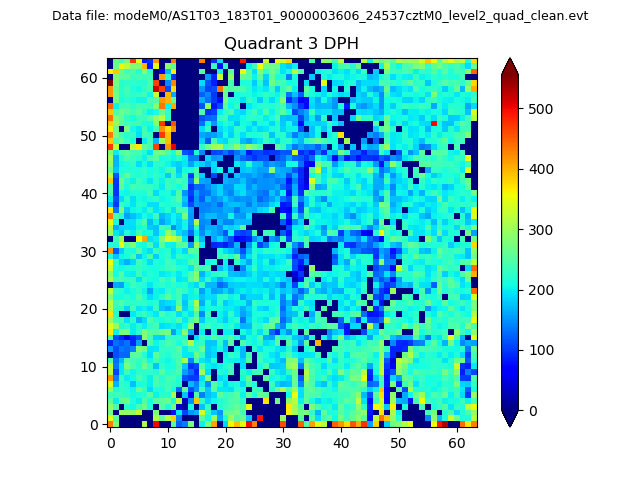 |
 |
Quadrant C |
| Plot type | Count rate plots | Images |
|---|---|---|
| Comparison with Poisson distribution Blue bars denote a histogram of data divided into 1 sec bins. Red curve is a Poisson curve with rate = median count rate of data. |
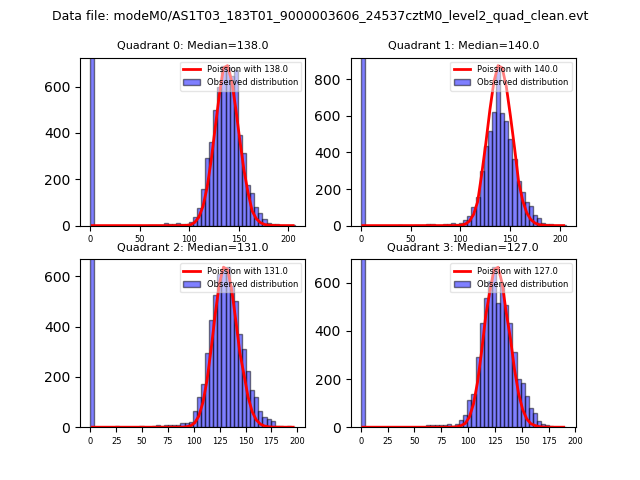 |
 |
| Quadrant-wise count rates Data is divided into 100 sec bins |
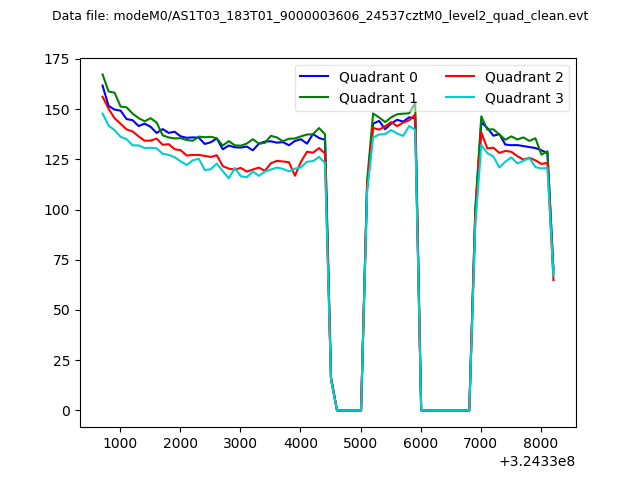 |
|
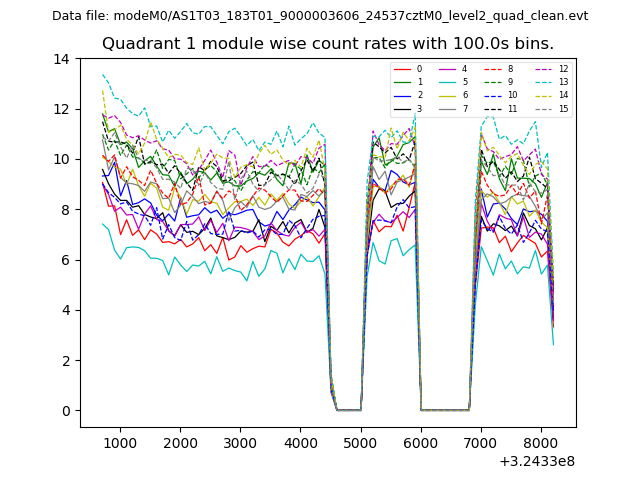
| Module-wise count rates for Quadrant A Data is divided into 100 sec bins |
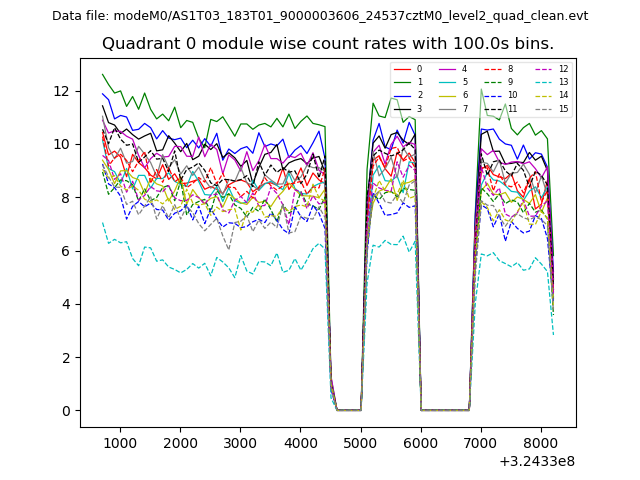 |
 |
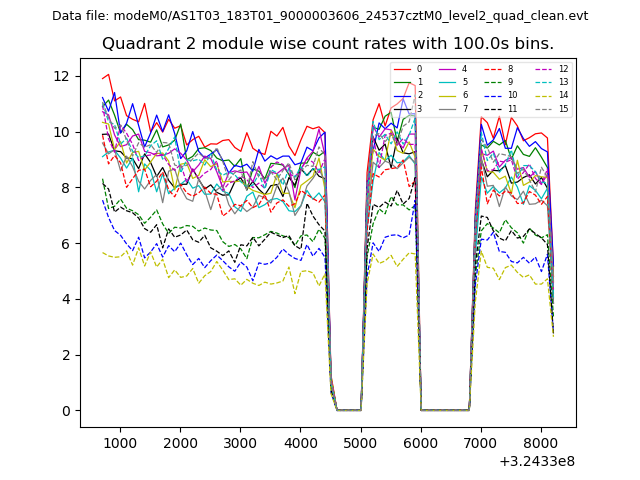
| Module-wise count rates for Quadrant B Data is divided into 100 sec bins |
 |
 |
| Module-wise count rates for Quadrant C Data is divided into 100 sec bins |
 |
 |
| Module-wise count rates for Quadrant D Data is divided into 100 sec bins |
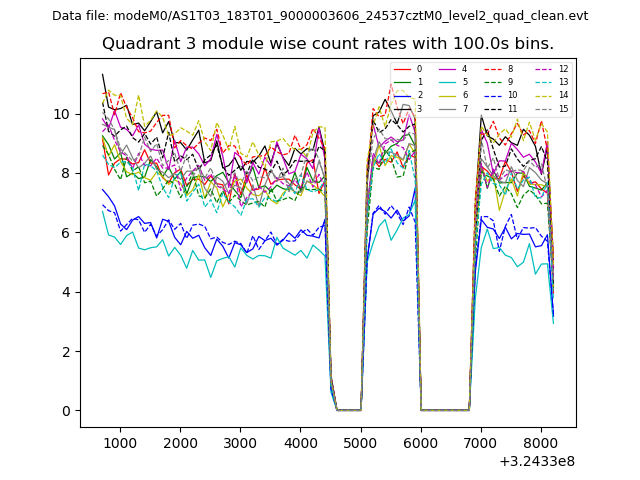 |
 |
| Parameter | Plot |
|---|---|
| CZT HV Monitor | 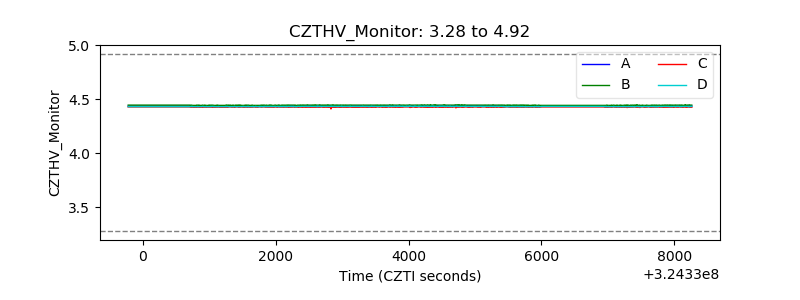 |
| D_VDD | 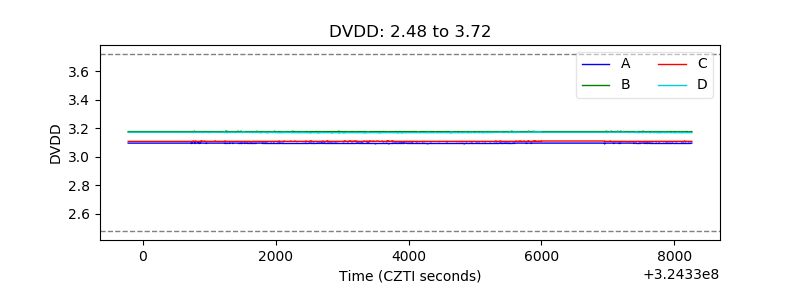 |
| Temperature 1 | 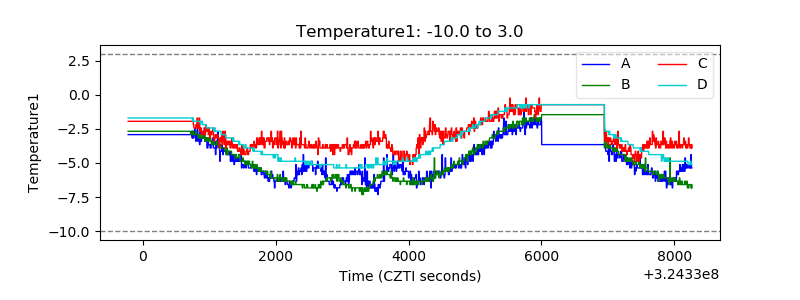 |
| Veto HV Monitor |  |
| Veto LLD | 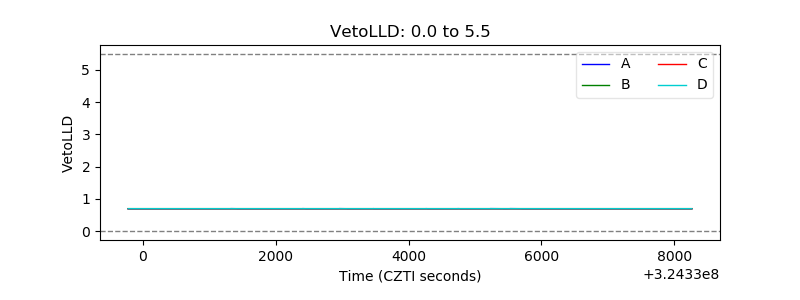 |
| Alpha Counter | 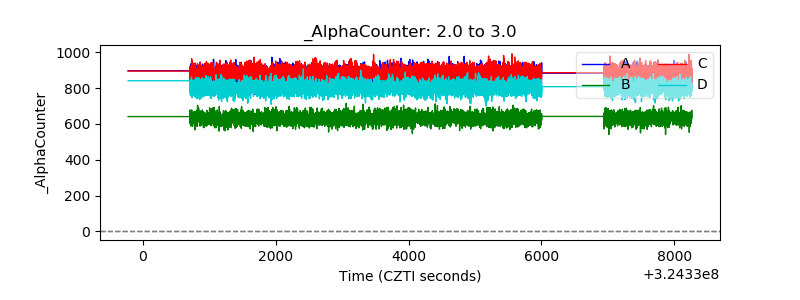 |
| _CPM_Rate | 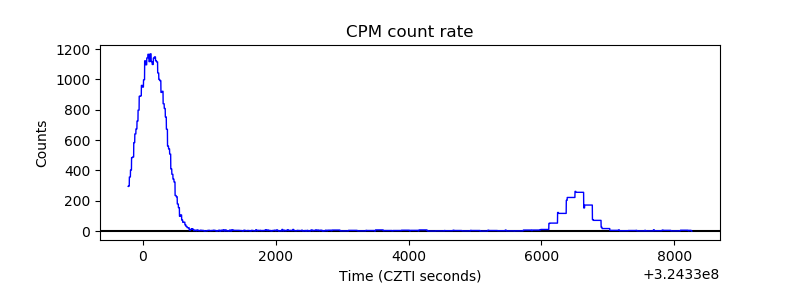 |
| CZT Counter | 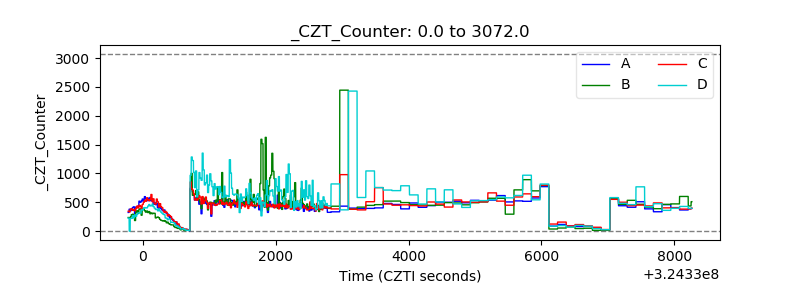 |
| +2.5 Volts monitor |  |
| +5 Volts monitor |  |
| _ROLL_ROT | 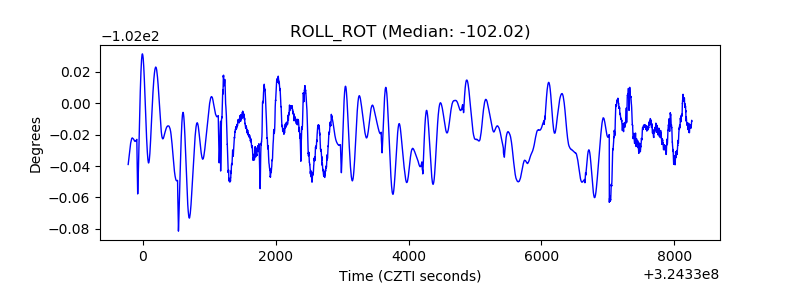 |
| _Roll_DEC | 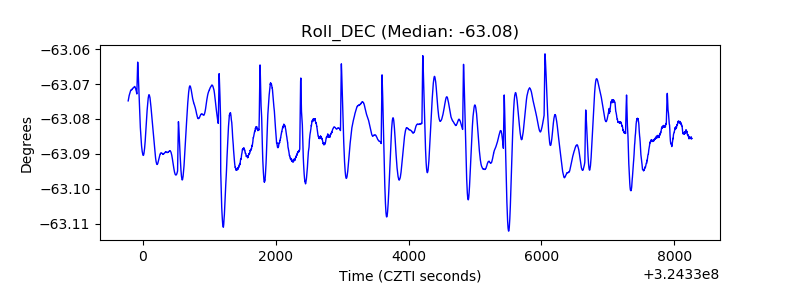 |
| _Roll_RA | 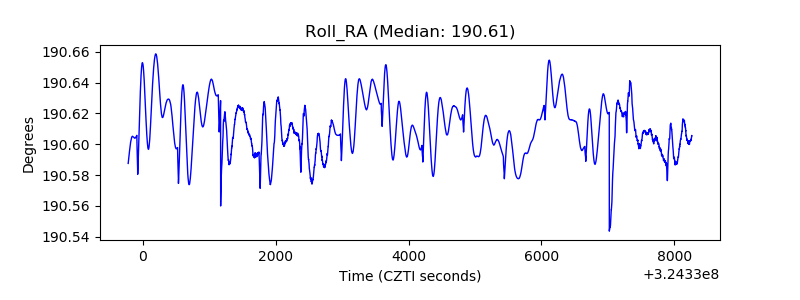 |
| Veto Counter | 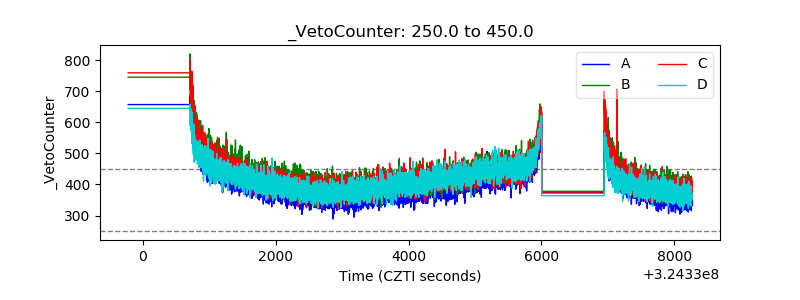 |