| Param | Original file | Final file |
|---|---|---|
| Filename | modeM0/AS1T03_183T01_9000003606_24538cztM0_level2.evt | modeM0/AS1T03_183T01_9000003606_24538cztM0_level2_quad_clean.evt |
| Size (bytes) | 533,113,920 | 133,744,320 |
| Size | 508.4 MB | 127.5 MB |
| Events in quadrant A | 3,504,954 | 908,612 |
| Events in quadrant B | 4,420,262 | 903,972 |
| Events in quadrant C | 3,486,247 | 870,032 |
| Events in quadrant D | 4,222,677 | 844,088 |
| Mode M0 | |||
|---|---|---|---|
| Quadrant | BADHDUFLAG | Total packets | Discarded packets |
| A | 0 | 15495 | 2 |
| B | 0 | 18046 | 2 |
| C | 0 | 15363 | 2 |
| D | 0 | 17823 | 2 |
| Mode SS | |||
|---|---|---|---|
| Quadrant | BADHDUFLAG | Total packets | Discarded packets |
| A | 0 | 156 | 0 |
| B | 0 | 156 | 0 |
| C | 0 | 156 | 0 |
| D | 0 | 156 | 0 |
| Mode M9 | |||
|---|---|---|---|
| Quadrant | BADHDUFLAG | Total packets | Discarded packets |
| A | 0 | 14 | 0 |
| B | 0 | 14 | 0 |
| C | 0 | 14 | 0 |
| D | 0 | 14 | 0 |
| Quadrant | Total seconds | Saturated seconds | Saturation percentage |
|---|---|---|---|
| A | 7525 | 28 | 0.372093% |
| B | 7526 | 325 | 4.318363% |
| C | 7526 | 66 | 0.876960% |
| D | 7526 | 185 | 2.458145% |
Noise dominated data is calculated using 1-second bins in cleaned event files. If a bin has >2000 counts, and if more than 50% of those come from <1% of pixels, then it is considered to be noise-dominated and hence unusable.
| Quadrant | # 1 sec bins | Bins with >0 counts | Bins with >2000 counts | High rate bins dominated by noise | Noise dominated (total time) | Noise dominated (detector-on time) | Marked lightcurve |
|---|---|---|---|---|---|---|---|
| A | 8970 | 7527 | 0 | 0 | 0.00% | 0.00% | 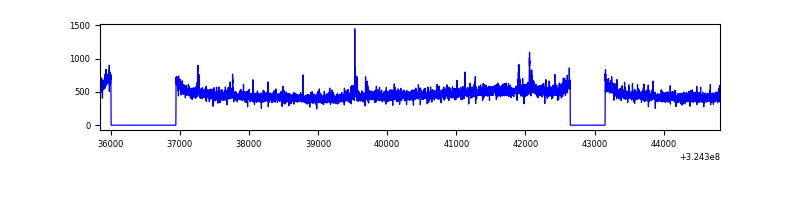 |
| B | 8971 | 7528 | 183 | 183 | 2.04% | 2.43% | 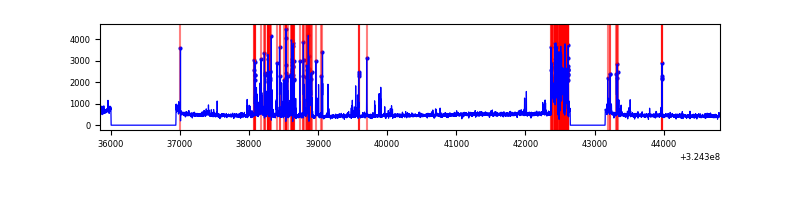 |
| C | 8971 | 7528 | 0 | 0 | 0.00% | 0.00% | 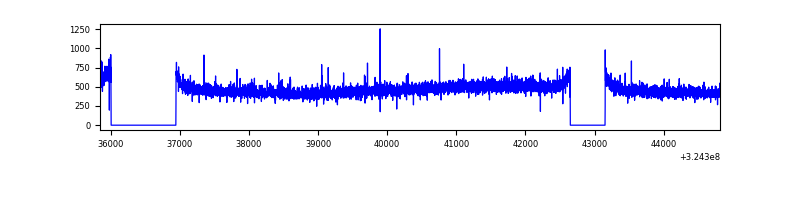 |
| D | 8971 | 7528 | 126 | 126 | 1.40% | 1.67% | 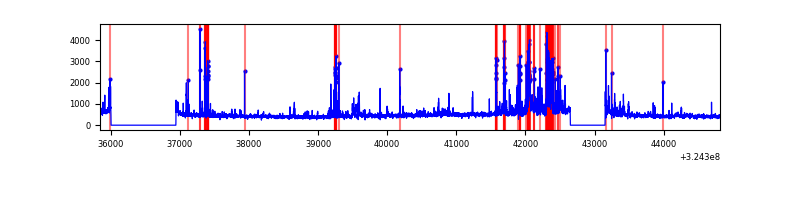 |
Top three noisy pixels from each quadrant. If the there are fewer than three noisy pixels in the level2.evt file, extra rows are filled as -1
| Pixel properties | Quadrant properties | ||||||
|---|---|---|---|---|---|---|---|
| Quadrant | DetID | PixID | Counts | Sigma | Mean | Median | Sigma |
| A | 14 | 111 | 28633 | 154.6 | 894 | 875 | 179.5 |
| A | 4 | 2 | 17781 | 94.16 | 894 | 875 | 179.5 |
| A | 13 | 254 | 11970 | 61.79 | 894 | 875 | 179.5 |
| B | 3 | 64 | 937202 | 5640.32 | 881 | 860 | 166.0 |
| B | 12 | 111 | 20354 | 117.43 | 881 | 860 | 166.0 |
| B | 11 | 111 | 17642 | 101.09 | 881 | 860 | 166.0 |
| C | 14 | 238 | 138386 | 697.9 | 855 | 861 | 197.1 |
| C | 3 | 233 | 7364 | 33.0 | 855 | 861 | 197.1 |
| C | 13 | 61 | 6002 | 26.09 | 855 | 861 | 197.1 |
| D | 9 | 1 | 358836 | 1699.71 | 856 | 829 | 210.6 |
| D | 12 | 218 | 281026 | 1330.29 | 856 | 829 | 210.6 |
| D | 8 | 195 | 174818 | 826.05 | 856 | 829 | 210.6 |
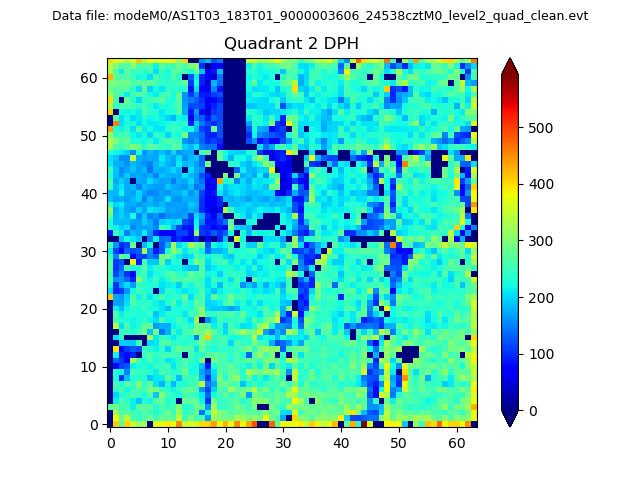
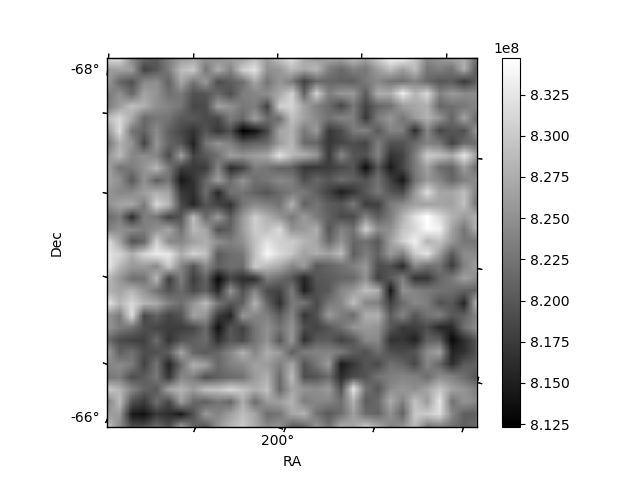
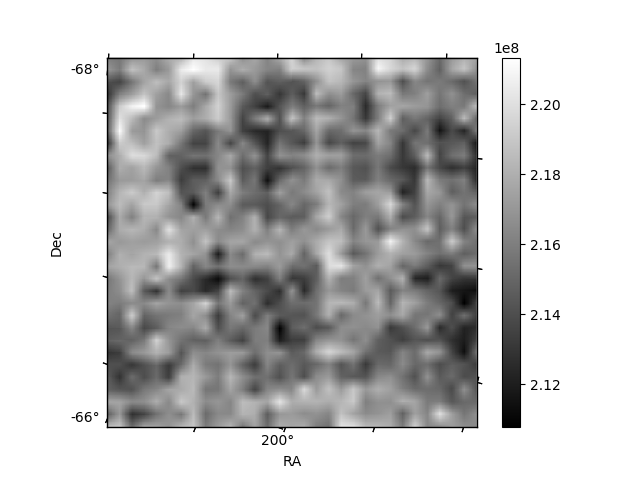
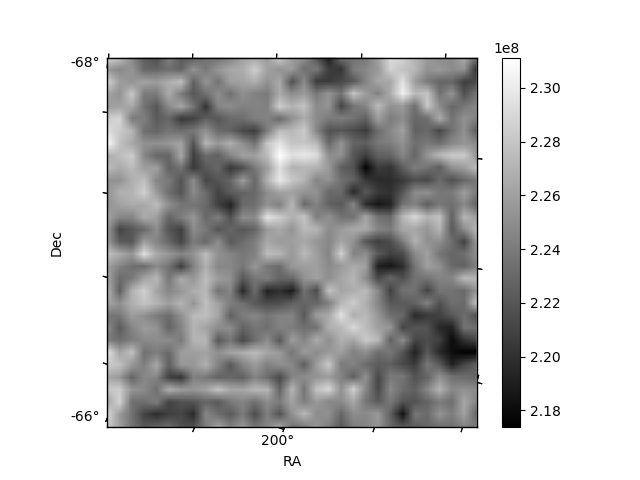
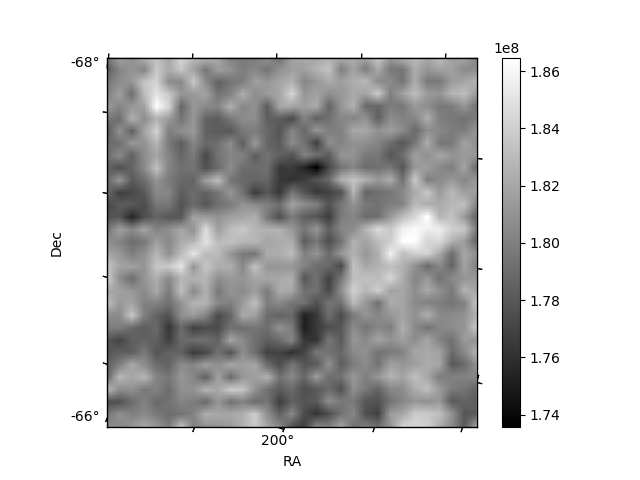
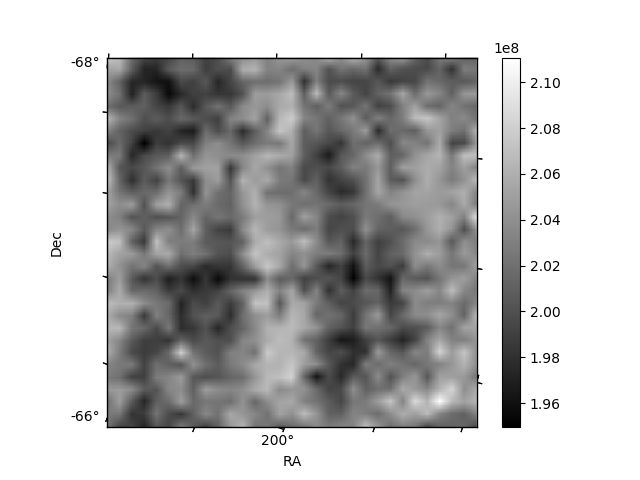
Histogram calculated using DETX and DETY for each event in the final _common_clean file
| Quadrant A | 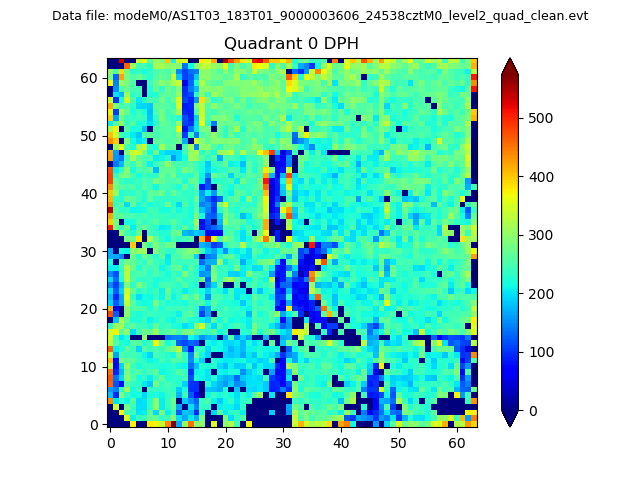 |
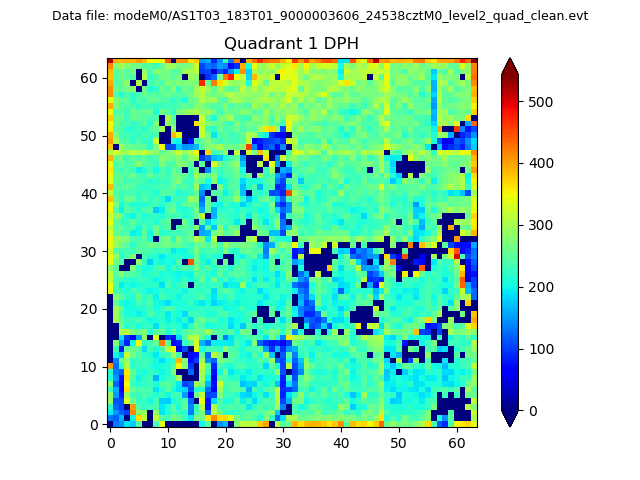 |
Quadrant B |
|---|---|---|---|
| Quadrant D | 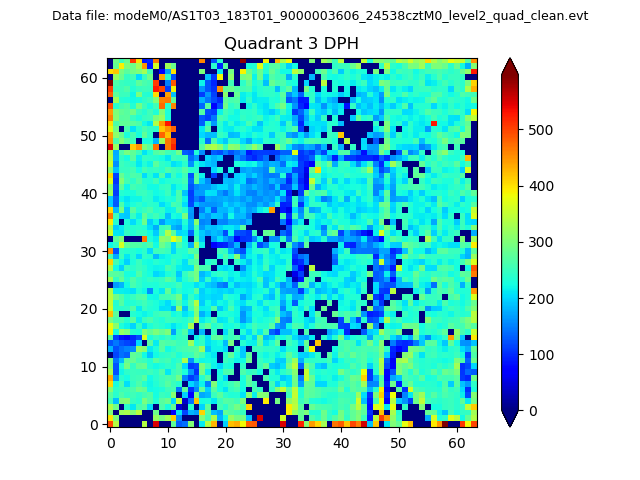 |
 |
Quadrant C |
| Plot type | Count rate plots | Images |
|---|---|---|
| Comparison with Poisson distribution Blue bars denote a histogram of data divided into 1 sec bins. Red curve is a Poisson curve with rate = median count rate of data. |
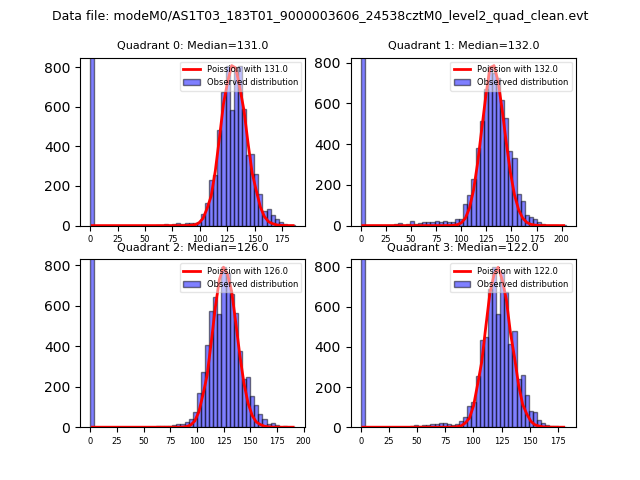 |
 |
| Quadrant-wise count rates Data is divided into 100 sec bins |
 |
|
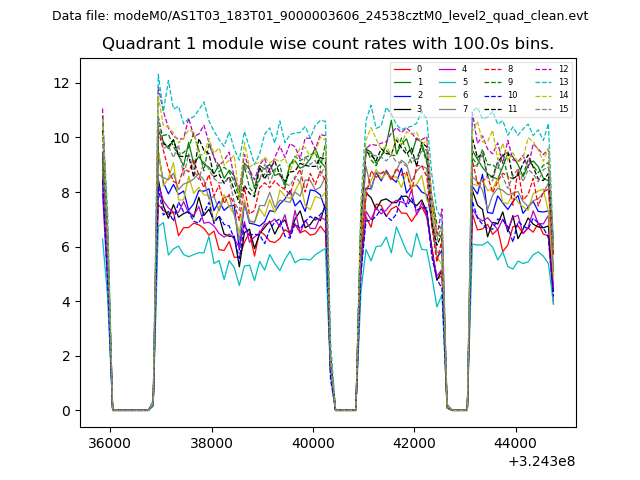
| Module-wise count rates for Quadrant A Data is divided into 100 sec bins |
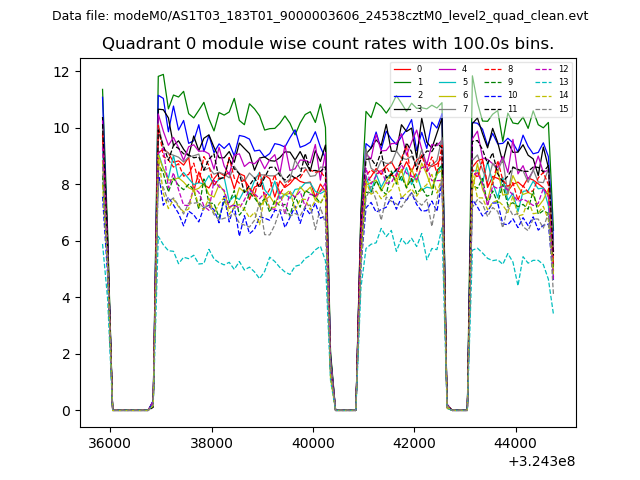 |
 |
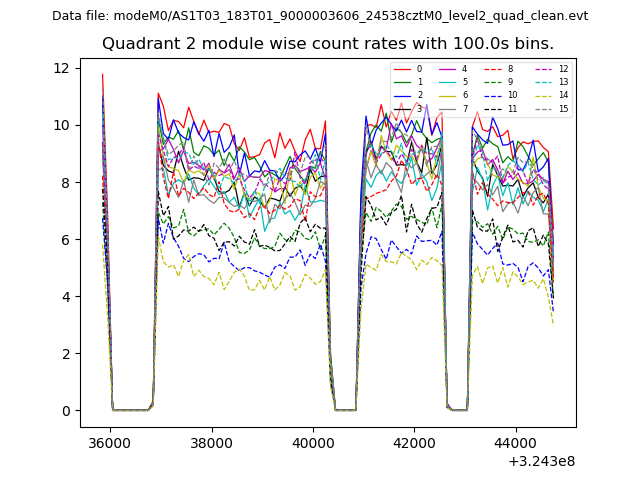
| Module-wise count rates for Quadrant B Data is divided into 100 sec bins |
 |
 |
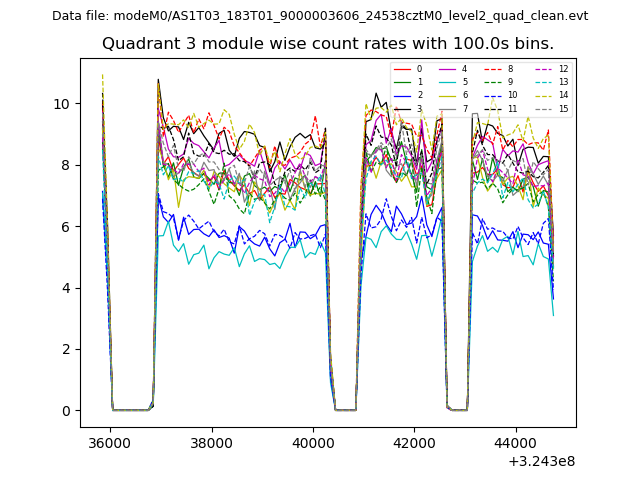
| Module-wise count rates for Quadrant C Data is divided into 100 sec bins |
 |
 |
| Module-wise count rates for Quadrant D Data is divided into 100 sec bins |
 |
 |
| Parameter | Plot |
|---|---|
| CZT HV Monitor | 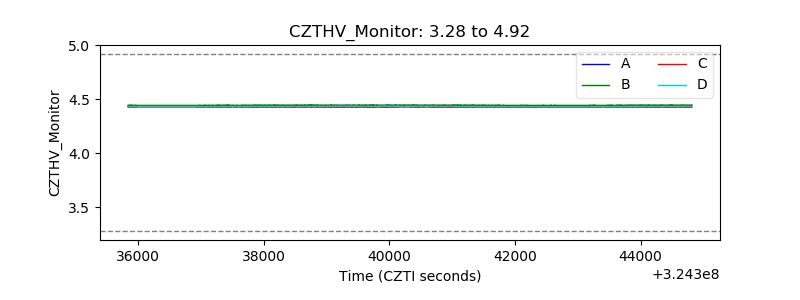 |
| D_VDD | 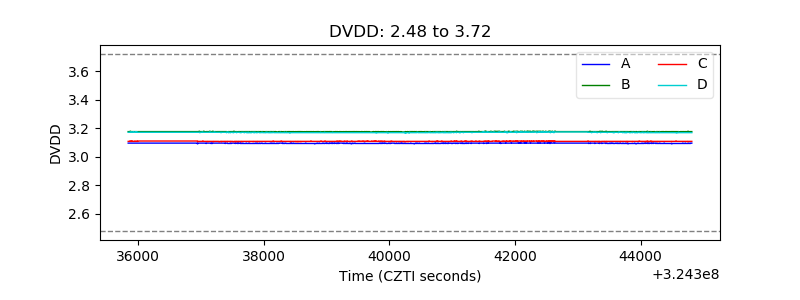 |
| Temperature 1 | 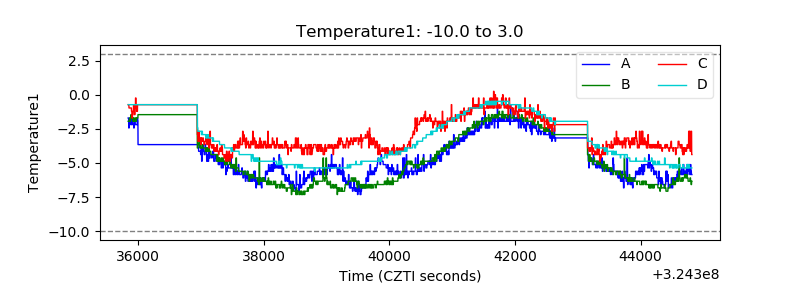 |
| Veto HV Monitor | 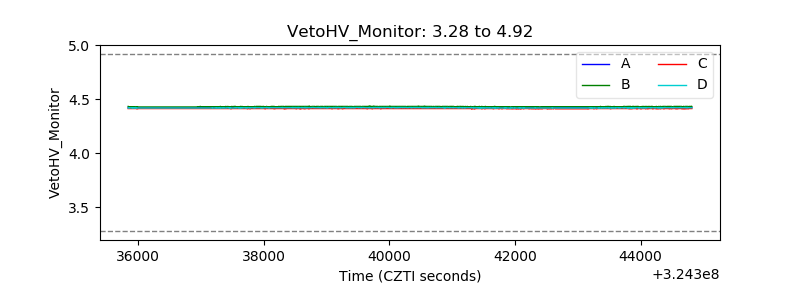 |
| Veto LLD | 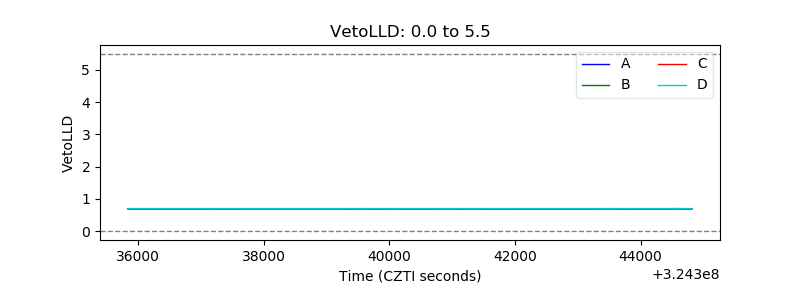 |
| Alpha Counter |  |
| _CPM_Rate |  |
| CZT Counter | 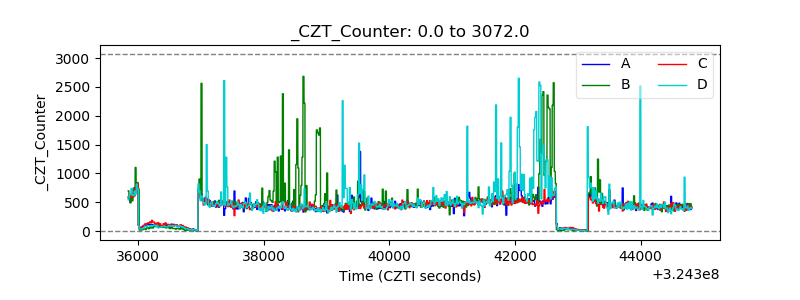 |
| +2.5 Volts monitor |  |
| +5 Volts monitor |  |
| _ROLL_ROT | 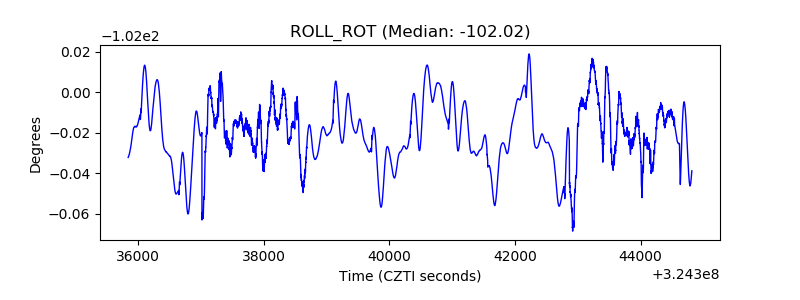 |
| _Roll_DEC | 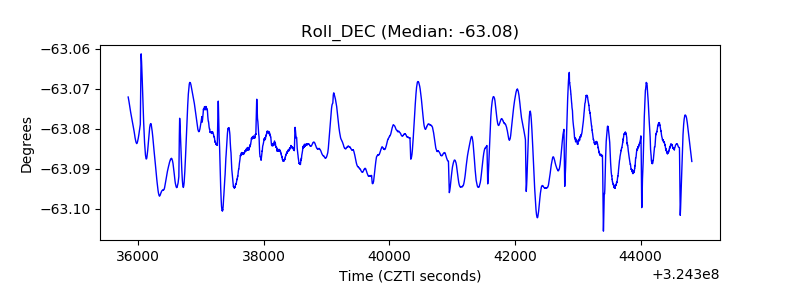 |
| _Roll_RA | 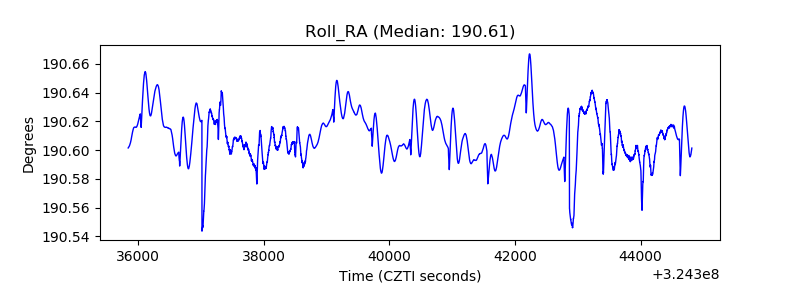 |
| Veto Counter | 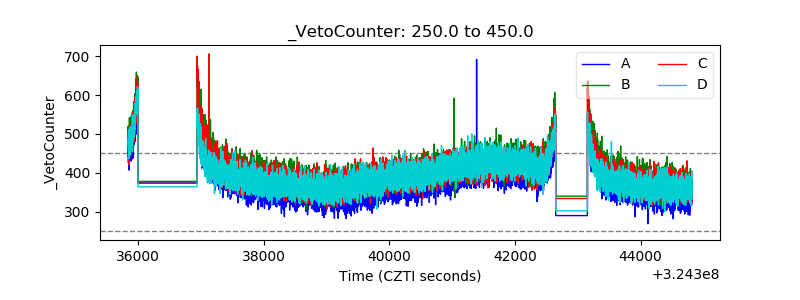 |