| Param | Original file | Final file |
|---|---|---|
| Filename | modeM0/AS1T03_183T01_9000003606_24539cztM0_level2.evt | modeM0/AS1T03_183T01_9000003606_24539cztM0_level2_quad_clean.evt |
| Size (bytes) | 522,167,040 | 134,282,880 |
| Size | 498.0 MB | 128.1 MB |
| Events in quadrant A | 3,492,892 | 908,328 |
| Events in quadrant B | 3,756,031 | 919,442 |
| Events in quadrant C | 3,566,334 | 867,732 |
| Events in quadrant D | 4,478,179 | 838,614 |
| Mode M0 | |||
|---|---|---|---|
| Quadrant | BADHDUFLAG | Total packets | Discarded packets |
| A | 0 | 15590 | 1 |
| B | 0 | 16212 | 1 |
| C | 0 | 15732 | 1 |
| D | 0 | 18687 | 1 |
| Mode SS | |||
|---|---|---|---|
| Quadrant | BADHDUFLAG | Total packets | Discarded packets |
| A | 0 | 156 | 0 |
| B | 0 | 156 | 0 |
| C | 0 | 156 | 0 |
| D | 0 | 156 | 0 |
| Mode M9 | |||
|---|---|---|---|
| Quadrant | BADHDUFLAG | Total packets | Discarded packets |
| A | 0 | 1 | 0 |
| B | 0 | 1 | 0 |
| C | 0 | 1 | 0 |
| D | 0 | 1 | 0 |
| Quadrant | Total seconds | Saturated seconds | Saturation percentage |
|---|---|---|---|
| A | 7658 | 43 | 0.561504% |
| B | 7659 | 134 | 1.749576% |
| C | 7659 | 128 | 1.671236% |
| D | 7659 | 259 | 3.381643% |
Noise dominated data is calculated using 1-second bins in cleaned event files. If a bin has >2000 counts, and if more than 50% of those come from <1% of pixels, then it is considered to be noise-dominated and hence unusable.
| Quadrant | # 1 sec bins | Bins with >0 counts | Bins with >2000 counts | High rate bins dominated by noise | Noise dominated (total time) | Noise dominated (detector-on time) | Marked lightcurve |
|---|---|---|---|---|---|---|---|
| A | 7838 | 7659 | 0 | 0 | 0.00% | 0.00% |  |
| B | 7839 | 7660 | 30 | 30 | 0.38% | 0.39% |  |
| C | 7839 | 7660 | 14 | 14 | 0.18% | 0.18% |  |
| D | 7839 | 7660 | 183 | 183 | 2.33% | 2.39% |  |
Top three noisy pixels from each quadrant. If the there are fewer than three noisy pixels in the level2.evt file, extra rows are filled as -1
| Pixel properties | Quadrant properties | ||||||
|---|---|---|---|---|---|---|---|
| Quadrant | DetID | PixID | Counts | Sigma | Mean | Median | Sigma |
| A | 13 | 254 | 12291 | 63.42 | 902 | 883 | 179.9 |
| A | 6 | 16 | 9391 | 47.3 | 902 | 883 | 179.9 |
| A | 3 | 137 | 8376 | 41.65 | 902 | 883 | 179.9 |
| B | 3 | 64 | 192993 | 1123.65 | 902 | 879 | 171.0 |
| B | 12 | 111 | 21116 | 118.36 | 902 | 879 | 171.0 |
| B | 11 | 111 | 18525 | 103.21 | 902 | 879 | 171.0 |
| C | 14 | 238 | 138890 | 689.68 | 860 | 866 | 200.1 |
| C | 2 | 16 | 51996 | 255.49 | 860 | 866 | 200.1 |
| C | 5 | 112 | 20324 | 97.23 | 860 | 866 | 200.1 |
| D | 9 | 1 | 653189 | 3109.84 | 859 | 832 | 209.8 |
| D | 12 | 218 | 253825 | 1206.04 | 859 | 832 | 209.8 |
| D | 8 | 195 | 124859 | 591.25 | 859 | 832 | 209.8 |
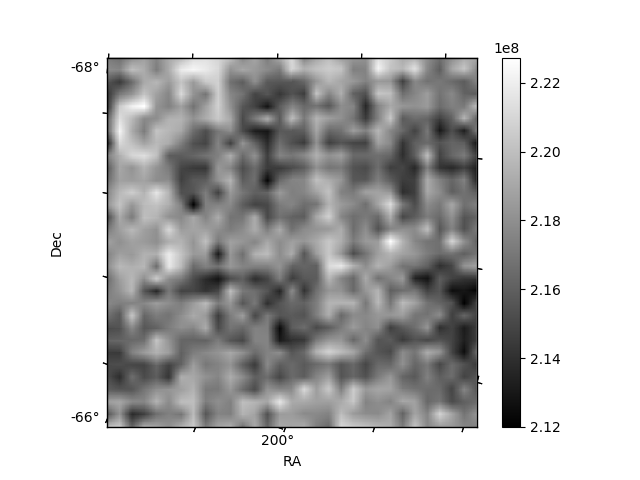
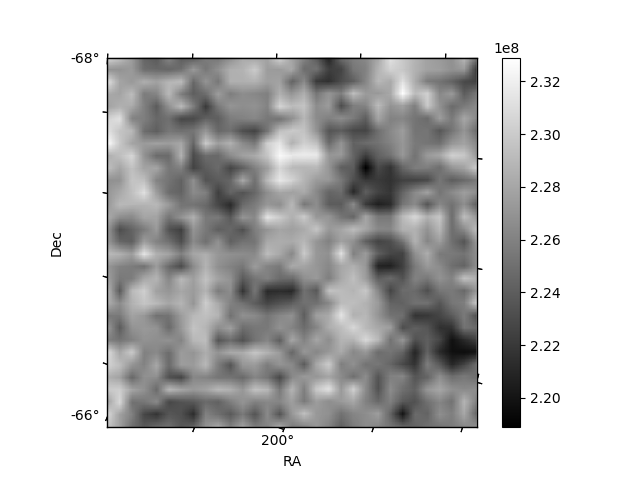
Histogram calculated using DETX and DETY for each event in the final _common_clean file
| Quadrant A | 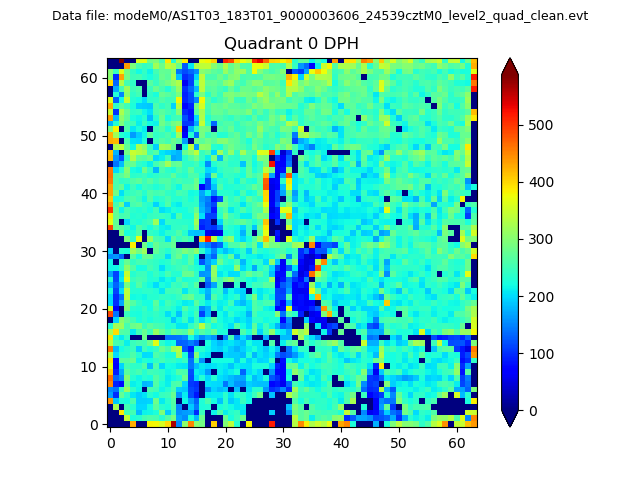 |
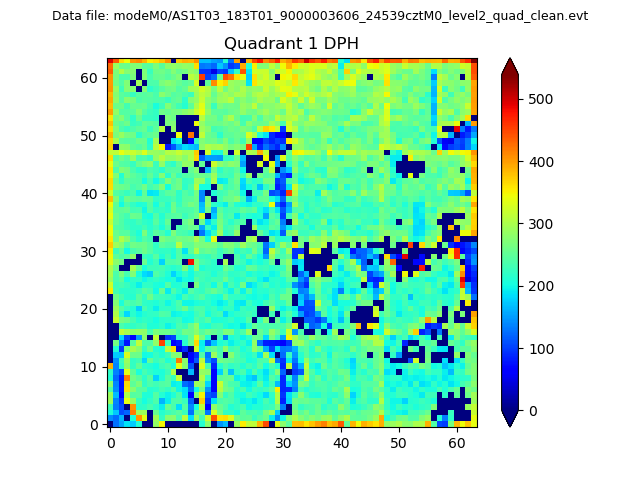 |
Quadrant B |
|---|---|---|---|
| Quadrant D |  |
 |
Quadrant C |
| Plot type | Count rate plots | Images |
|---|---|---|
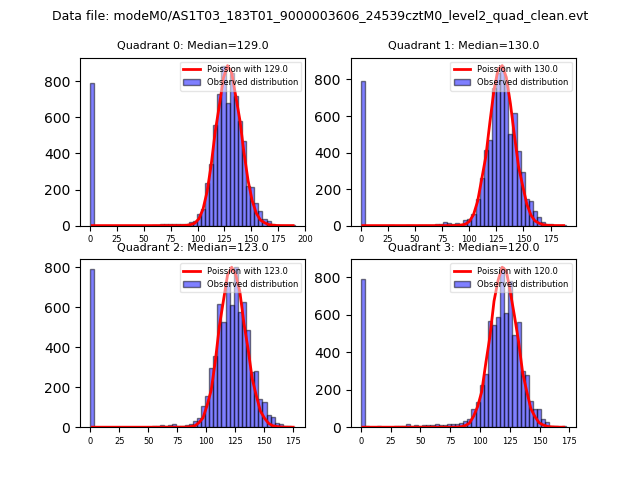
| Comparison with Poisson distribution Blue bars denote a histogram of data divided into 1 sec bins. Red curve is a Poisson curve with rate = median count rate of data. |
 |
 |
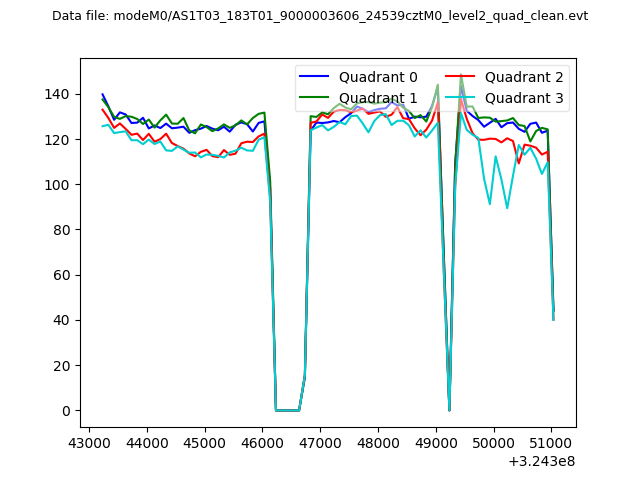
| Quadrant-wise count rates Data is divided into 100 sec bins |
 |
|
| Module-wise count rates for Quadrant A Data is divided into 100 sec bins |
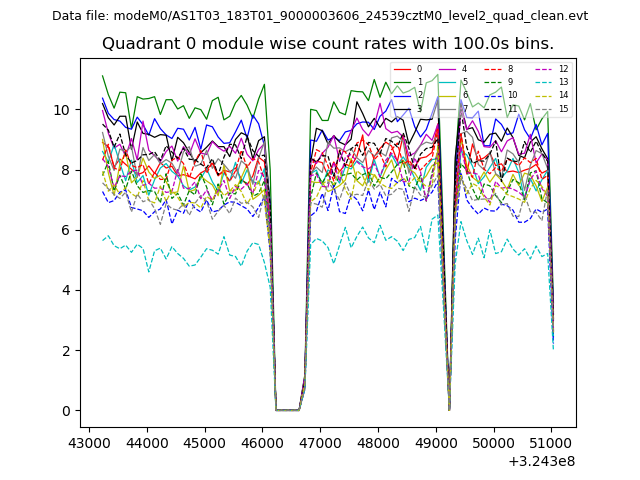 |
 |
| Module-wise count rates for Quadrant B Data is divided into 100 sec bins |
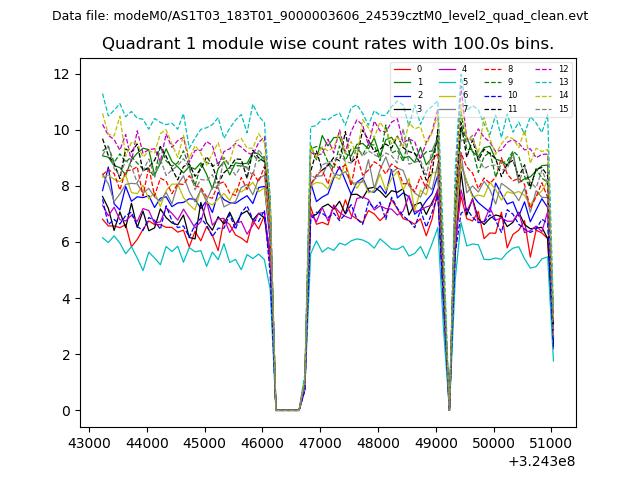 |
 |
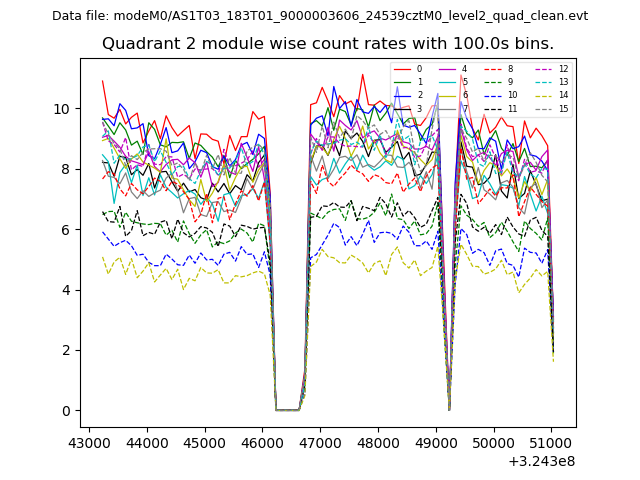
| Module-wise count rates for Quadrant C Data is divided into 100 sec bins |
 |
 |
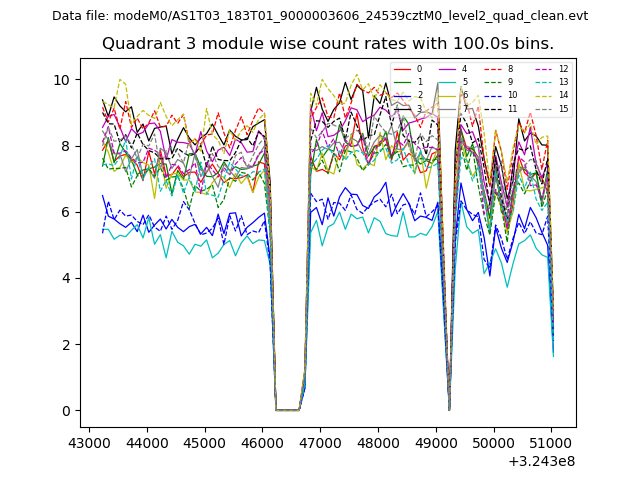
| Module-wise count rates for Quadrant D Data is divided into 100 sec bins |
 |
 |
| Parameter | Plot |
|---|---|
| CZT HV Monitor | 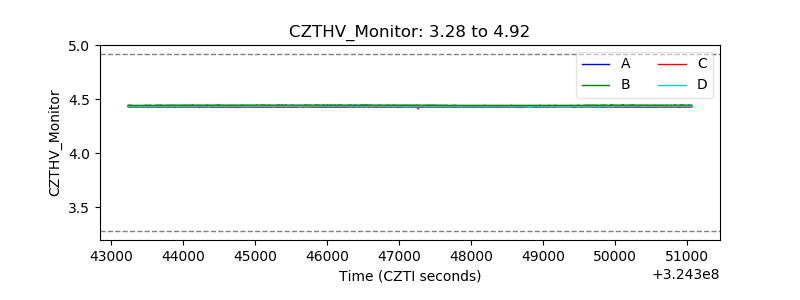 |
| D_VDD | 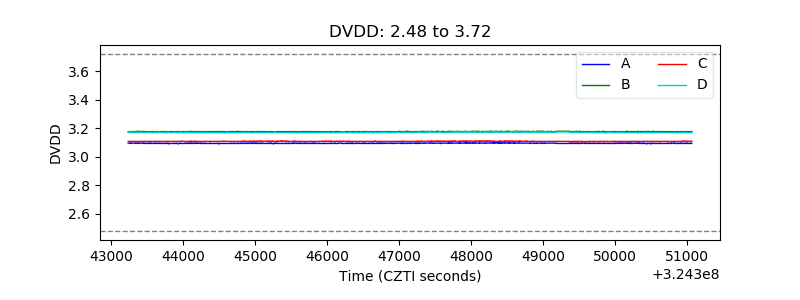 |
| Temperature 1 | 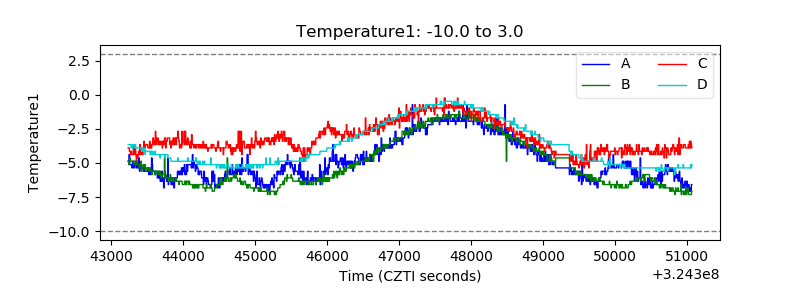 |
| Veto HV Monitor | 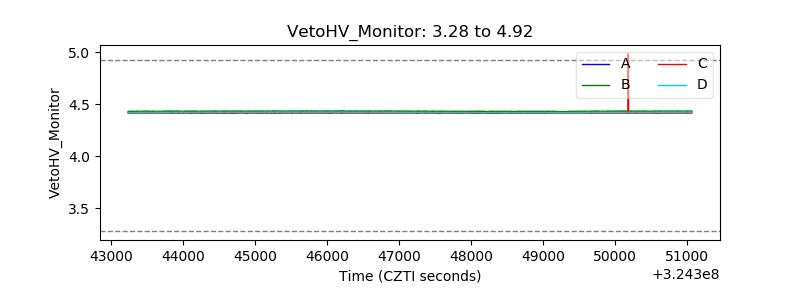 |
| Veto LLD | 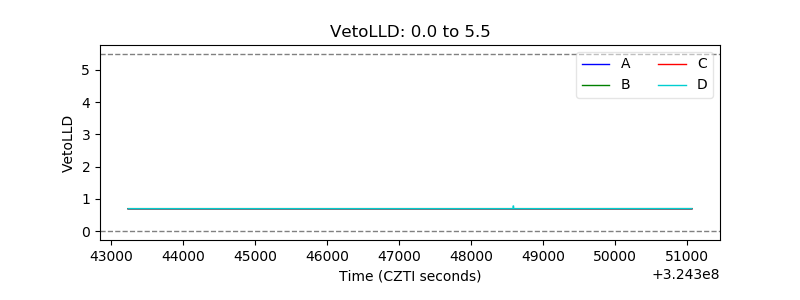 |
| Alpha Counter | 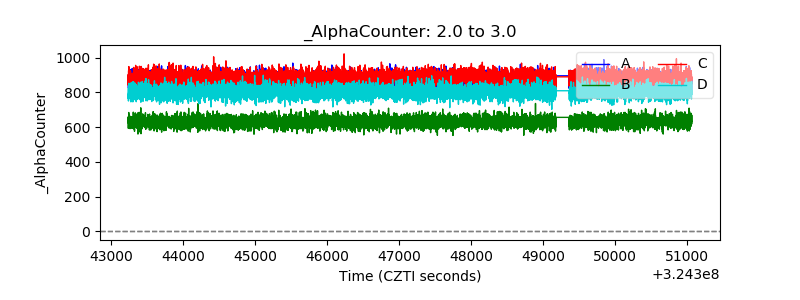 |
| _CPM_Rate | 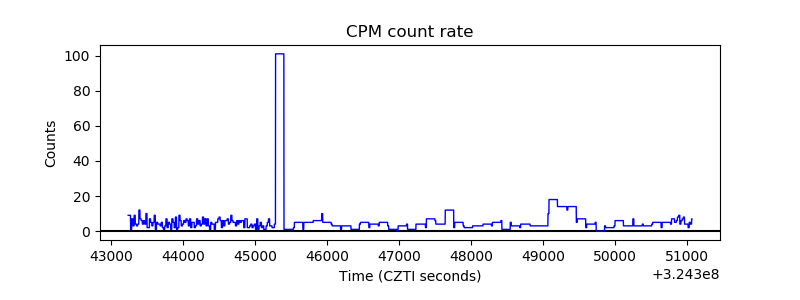 |
| CZT Counter |  |
| +2.5 Volts monitor |  |
| +5 Volts monitor | 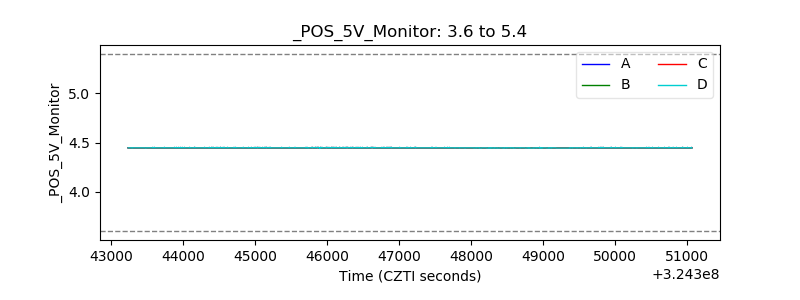 |
| _ROLL_ROT | 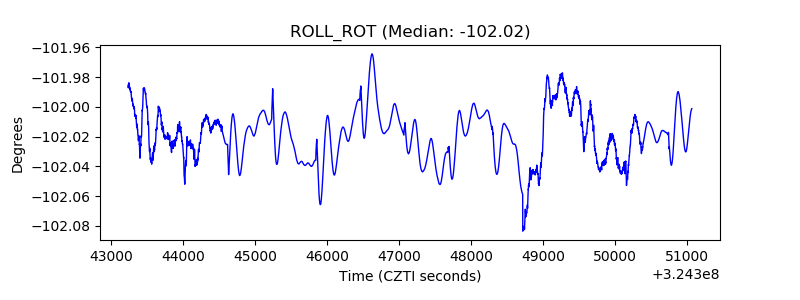 |
| _Roll_DEC | 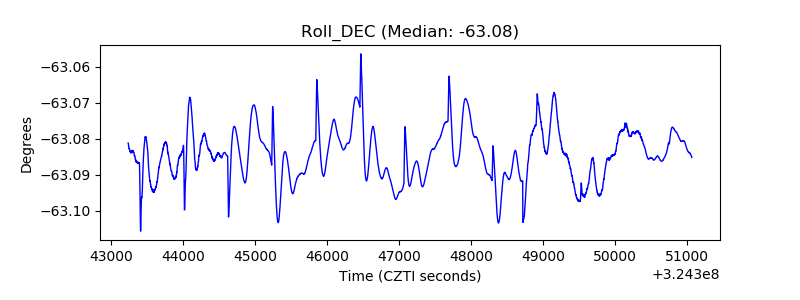 |
| _Roll_RA |  |
| Veto Counter | 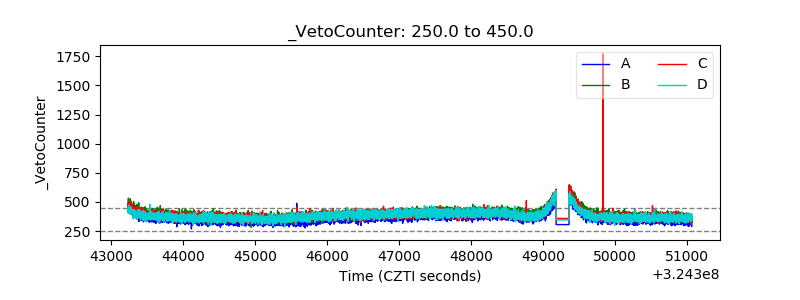 |