| Param | Original file | Final file |
|---|---|---|
| Filename | modeM0/AS1T03_183T01_9000003606_24543cztM0_level2.evt | modeM0/AS1T03_183T01_9000003606_24543cztM0_level2_quad_clean.evt |
| Size (bytes) | 1,381,798,080 | 312,747,840 |
| Size | 1.3 GB | 298.3 MB |
| Events in quadrant A | 8,499,662 | 2,097,235 |
| Events in quadrant B | 12,233,699 | 2,095,181 |
| Events in quadrant C | 8,696,148 | 2,036,241 |
| Events in quadrant D | 11,173,015 | 1,974,350 |
| Mode M0 | |||
|---|---|---|---|
| Quadrant | BADHDUFLAG | Total packets | Discarded packets |
| A | 0 | 37608 | 5 |
| B | 0 | 48224 | 4 |
| C | 0 | 37893 | 4 |
| D | 0 | 45352 | 4 |
| Mode SS | |||
|---|---|---|---|
| Quadrant | BADHDUFLAG | Total packets | Discarded packets |
| A | 0 | 378 | 0 |
| B | 0 | 378 | 0 |
| C | 0 | 378 | 0 |
| D | 0 | 378 | 0 |
| Mode M9 | |||
|---|---|---|---|
| Quadrant | BADHDUFLAG | Total packets | Discarded packets |
| A | 0 | 22 | 0 |
| B | 0 | 22 | 0 |
| C | 0 | 22 | 0 |
| D | 0 | 22 | 0 |
| Quadrant | Total seconds | Saturated seconds | Saturation percentage |
|---|---|---|---|
| A | 18422 | 212 | 1.150798% |
| B | 18422 | 1469 | 7.974161% |
| C | 18423 | 359 | 1.948651% |
| D | 18423 | 537 | 2.914835% |
Noise dominated data is calculated using 1-second bins in cleaned event files. If a bin has >2000 counts, and if more than 50% of those come from <1% of pixels, then it is considered to be noise-dominated and hence unusable.
| Quadrant | # 1 sec bins | Bins with >0 counts | Bins with >2000 counts | High rate bins dominated by noise | Noise dominated (total time) | Noise dominated (detector-on time) | Marked lightcurve |
|---|---|---|---|---|---|---|---|
| A | 20647 | 18426 | 2 | 2 | 0.01% | 0.01% | 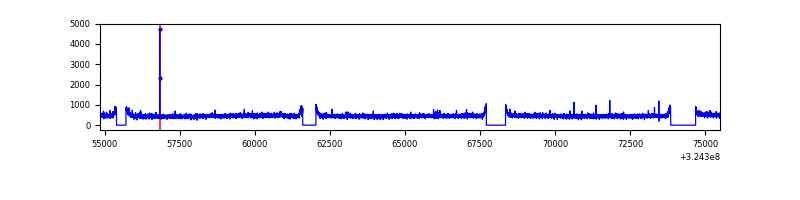 |
| B | 20647 | 18425 | 931 | 931 | 4.51% | 5.05% | 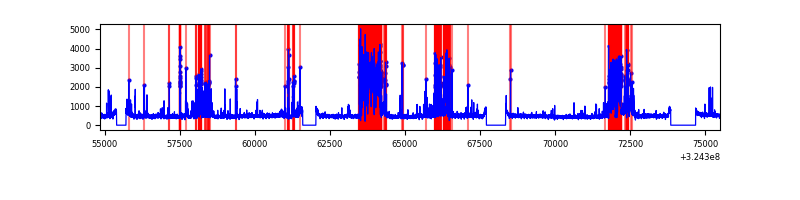 |
| C | 20648 | 18425 | 3 | 3 | 0.01% | 0.02% | 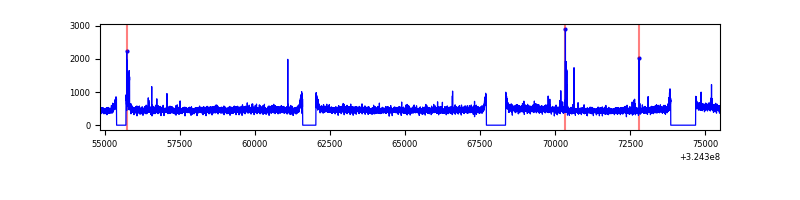 |
| D | 20648 | 18427 | 291 | 291 | 1.41% | 1.58% | 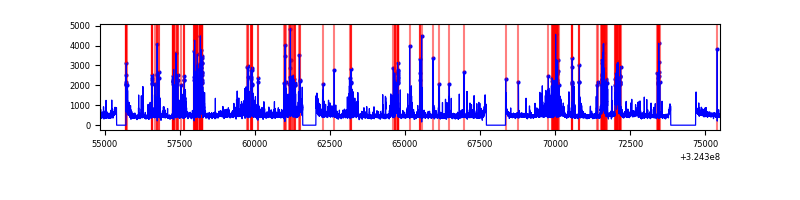 |
Top three noisy pixels from each quadrant. If the there are fewer than three noisy pixels in the level2.evt file, extra rows are filled as -1
| Pixel properties | Quadrant properties | ||||||
|---|---|---|---|---|---|---|---|
| Quadrant | DetID | PixID | Counts | Sigma | Mean | Median | Sigma |
| A | 13 | 254 | 29396 | 61.65 | 2200 | 2150 | 441.9 |
| A | 3 | 137 | 20343 | 41.17 | 2200 | 2150 | 441.9 |
| A | 0 | 226 | 18690 | 37.43 | 2200 | 2150 | 441.9 |
| B | 3 | 64 | 3750462 | 9282.03 | 2141 | 2084 | 403.8 |
| B | 12 | 111 | 49984 | 118.61 | 2141 | 2084 | 403.8 |
| B | 11 | 111 | 44934 | 106.11 | 2141 | 2084 | 403.8 |
| C | 14 | 238 | 335427 | 680.49 | 2111 | 2116 | 489.8 |
| C | 2 | 16 | 91538 | 182.56 | 2111 | 2116 | 489.8 |
| C | 3 | 233 | 27820 | 52.48 | 2111 | 2116 | 489.8 |
| D | 9 | 1 | 1177127 | 2279.76 | 2124 | 2055 | 515.4 |
| D | 1 | 52 | 878953 | 1701.27 | 2124 | 2055 | 515.4 |
| D | 12 | 218 | 701931 | 1357.83 | 2124 | 2055 | 515.4 |
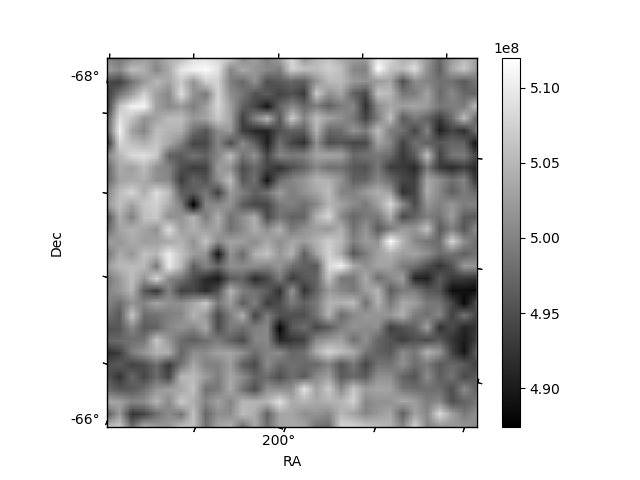
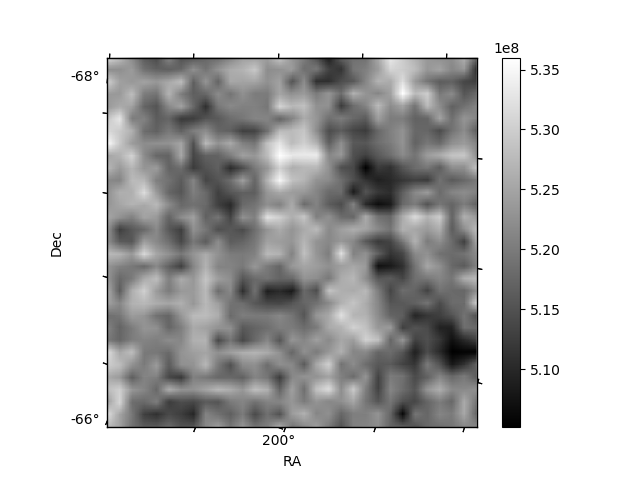
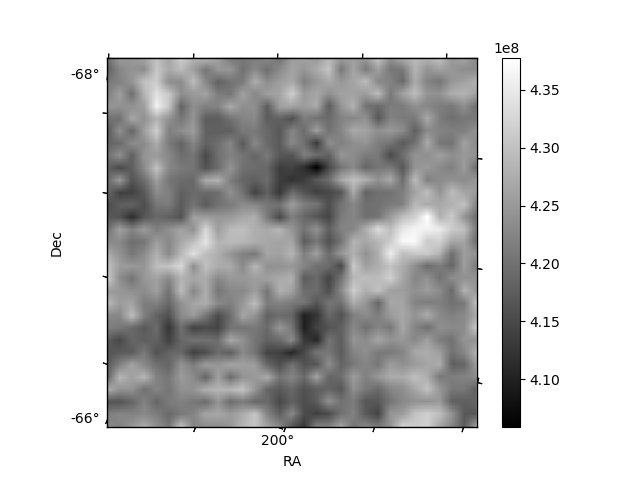
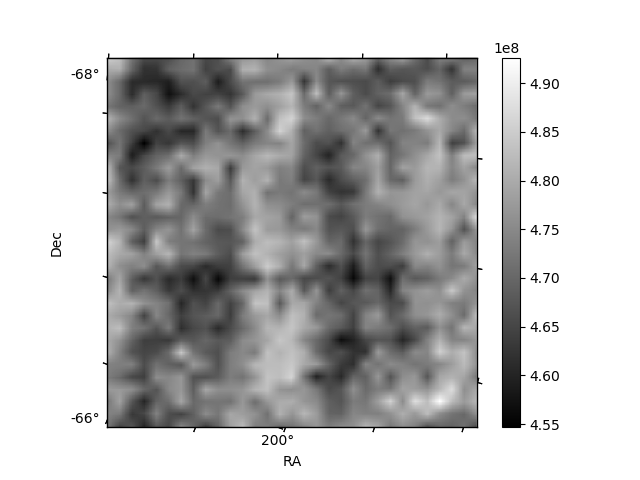
Histogram calculated using DETX and DETY for each event in the final _common_clean file
| Quadrant A | 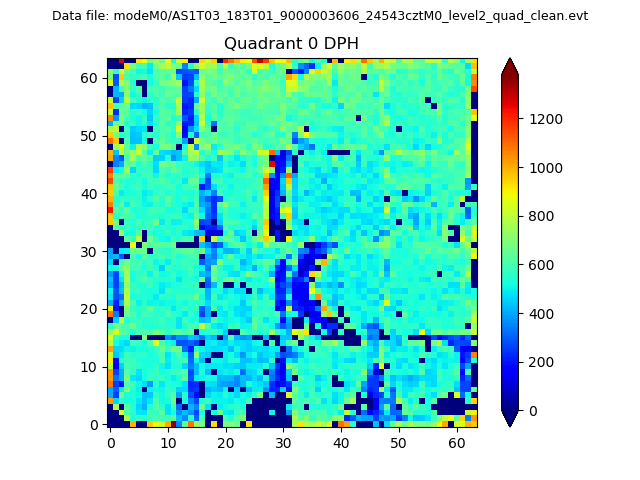 |
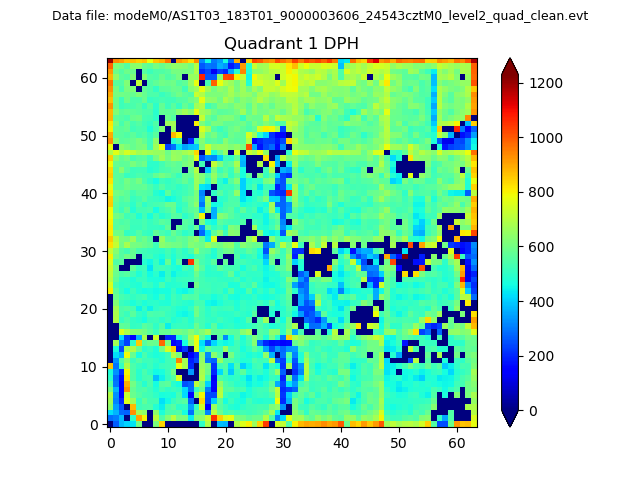 |
Quadrant B |
|---|---|---|---|
| Quadrant D |  |
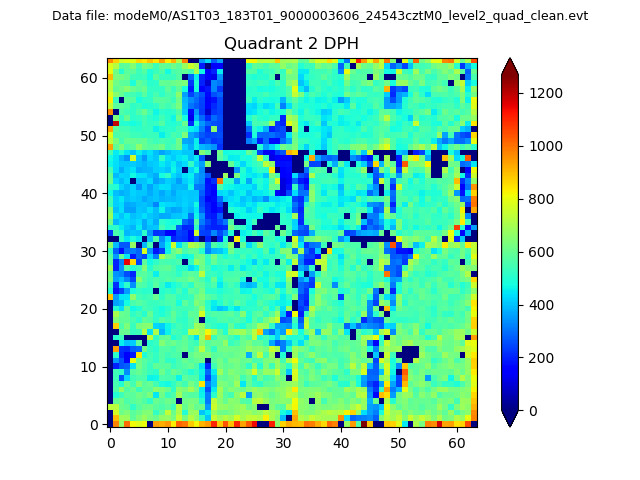 |
Quadrant C |
| Plot type | Count rate plots | Images |
|---|---|---|
| Comparison with Poisson distribution Blue bars denote a histogram of data divided into 1 sec bins. Red curve is a Poisson curve with rate = median count rate of data. |
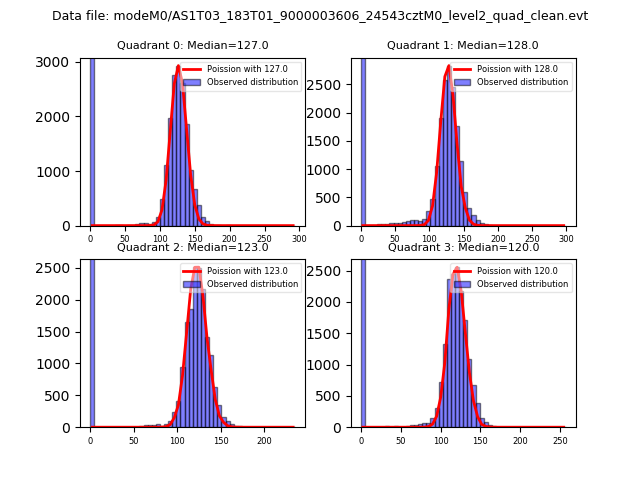 |
 |
| Quadrant-wise count rates Data is divided into 100 sec bins |
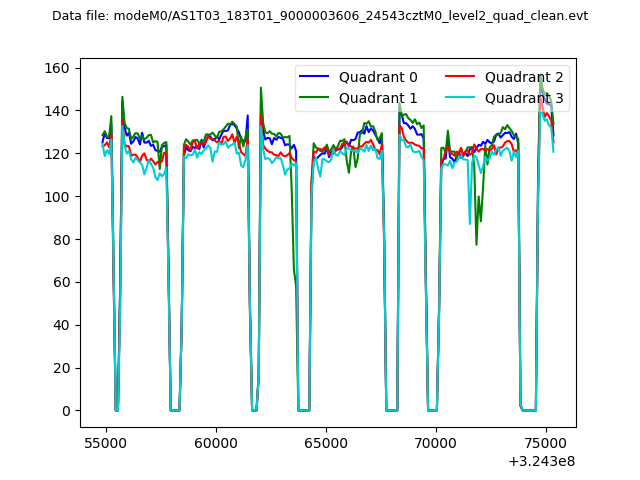 |
|
| Module-wise count rates for Quadrant A Data is divided into 100 sec bins |
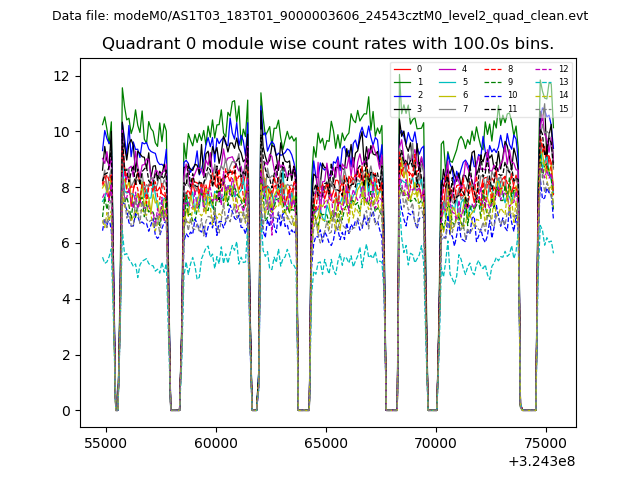 |
 |
| Module-wise count rates for Quadrant B Data is divided into 100 sec bins |
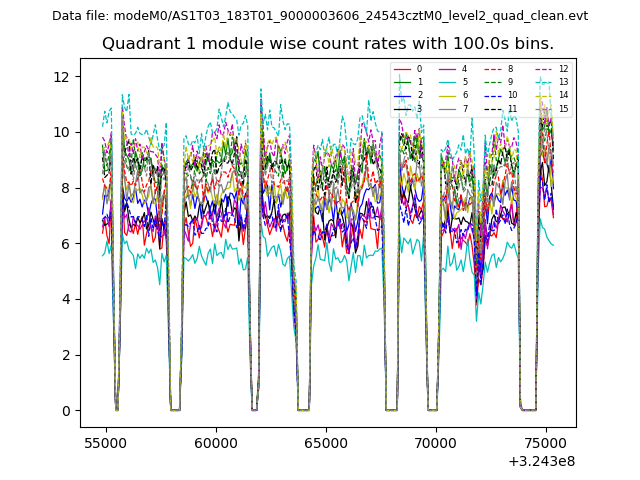 |
 |
| Module-wise count rates for Quadrant C Data is divided into 100 sec bins |
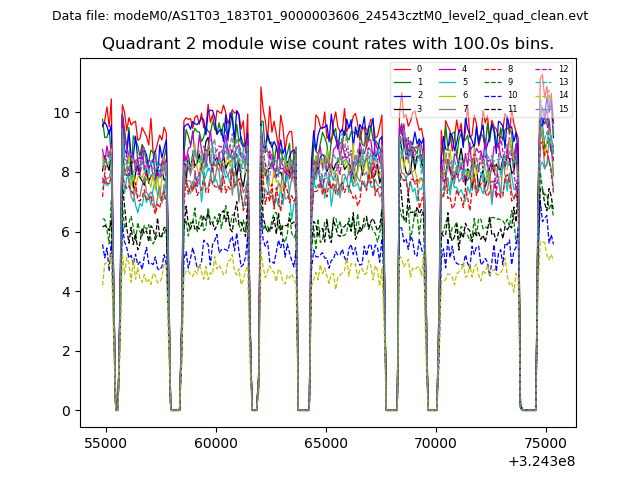 |
 |
| Module-wise count rates for Quadrant D Data is divided into 100 sec bins |
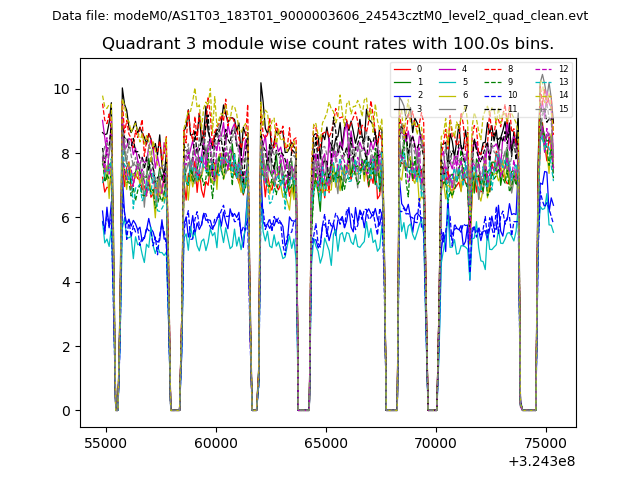 |
 |
| Parameter | Plot |
|---|---|
| CZT HV Monitor | 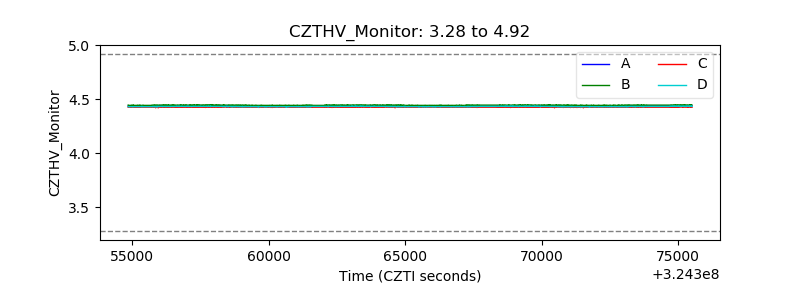 |
| D_VDD | 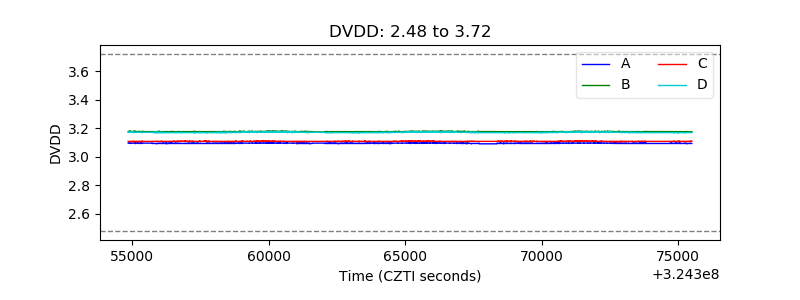 |
| Temperature 1 | 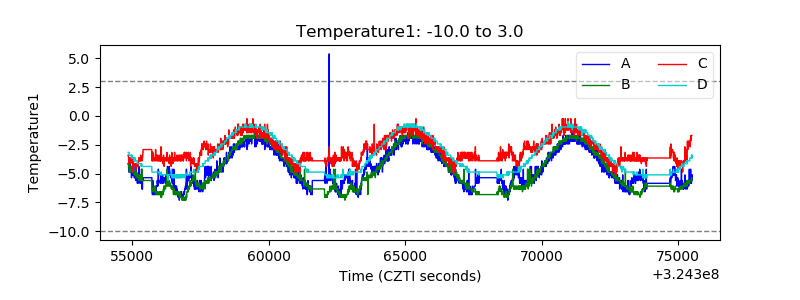 |
| Veto HV Monitor |  |
| Veto LLD | 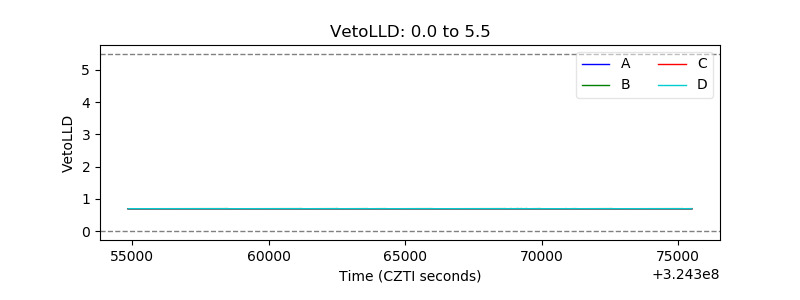 |
| Alpha Counter | 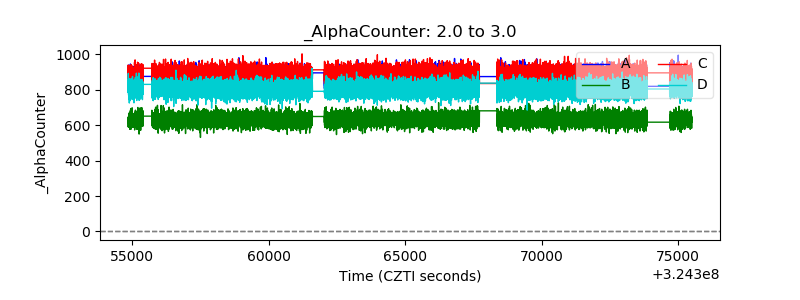 |
| _CPM_Rate | 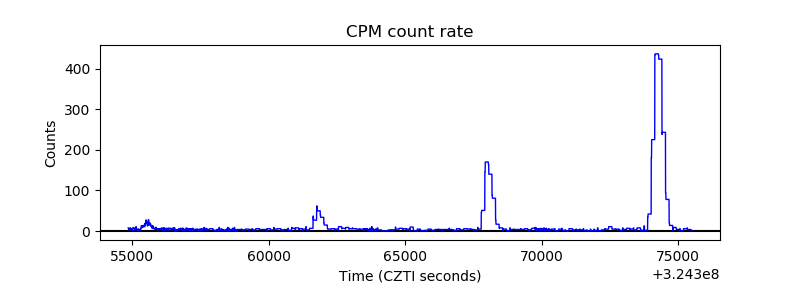 |
| CZT Counter | 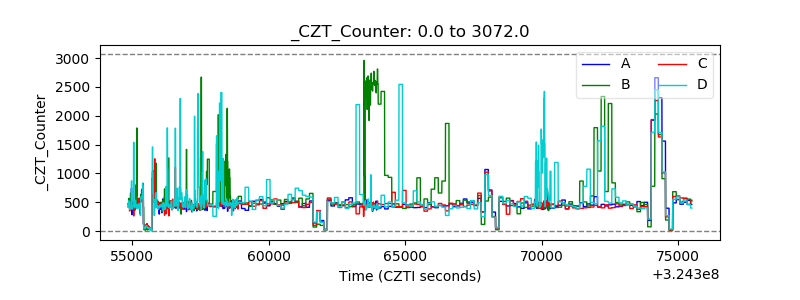 |
| +2.5 Volts monitor | 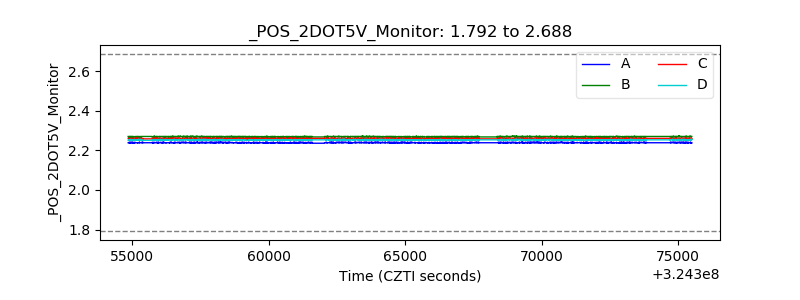 |
| +5 Volts monitor |  |
| _ROLL_ROT | 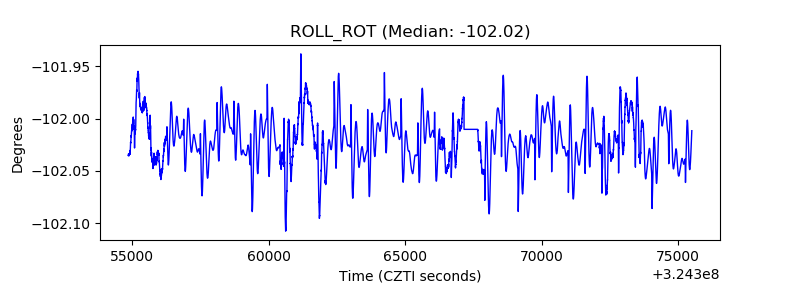 |
| _Roll_DEC | 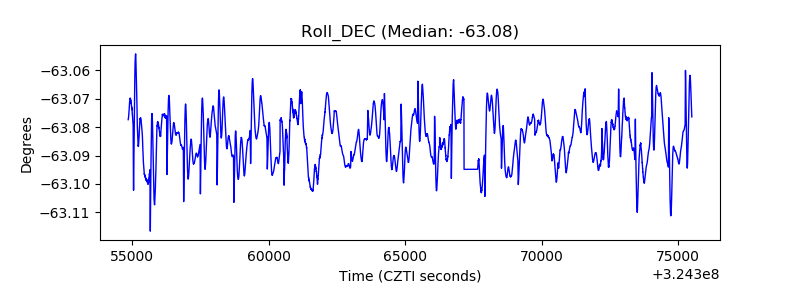 |
| _Roll_RA | 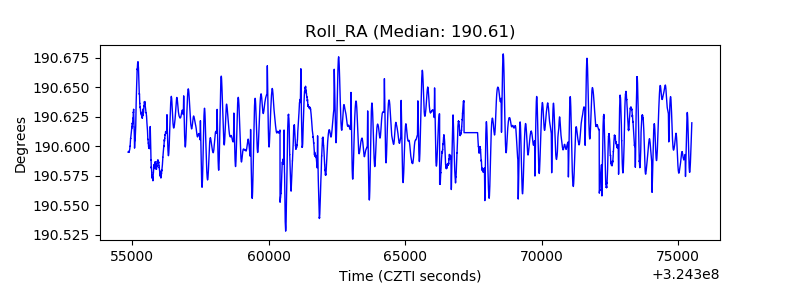 |
| Veto Counter | 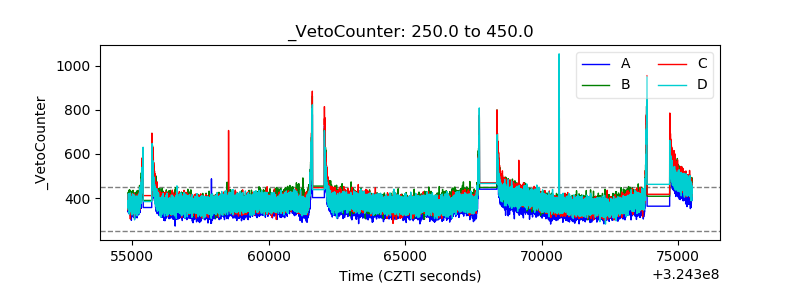 |