| Param | Original file | Final file |
|---|---|---|
| Filename | modeM0/AS1T03_183T01_9000003606_24544cztM0_level2.evt | modeM0/AS1T03_183T01_9000003606_24544cztM0_level2_quad_clean.evt |
| Size (bytes) | 442,160,640 | 101,566,080 |
| Size | 421.7 MB | 96.9 MB |
| Events in quadrant A | 3,014,727 | 669,448 |
| Events in quadrant B | 3,099,403 | 680,796 |
| Events in quadrant C | 3,054,213 | 650,625 |
| Events in quadrant D | 3,793,589 | 634,672 |
| Mode M0 | |||
|---|---|---|---|
| Quadrant | BADHDUFLAG | Total packets | Discarded packets |
| A | 0 | 13071 | 1 |
| B | 0 | 13163 | 1 |
| C | 0 | 13190 | 1 |
| D | 0 | 15410 | 1 |
| Mode SS | |||
|---|---|---|---|
| Quadrant | BADHDUFLAG | Total packets | Discarded packets |
| A | 0 | 130 | 0 |
| B | 0 | 130 | 0 |
| C | 0 | 130 | 0 |
| D | 0 | 130 | 0 |
| Mode M9 | |||
|---|---|---|---|
| Quadrant | BADHDUFLAG | Total packets | Discarded packets |
| A | 0 | 9 | 0 |
| B | 0 | 9 | 0 |
| C | 0 | 9 | 0 |
| D | 0 | 9 | 0 |
| Quadrant | Total seconds | Saturated seconds | Saturation percentage |
|---|---|---|---|
| A | 6304 | 59 | 0.935914% |
| B | 6305 | 67 | 1.062649% |
| C | 6305 | 114 | 1.808089% |
| D | 6305 | 73 | 1.157811% |
Noise dominated data is calculated using 1-second bins in cleaned event files. If a bin has >2000 counts, and if more than 50% of those come from <1% of pixels, then it is considered to be noise-dominated and hence unusable.
| Quadrant | # 1 sec bins | Bins with >0 counts | Bins with >2000 counts | High rate bins dominated by noise | Noise dominated (total time) | Noise dominated (detector-on time) | Marked lightcurve |
|---|---|---|---|---|---|---|---|
| A | 7284 | 6304 | 0 | 0 | 0.00% | 0.00% |  |
| B | 7285 | 6305 | 1 | 1 | 0.01% | 0.02% |  |
| C | 7285 | 6305 | 1 | 1 | 0.01% | 0.02% |  |
| D | 7285 | 6305 | 8 | 8 | 0.11% | 0.13% |  |
Top three noisy pixels from each quadrant. If the there are fewer than three noisy pixels in the level2.evt file, extra rows are filled as -1
| Pixel properties | Quadrant properties | ||||||
|---|---|---|---|---|---|---|---|
| Quadrant | DetID | PixID | Counts | Sigma | Mean | Median | Sigma |
| A | 13 | 254 | 9697 | 57.03 | 781 | 764 | 156.6 |
| A | 3 | 137 | 6967 | 39.6 | 781 | 764 | 156.6 |
| A | 0 | 226 | 6628 | 37.43 | 781 | 764 | 156.6 |
| B | 12 | 111 | 17861 | 116.87 | 776 | 757 | 146.4 |
| B | 3 | 64 | 17804 | 116.48 | 776 | 757 | 146.4 |
| B | 3 | 209 | 16528 | 107.76 | 776 | 757 | 146.4 |
| C | 14 | 238 | 119017 | 684.7 | 748 | 753 | 172.7 |
| C | 5 | 112 | 12779 | 69.63 | 748 | 753 | 172.7 |
| C | 13 | 61 | 5192 | 25.7 | 748 | 753 | 172.7 |
| D | 8 | 195 | 315902 | 1709.47 | 762 | 739 | 184.4 |
| D | 12 | 218 | 294698 | 1594.46 | 762 | 739 | 184.4 |
| D | 1 | 52 | 233090 | 1260.29 | 762 | 739 | 184.4 |
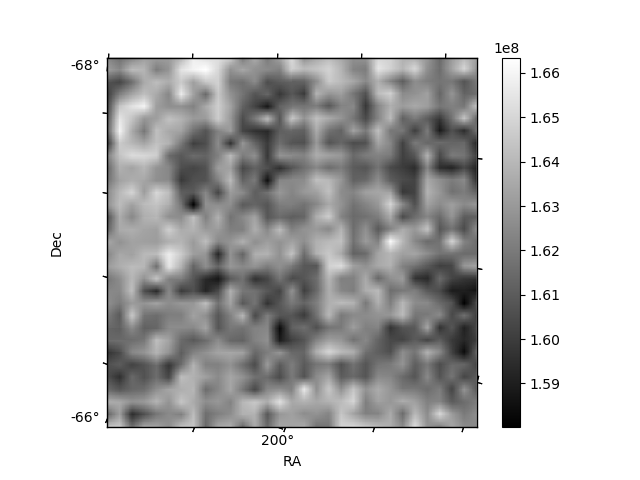
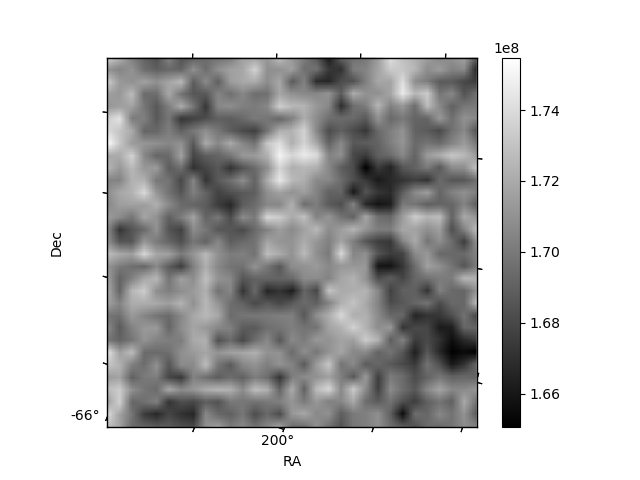
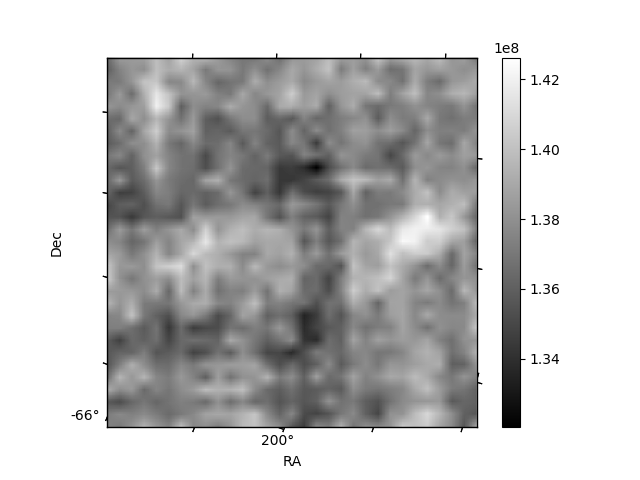
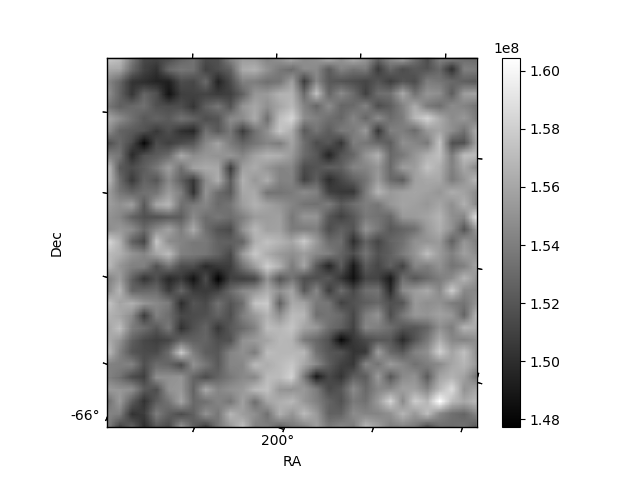
Histogram calculated using DETX and DETY for each event in the final _common_clean file
| Quadrant A |  |
 |
Quadrant B |
|---|---|---|---|
| Quadrant D |  |
 |
Quadrant C |
| Plot type | Count rate plots | Images |
|---|---|---|
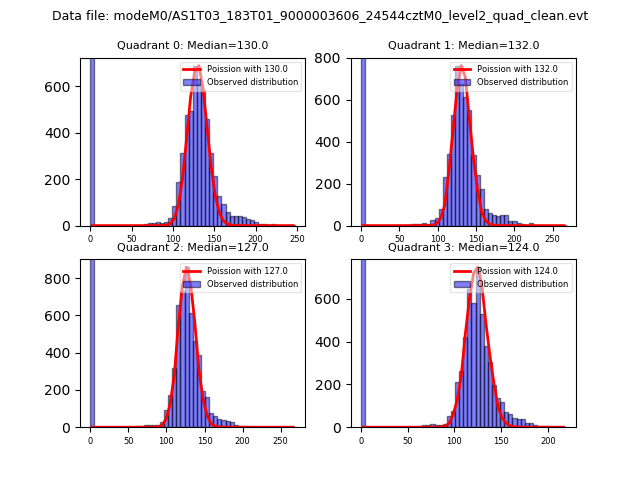
| Comparison with Poisson distribution Blue bars denote a histogram of data divided into 1 sec bins. Red curve is a Poisson curve with rate = median count rate of data. |
 |
 |
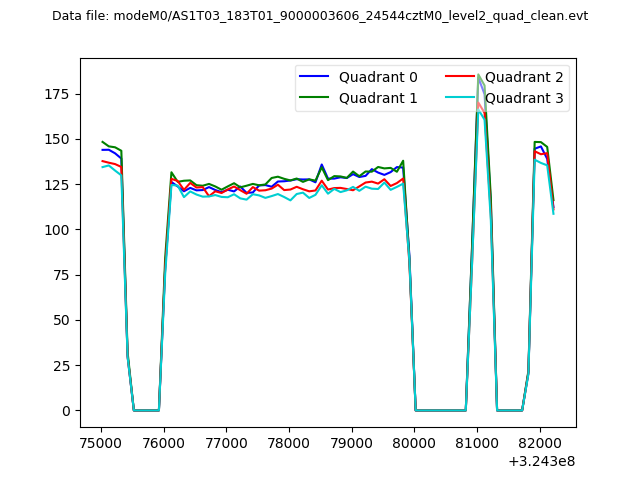
| Quadrant-wise count rates Data is divided into 100 sec bins |
 |
|
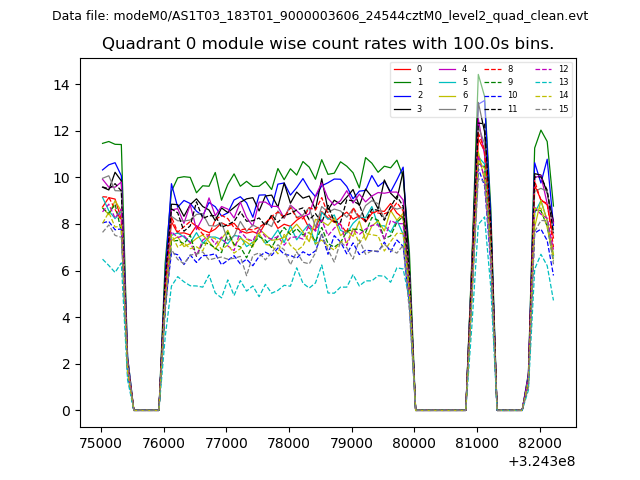
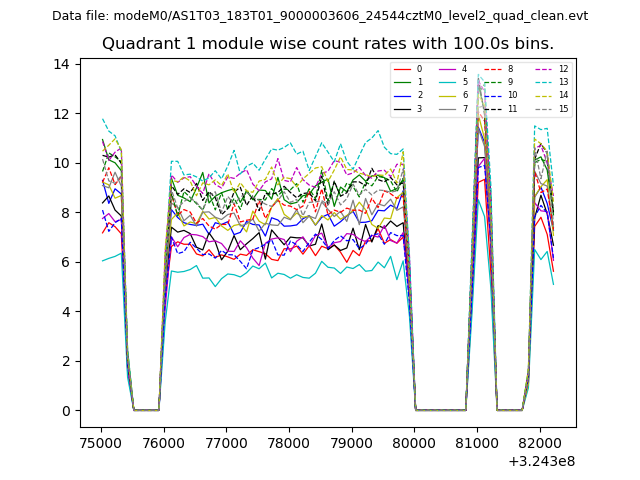
| Module-wise count rates for Quadrant A Data is divided into 100 sec bins |
 |
 |
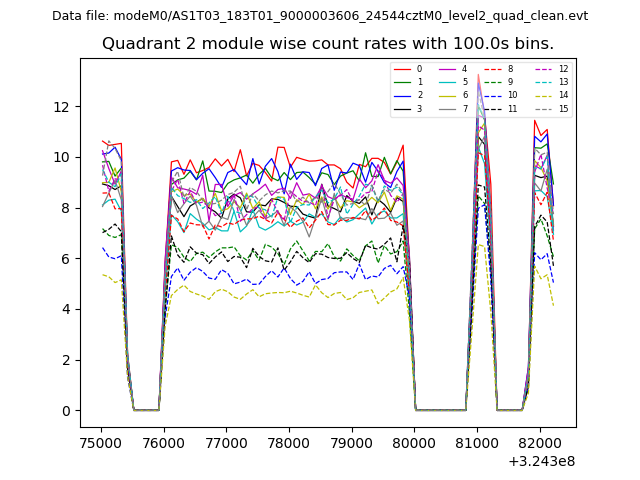
| Module-wise count rates for Quadrant B Data is divided into 100 sec bins |
 |
 |
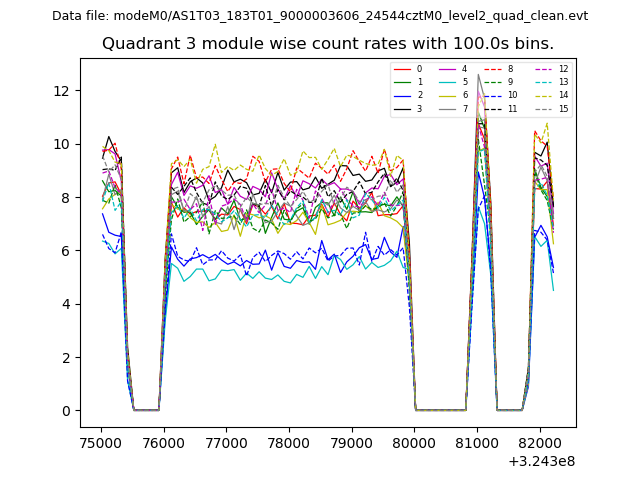
| Module-wise count rates for Quadrant C Data is divided into 100 sec bins |
 |
 |
| Module-wise count rates for Quadrant D Data is divided into 100 sec bins |
 |
 |
| Parameter | Plot |
|---|---|
| CZT HV Monitor | 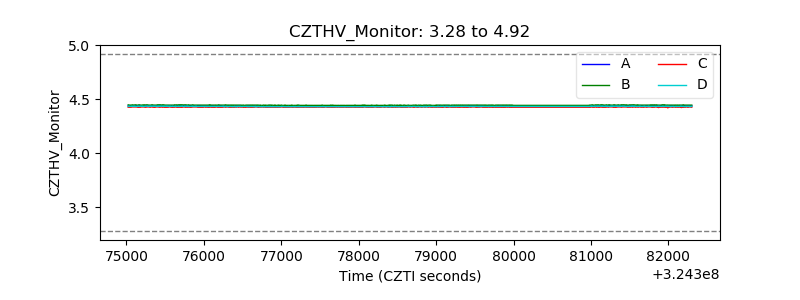 |
| D_VDD | 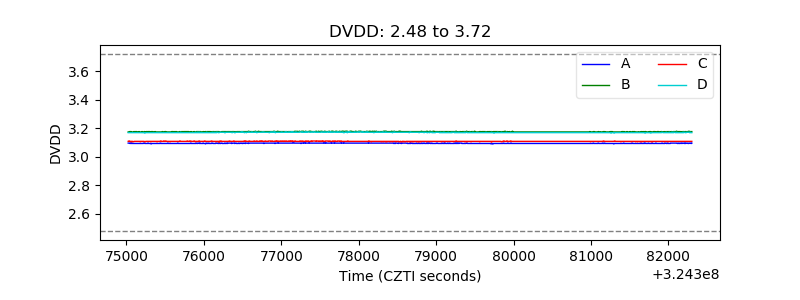 |
| Temperature 1 | 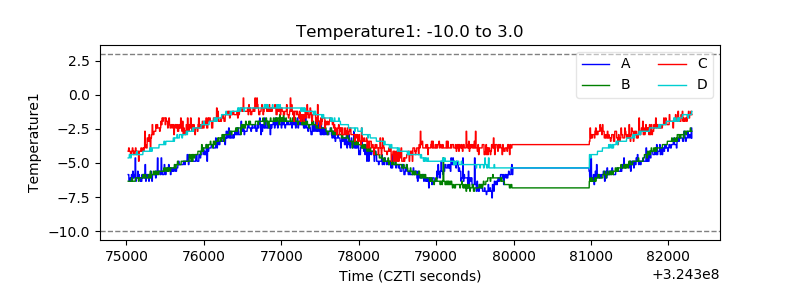 |
| Veto HV Monitor | 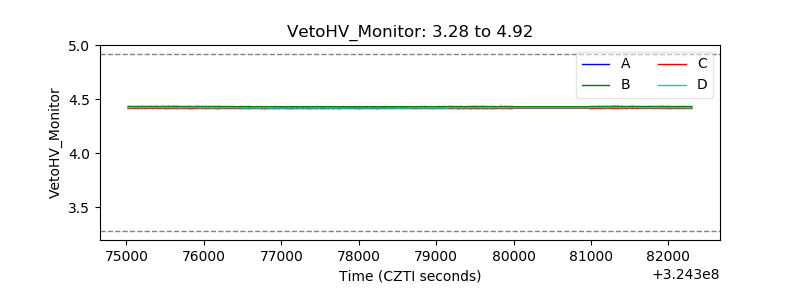 |
| Veto LLD | 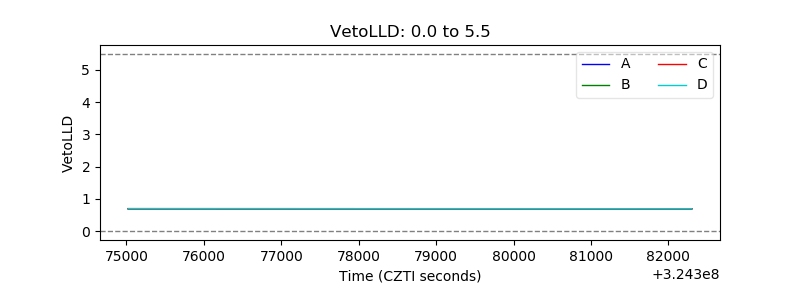 |
| Alpha Counter | 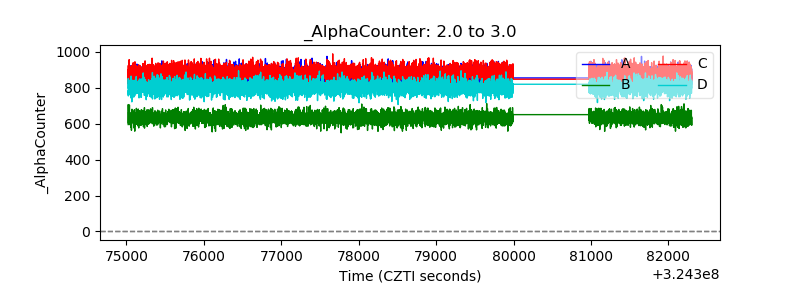 |
| _CPM_Rate | 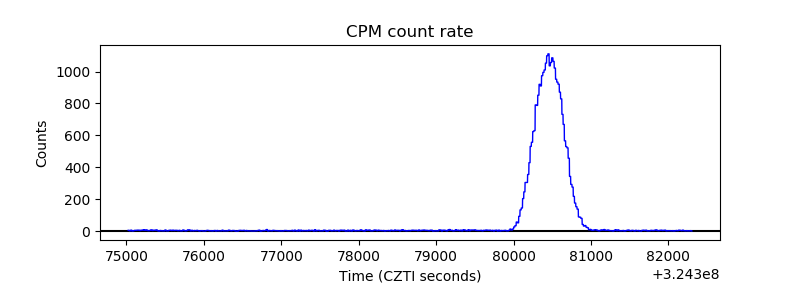 |
| CZT Counter | 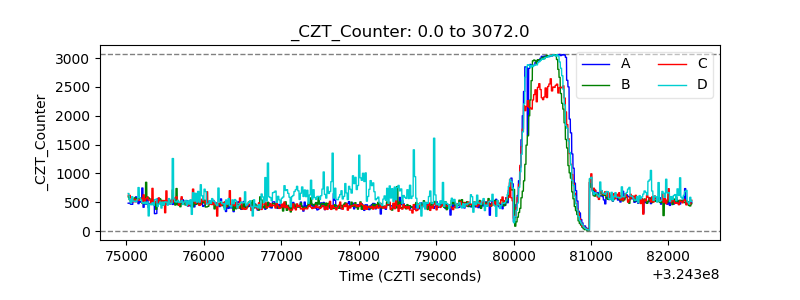 |
| +2.5 Volts monitor |  |
| +5 Volts monitor |  |
| _ROLL_ROT | 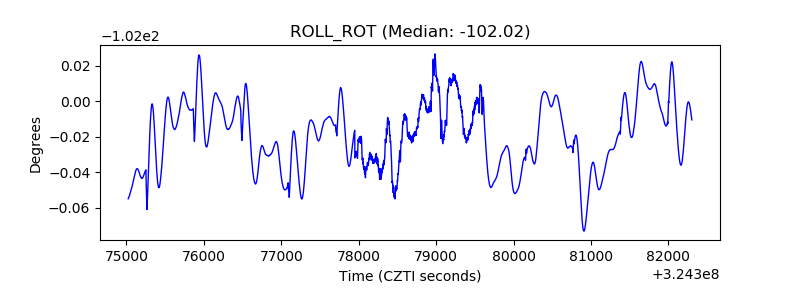 |
| _Roll_DEC | 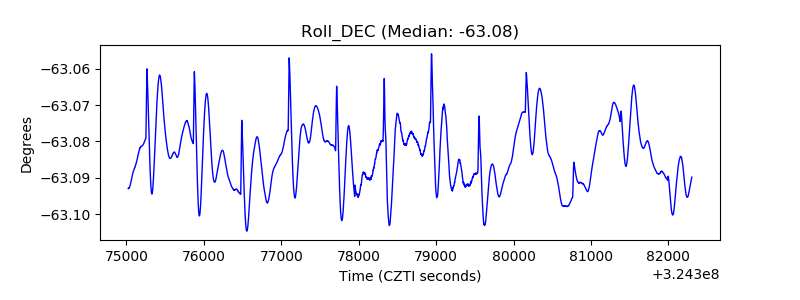 |
| _Roll_RA |  |
| Veto Counter | 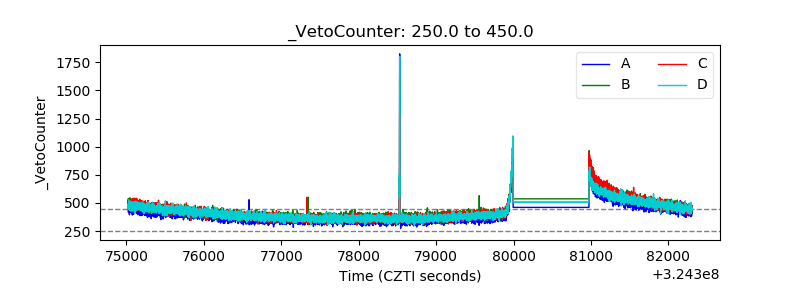 |