| Param | Original file | Final file |
|---|---|---|
| Filename | modeM0/AS1T03_187T01_9000003608cztM0_level2.fits | modeM0/AS1T03_187T01_9000003608cztM0_level2_quad_clean.evt |
| Size (bytes) | 646,076,160 | 707,319,360 |
| Size | 616.1 MB | 674.6 MB |
| Events in quadrant A | 4,081,134 | 4,501,495 |
| Events in quadrant B | 3,861,176 | 4,481,628 |
| Events in quadrant C | 3,849,274 | 4,181,467 |
| Events in quadrant D | 3,288,224 | 3,772,105 |
| Mode SS | |||
|---|---|---|---|
| Quadrant | BADHDUFLAG | Total packets | Discarded packets |
| A | 0 | 1334 | 0 |
| B | 0 | 1334 | 0 |
| C | 0 | 1334 | 0 |
| D | 0 | 1334 | 0 |
| Mode M9 | |||
|---|---|---|---|
| Quadrant | BADHDUFLAG | Total packets | Discarded packets |
| A | 0 | 98 | 0 |
| B | 0 | 98 | 0 |
| C | 0 | 98 | 0 |
| D | 0 | 98 | 0 |
| Mode M0 | |||
|---|---|---|---|
| Quadrant | BADHDUFLAG | Total packets | Discarded packets |
| A | 0 | 135749 | 0 |
| B | 0 | 139275 | 0 |
| C | 0 | 139336 | 0 |
| D | 0 | 224558 | 0 |
| Quadrant | Total seconds | Saturated seconds | Saturation percentage |
|---|---|---|---|
| A | 65394 | 616 | 0.941982% |
| B | 65395 | 977 | 1.493998% |
| C | 65395 | 1069 | 1.634682% |
| D | 65395 | 4328 | 6.618243% |
Noise dominated data is calculated using 1-second bins in cleaned event files. If a bin has >2000 counts, and if more than 50% of those come from <1% of pixels, then it is considered to be noise-dominated and hence unusable.
| Quadrant | # 1 sec bins | Bins with >0 counts | Bins with >2000 counts | High rate bins dominated by noise | Noise dominated (total time) | Noise dominated (detector-on time) | Marked lightcurve |
|---|---|---|---|---|---|---|---|
| A | 75254 | 65393 | 0 | 0 | 0.00% | 0.00% |  |
| B | 75255 | 65390 | 0 | 0 | 0.00% | 0.00% |  |
| C | 75255 | 65393 | 0 | 0 | 0.00% | 0.00% |  |
| D | 75255 | 65371 | 0 | 0 | 0.00% | 0.00% |  |
Top three noisy pixels from each quadrant. If the there are fewer than three noisy pixels in the level2.evt file, extra rows are filled as -1
| Pixel properties | Quadrant properties | ||||||
|---|---|---|---|---|---|---|---|
| Quadrant | DetID | PixID | Counts | Sigma | Mean | Median | Sigma |
| A | 0 | 29 | 3883 | 11.07 | 1062 | 1003 | 260.1 |
| A | 7 | 110 | 3360 | 9.06 | 1062 | 1003 | 260.1 |
| A | 0 | 30 | 3055 | 7.89 | 1062 | 1003 | 260.1 |
| B | 2 | 9 | 3036 | 10.43 | 1022 | 982 | 197.0 |
| B | 5 | 128 | 2561 | 8.01 | 1022 | 982 | 197.0 |
| B | 2 | 8 | 2497 | 7.69 | 1022 | 982 | 197.0 |
| C | 12 | 241 | 2647 | 6.55 | 1018 | 955 | 258.2 |
| C | 12 | 250 | 2576 | 6.28 | 1018 | 955 | 258.2 |
| C | 9 | 209 | 2574 | 6.27 | 1018 | 955 | 258.2 |
| D | 4 | 246 | 2510 | 6.51 | 939 | 857 | 254.1 |
| D | 15 | 46 | 2406 | 6.1 | 939 | 857 | 254.1 |
| D | 3 | 14 | 2397 | 6.06 | 939 | 857 | 254.1 |
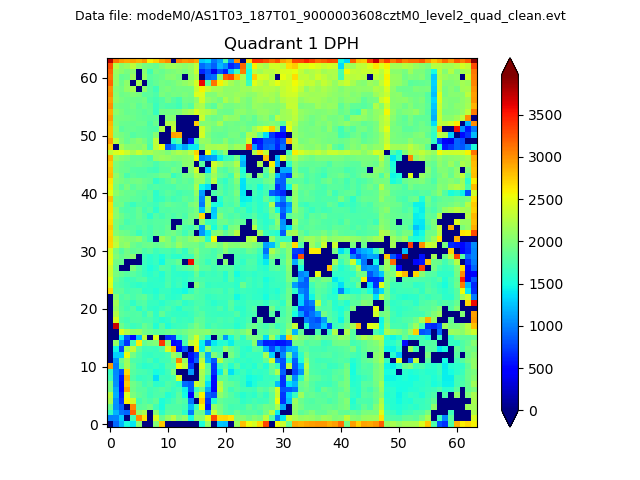
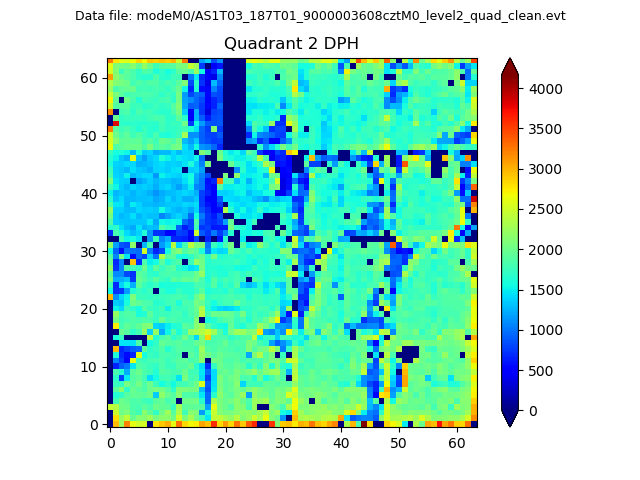
Histogram calculated using DETX and DETY for each event in the final _common_clean file
| Quadrant A |  |
 |
Quadrant B |
|---|---|---|---|
| Quadrant D |  |
 |
Quadrant C |
| Plot type | Count rate plots | Images |
|---|---|---|
| Comparison with Poisson distribution Blue bars denote a histogram of data divided into 1 sec bins. Red curve is a Poisson curve with rate = median count rate of data. |
 |
 |
| Quadrant-wise count rates Data is divided into 100 sec bins |
 |
|
| Module-wise count rates for Quadrant A Data is divided into 100 sec bins |
 |
 |
| Module-wise count rates for Quadrant B Data is divided into 100 sec bins |
 |
 |
| Module-wise count rates for Quadrant C Data is divided into 100 sec bins |
 |
 |
| Module-wise count rates for Quadrant D Data is divided into 100 sec bins |
 |
 |
| Parameter | Plot |
|---|---|
| CZT HV Monitor |  |
| D_VDD | 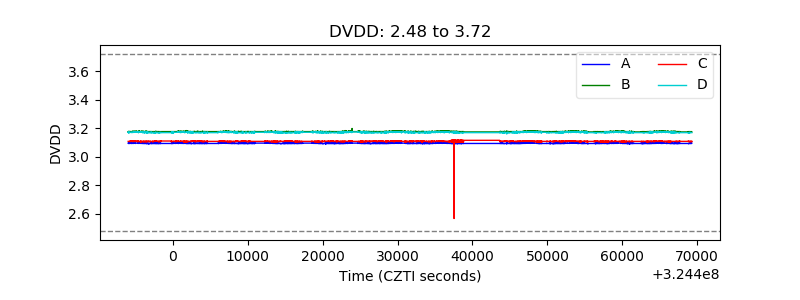 |
| Temperature 1 |  |
| Veto HV Monitor |  |
| Veto LLD |  |
| Alpha Counter |  |
| _CPM_Rate |  |
| CZT Counter |  |
| +2.5 Volts monitor |  |
| +5 Volts monitor |  |
| _ROLL_ROT | 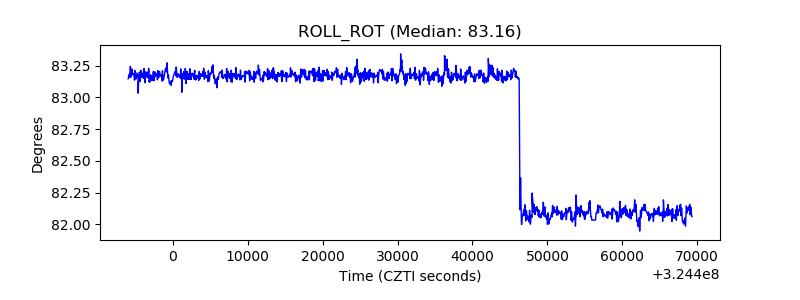 |
| _Roll_DEC |  |
| _Roll_RA |  |
| Veto Counter |  |