| Param | Original file | Final file |
|---|---|---|
| Filename | modeM0/AS1T03_187T01_9000003608_24550cztM0_level2.evt | modeM0/AS1T03_187T01_9000003608_24550cztM0_level2_quad_clean.evt |
| Size (bytes) | 600,906,240 | 114,612,480 |
| Size | 573.1 MB | 109.3 MB |
| Events in quadrant A | 3,245,033 | 805,540 |
| Events in quadrant B | 3,451,589 | 809,483 |
| Events in quadrant C | 3,801,877 | 741,229 |
| Events in quadrant D | 7,277,562 | 678,757 |
| Mode SS | |||
|---|---|---|---|
| Quadrant | BADHDUFLAG | Total packets | Discarded packets |
| A | 0 | 126 | 0 |
| B | 0 | 126 | 0 |
| C | 0 | 126 | 0 |
| D | 0 | 126 | 0 |
| Mode M9 | |||
|---|---|---|---|
| Quadrant | BADHDUFLAG | Total packets | Discarded packets |
| A | 0 | 15 | 0 |
| B | 0 | 16 | 0 |
| C | 0 | 16 | 0 |
| D | 0 | 16 | 0 |
| Mode M0 | |||
|---|---|---|---|
| Quadrant | BADHDUFLAG | Total packets | Discarded packets |
| A | 0 | 13425 | 2 |
| B | 0 | 14022 | 2 |
| C | 0 | 15337 | 3 |
| D | 0 | 26113 | 2 |
| Quadrant | Total seconds | Saturated seconds | Saturation percentage |
|---|---|---|---|
| A | 6249 | 66 | 1.056169% |
| B | 6249 | 117 | 1.872300% |
| C | 6248 | 195 | 3.120999% |
| D | 6248 | 879 | 14.068502% |
Noise dominated data is calculated using 1-second bins in cleaned event files. If a bin has >2000 counts, and if more than 50% of those come from <1% of pixels, then it is considered to be noise-dominated and hence unusable.
| Quadrant | # 1 sec bins | Bins with >0 counts | Bins with >2000 counts | High rate bins dominated by noise | Noise dominated (total time) | Noise dominated (detector-on time) | Marked lightcurve |
|---|---|---|---|---|---|---|---|
| A | 7524 | 6250 | 0 | 0 | 0.00% | 0.00% | 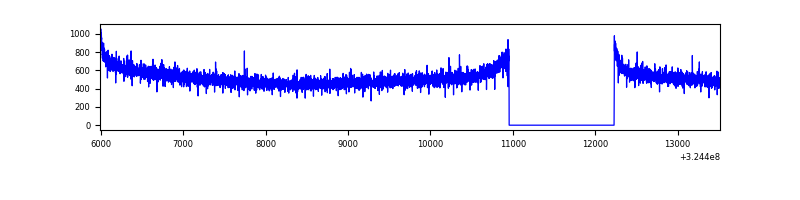 |
| B | 7524 | 6250 | 30 | 30 | 0.40% | 0.48% | 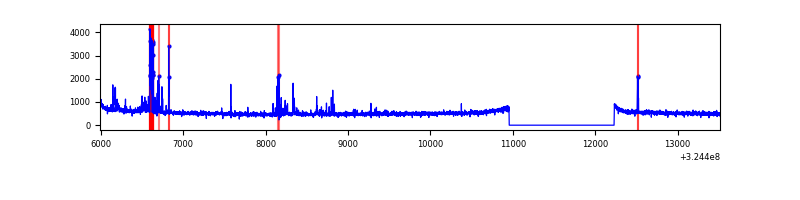 |
| C | 7523 | 6249 | 58 | 58 | 0.77% | 0.93% | 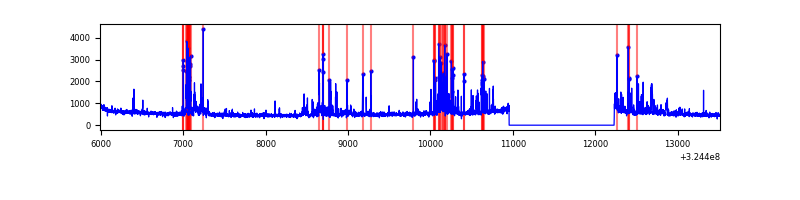 |
| D | 7523 | 6249 | 744 | 744 | 9.89% | 11.91% | 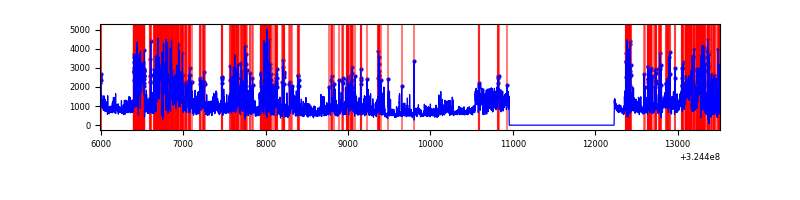 |
Top three noisy pixels from each quadrant. If the there are fewer than three noisy pixels in the level2.evt file, extra rows are filled as -1
| Pixel properties | Quadrant properties | ||||||
|---|---|---|---|---|---|---|---|
| Quadrant | DetID | PixID | Counts | Sigma | Mean | Median | Sigma |
| A | 13 | 254 | 9747 | 54.12 | 841 | 827 | 164.8 |
| A | 0 | 226 | 7406 | 39.91 | 841 | 827 | 164.8 |
| A | 3 | 137 | 6917 | 36.95 | 841 | 827 | 164.8 |
| B | 3 | 64 | 200381 | 1306.89 | 824 | 807 | 152.7 |
| B | 0 | 190 | 22789 | 143.95 | 824 | 807 | 152.7 |
| B | 12 | 111 | 17875 | 111.77 | 824 | 807 | 152.7 |
| C | 2 | 16 | 601818 | 3417.76 | 774 | 779 | 175.9 |
| C | 14 | 238 | 128509 | 726.33 | 774 | 779 | 175.9 |
| C | 5 | 112 | 41021 | 228.83 | 774 | 779 | 175.9 |
| D | 8 | 195 | 2039790 | 11232.61 | 748 | 726 | 181.5 |
| D | 1 | 52 | 1777008 | 9785.02 | 748 | 726 | 181.5 |
| D | 12 | 218 | 475878 | 2617.47 | 748 | 726 | 181.5 |
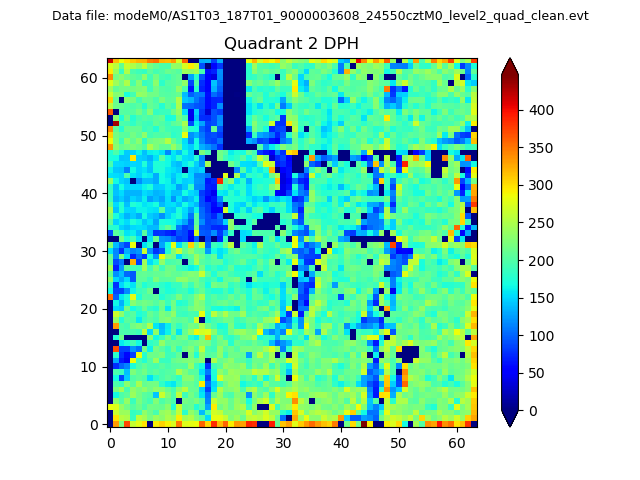
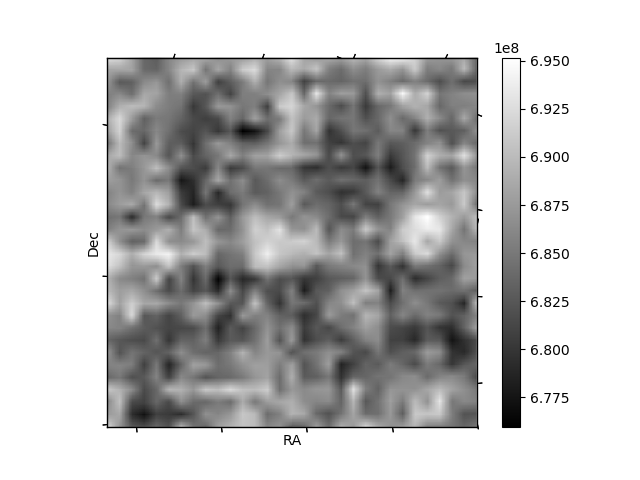
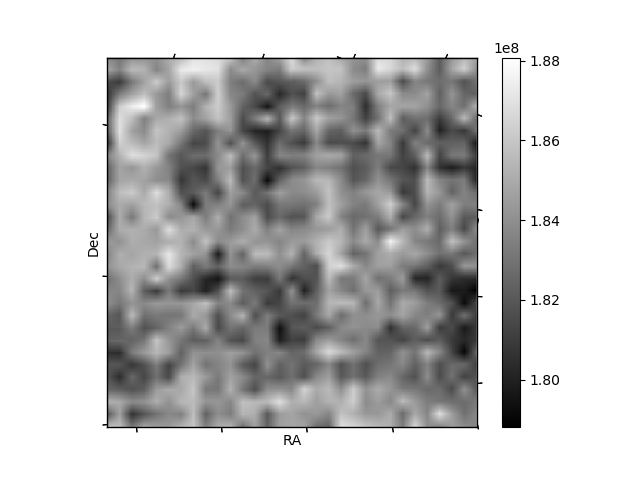
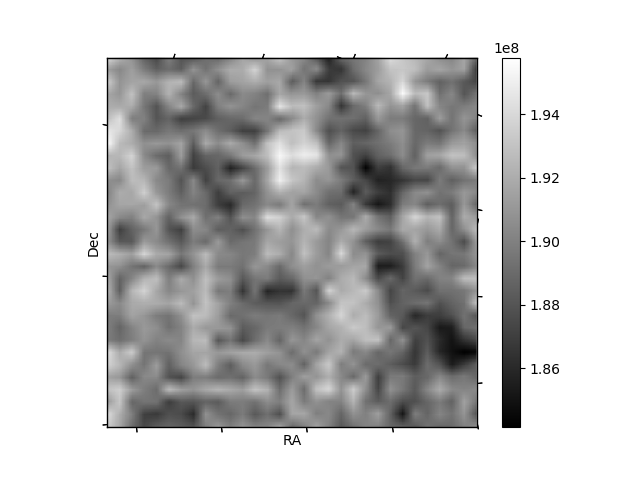
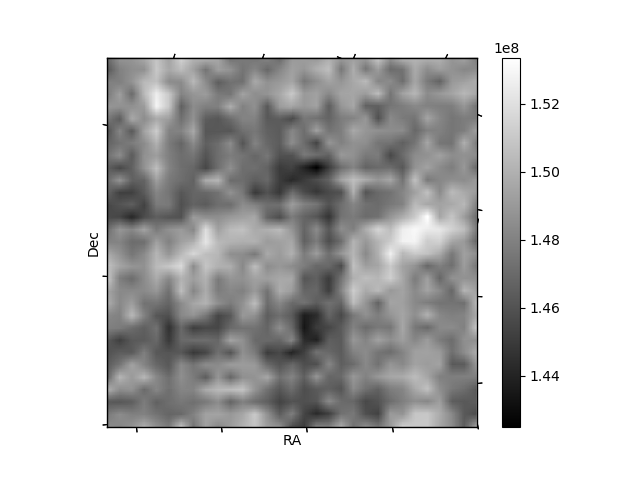
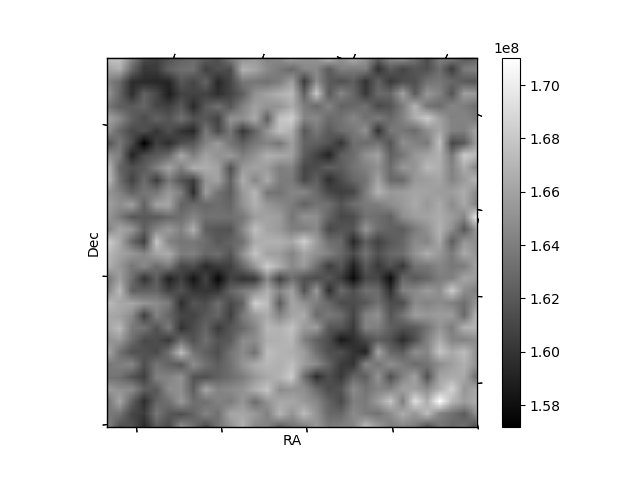
Histogram calculated using DETX and DETY for each event in the final _common_clean file
| Quadrant A | 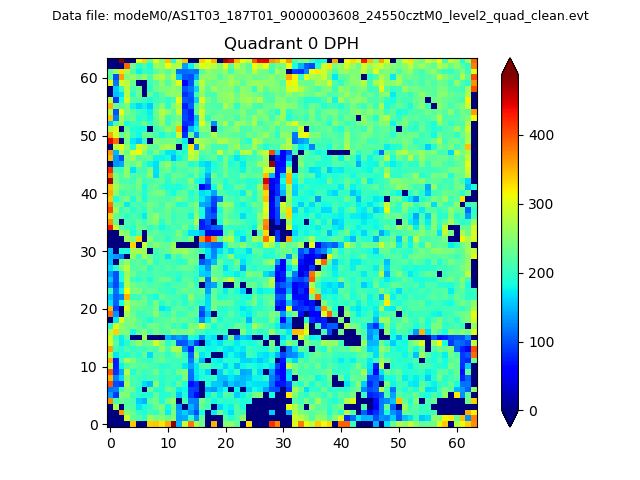 |
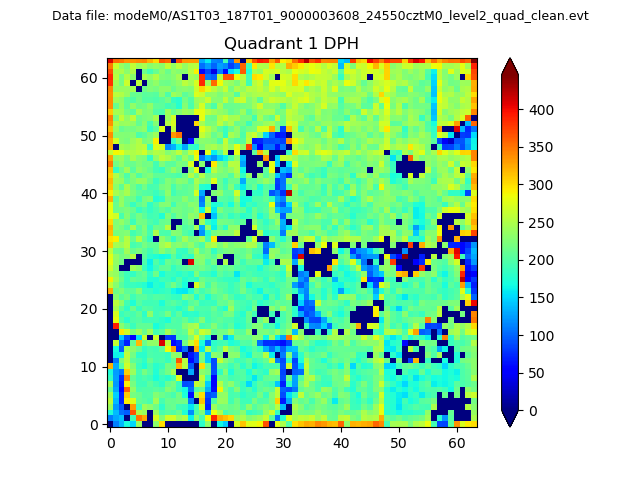 |
Quadrant B |
|---|---|---|---|
| Quadrant D | 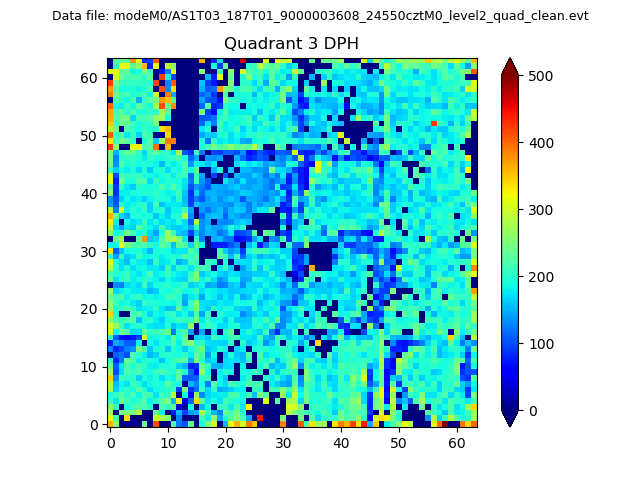 |
 |
Quadrant C |
| Plot type | Count rate plots | Images |
|---|---|---|
| Comparison with Poisson distribution Blue bars denote a histogram of data divided into 1 sec bins. Red curve is a Poisson curve with rate = median count rate of data. |
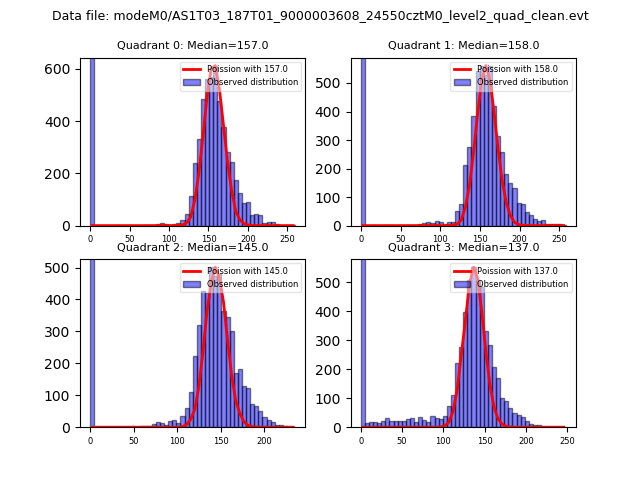 |
 |
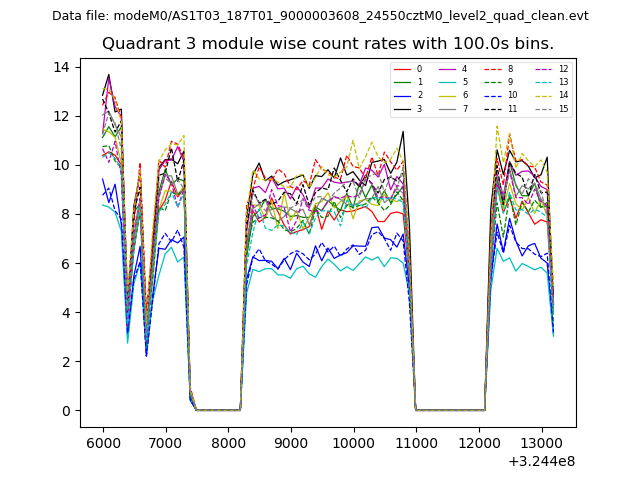
| Quadrant-wise count rates Data is divided into 100 sec bins |
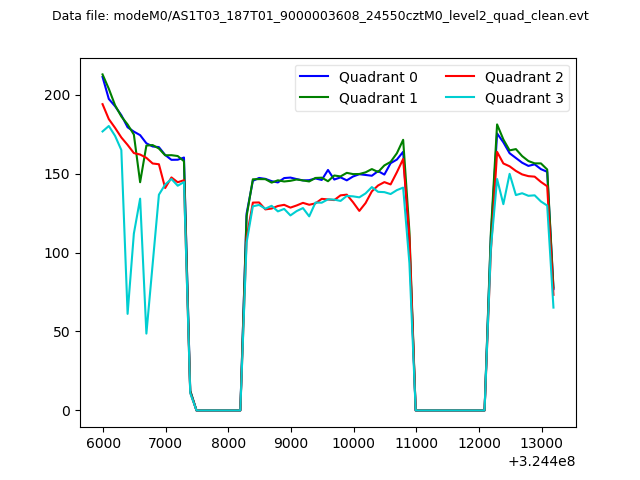 |
|
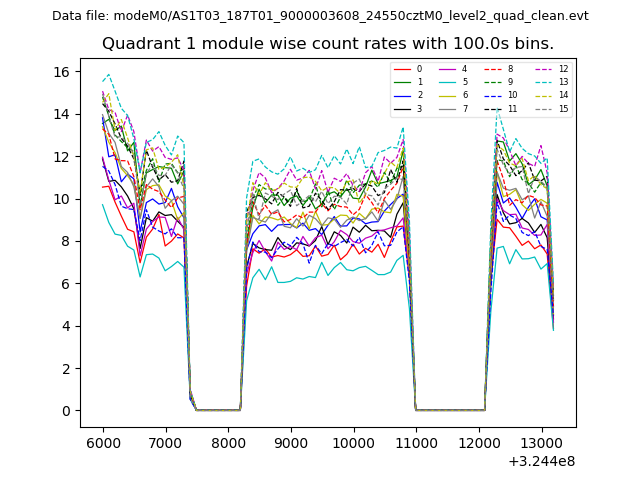
| Module-wise count rates for Quadrant A Data is divided into 100 sec bins |
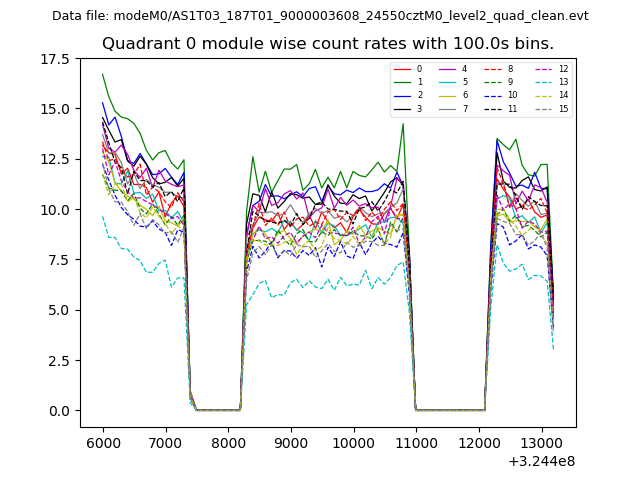 |
 |
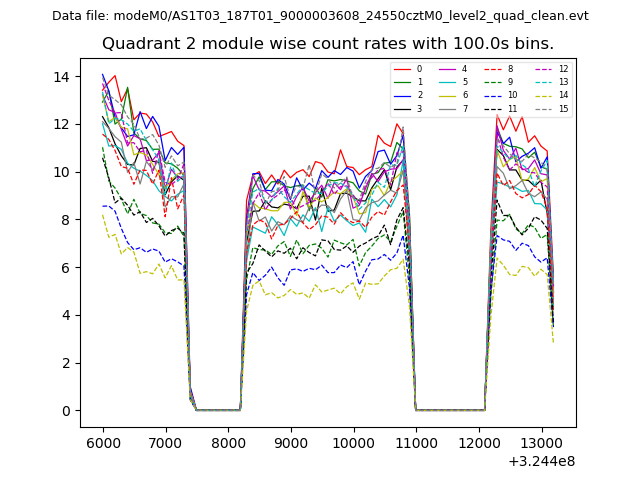
| Module-wise count rates for Quadrant B Data is divided into 100 sec bins |
 |
 |
| Module-wise count rates for Quadrant C Data is divided into 100 sec bins |
 |
 |
| Module-wise count rates for Quadrant D Data is divided into 100 sec bins |
 |
 |
| Parameter | Plot |
|---|---|
| CZT HV Monitor |  |
| D_VDD | 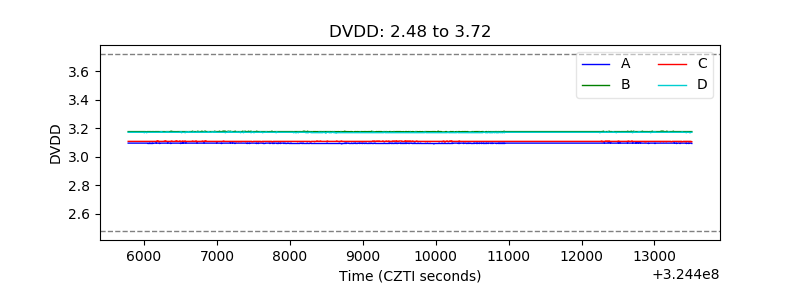 |
| Temperature 1 | 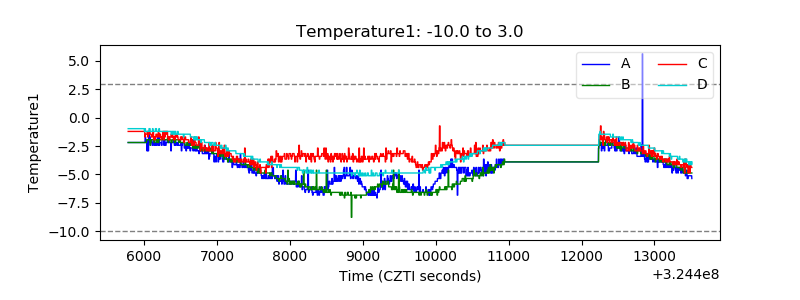 |
| Veto HV Monitor | 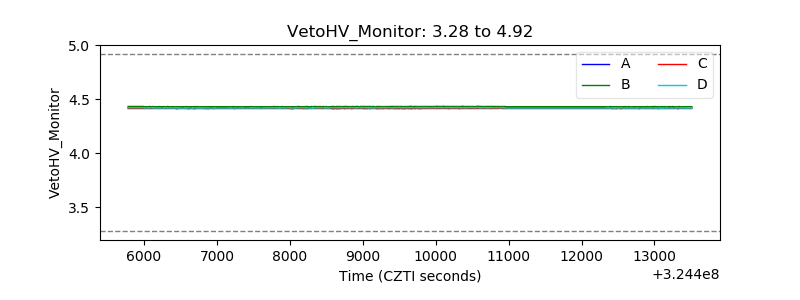 |
| Veto LLD | 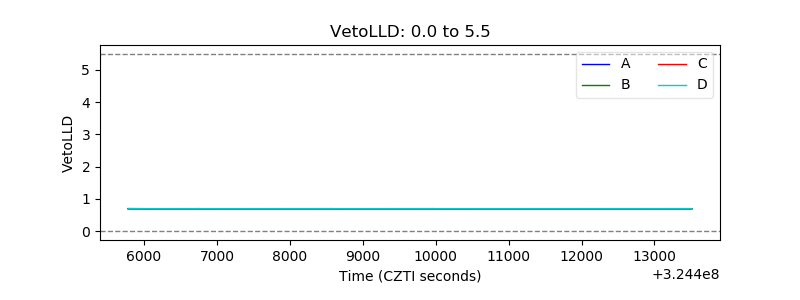 |
| Alpha Counter | 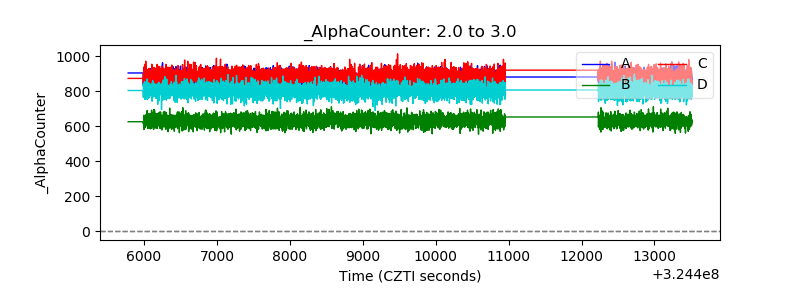 |
| _CPM_Rate | 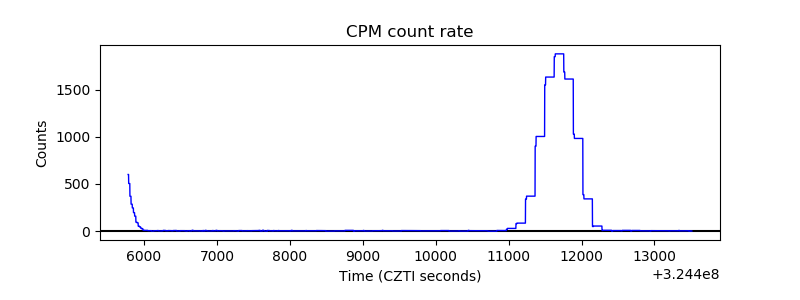 |
| CZT Counter | 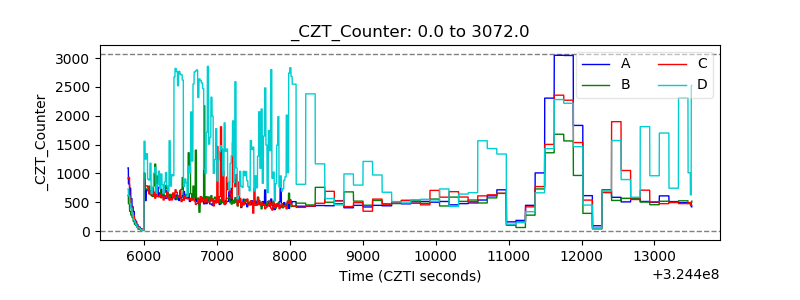 |
| +2.5 Volts monitor | 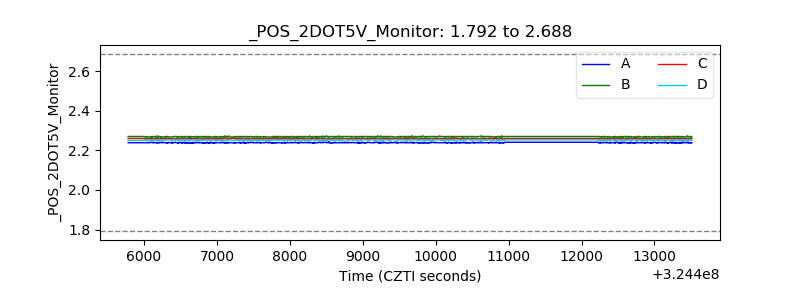 |
| +5 Volts monitor |  |
| _ROLL_ROT | 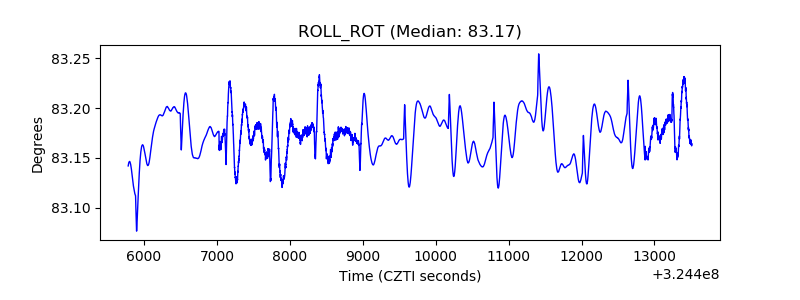 |
| _Roll_DEC | 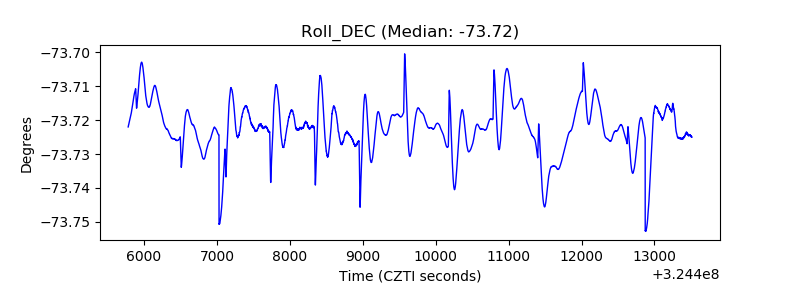 |
| _Roll_RA | 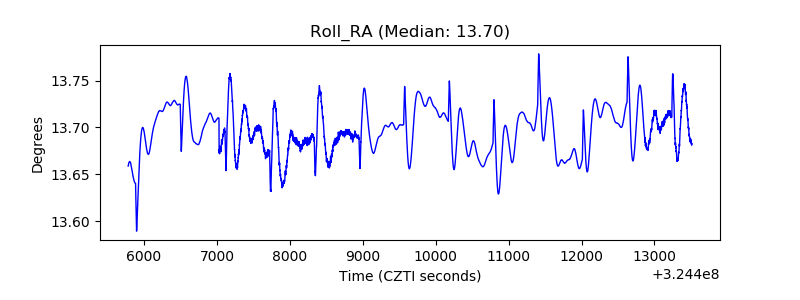 |
| Veto Counter | 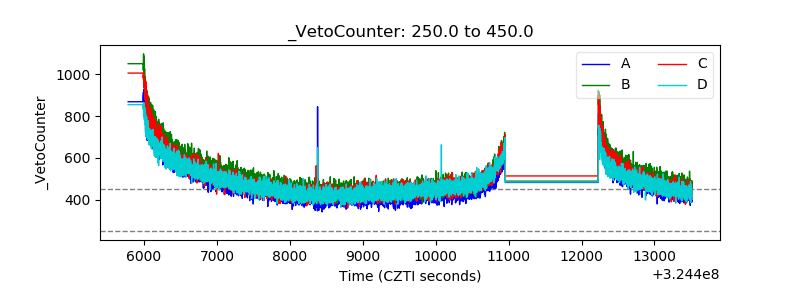 |