| Param | Original file | Final file |
|---|---|---|
| Filename | modeM0/AS1T03_187T01_9000003608_24552cztM0_level2.evt | modeM0/AS1T03_187T01_9000003608_24552cztM0_level2_quad_clean.evt |
| Size (bytes) | 531,653,760 | 103,786,560 |
| Size | 507.0 MB | 99.0 MB |
| Events in quadrant A | 3,247,241 | 691,161 |
| Events in quadrant B | 3,298,652 | 698,616 |
| Events in quadrant C | 3,326,967 | 653,061 |
| Events in quadrant D | 5,761,126 | 620,579 |
| Mode SS | |||
|---|---|---|---|
| Quadrant | BADHDUFLAG | Total packets | Discarded packets |
| A | 0 | 142 | 0 |
| B | 0 | 142 | 0 |
| C | 0 | 142 | 0 |
| D | 0 | 142 | 0 |
| Mode M9 | |||
|---|---|---|---|
| Quadrant | BADHDUFLAG | Total packets | Discarded packets |
| A | 0 | 10 | 0 |
| B | 0 | 11 | 0 |
| C | 0 | 11 | 0 |
| D | 0 | 11 | 0 |
| Mode M0 | |||
|---|---|---|---|
| Quadrant | BADHDUFLAG | Total packets | Discarded packets |
| A | 0 | 14067 | 2 |
| B | 0 | 14189 | 2 |
| C | 0 | 14302 | 2 |
| D | 0 | 21757 | 2 |
| Quadrant | Total seconds | Saturated seconds | Saturation percentage |
|---|---|---|---|
| A | 6878 | 32 | 0.465252% |
| B | 6878 | 47 | 0.683338% |
| C | 6878 | 78 | 1.134051% |
| D | 6878 | 574 | 8.345449% |
Noise dominated data is calculated using 1-second bins in cleaned event files. If a bin has >2000 counts, and if more than 50% of those come from <1% of pixels, then it is considered to be noise-dominated and hence unusable.
| Quadrant | # 1 sec bins | Bins with >0 counts | Bins with >2000 counts | High rate bins dominated by noise | Noise dominated (total time) | Noise dominated (detector-on time) | Marked lightcurve |
|---|---|---|---|---|---|---|---|
| A | 7608 | 6879 | 0 | 0 | 0.00% | 0.00% | 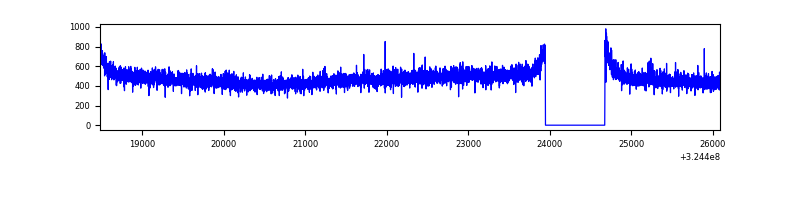 |
| B | 7608 | 6879 | 1 | 1 | 0.01% | 0.01% | 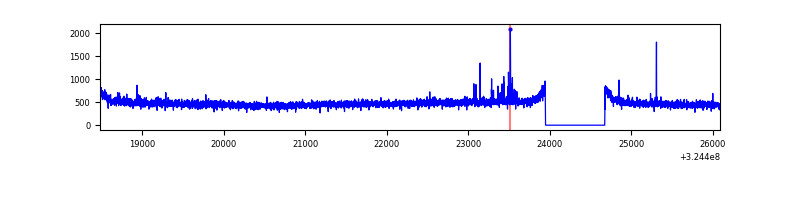 |
| C | 7608 | 6879 | 8 | 8 | 0.11% | 0.12% | 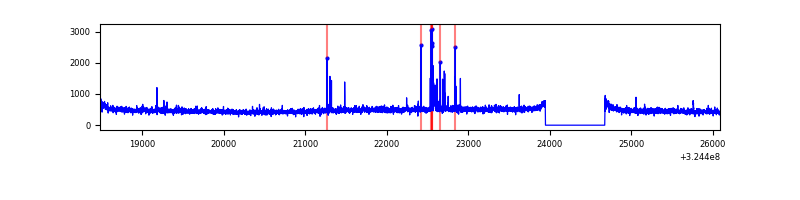 |
| D | 7608 | 6879 | 404 | 404 | 5.31% | 5.87% | 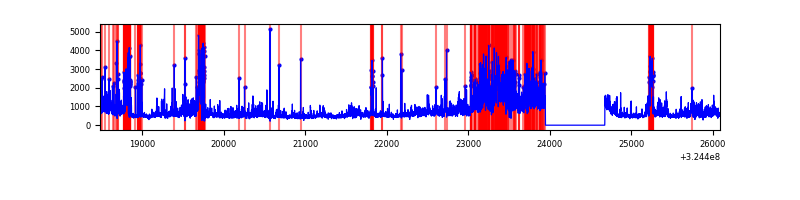 |
Top three noisy pixels from each quadrant. If the there are fewer than three noisy pixels in the level2.evt file, extra rows are filled as -1
| Pixel properties | Quadrant properties | ||||||
|---|---|---|---|---|---|---|---|
| Quadrant | DetID | PixID | Counts | Sigma | Mean | Median | Sigma |
| A | 13 | 254 | 10545 | 58.48 | 840 | 824 | 166.2 |
| A | 3 | 137 | 7678 | 41.23 | 840 | 824 | 166.2 |
| A | 0 | 226 | 7190 | 38.3 | 840 | 824 | 166.2 |
| B | 0 | 190 | 23439 | 144.2 | 832 | 813 | 156.9 |
| B | 12 | 111 | 18930 | 115.46 | 832 | 813 | 156.9 |
| B | 11 | 111 | 16927 | 102.7 | 832 | 813 | 156.9 |
| C | 14 | 238 | 128716 | 697.35 | 791 | 794 | 183.4 |
| C | 2 | 16 | 78556 | 423.91 | 791 | 794 | 183.4 |
| C | 10 | 9 | 16457 | 85.38 | 791 | 794 | 183.4 |
| D | 8 | 195 | 1248908 | 6556.17 | 780 | 756 | 190.4 |
| D | 1 | 52 | 787570 | 4132.9 | 780 | 756 | 190.4 |
| D | 9 | 1 | 313184 | 1641.09 | 780 | 756 | 190.4 |
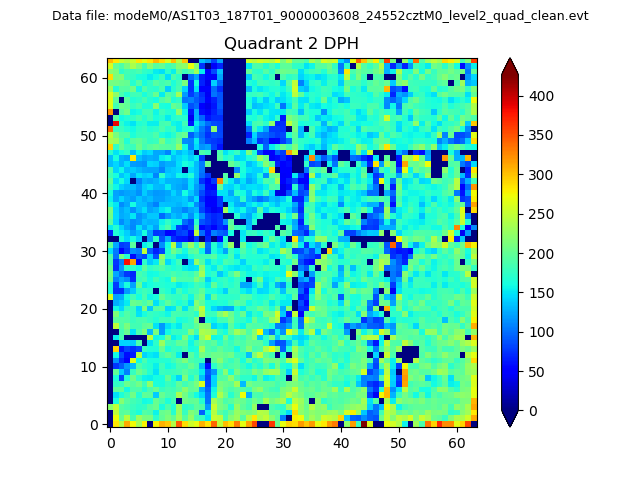
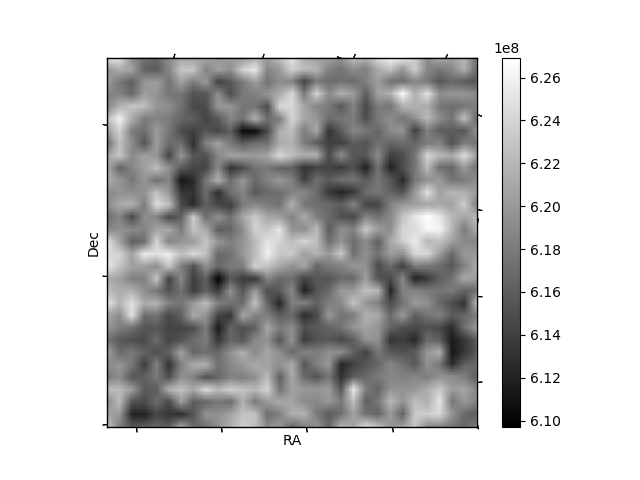
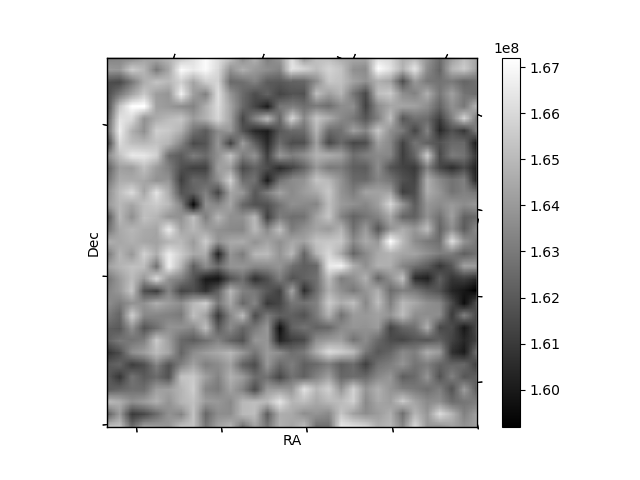
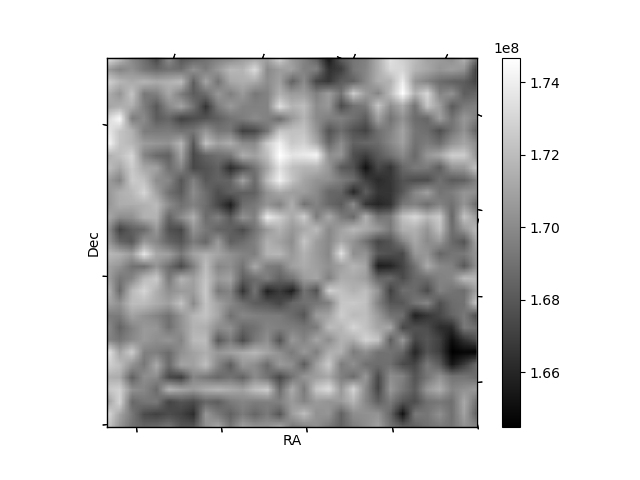
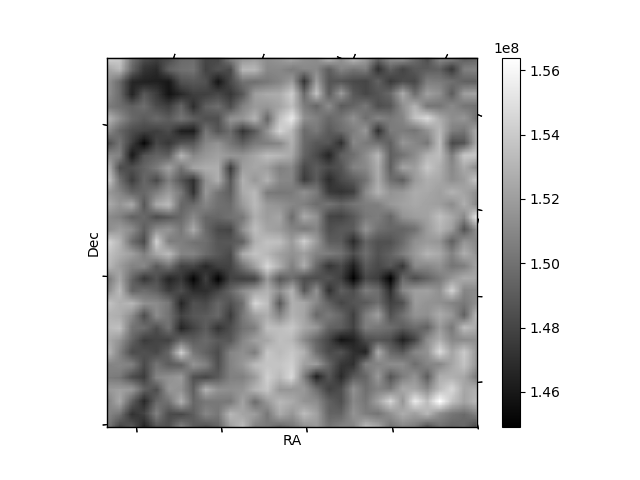
Histogram calculated using DETX and DETY for each event in the final _common_clean file
| Quadrant A | 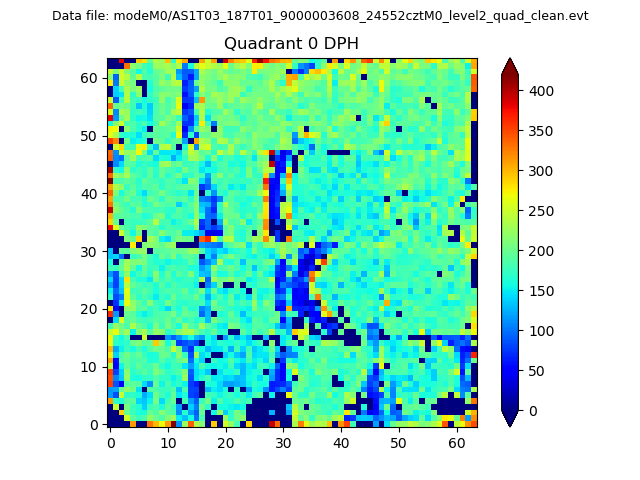 |
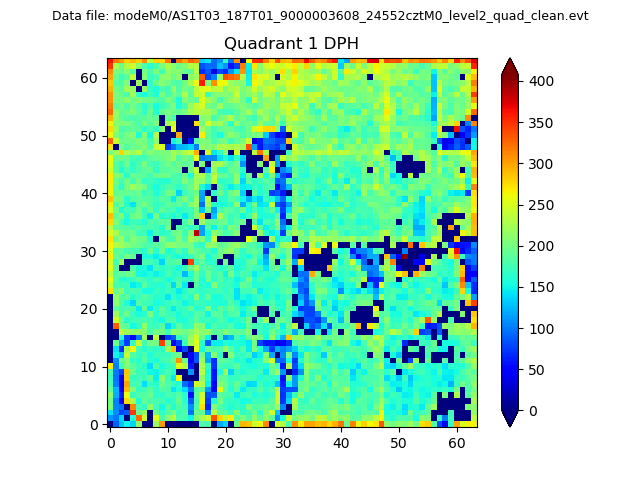 |
Quadrant B |
|---|---|---|---|
| Quadrant D | 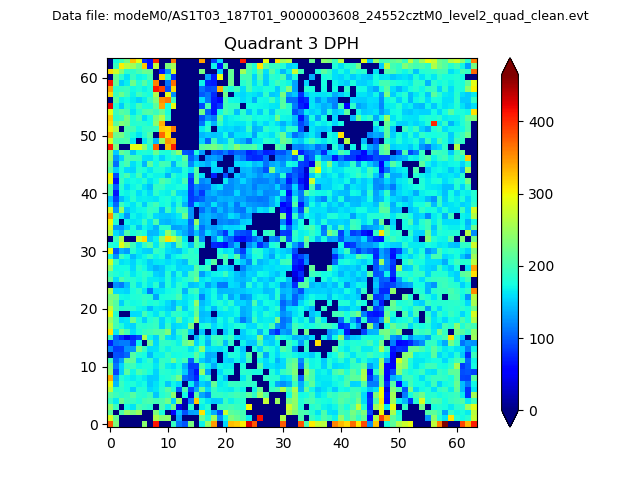 |
 |
Quadrant C |
| Plot type | Count rate plots | Images |
|---|---|---|
| Comparison with Poisson distribution Blue bars denote a histogram of data divided into 1 sec bins. Red curve is a Poisson curve with rate = median count rate of data. |
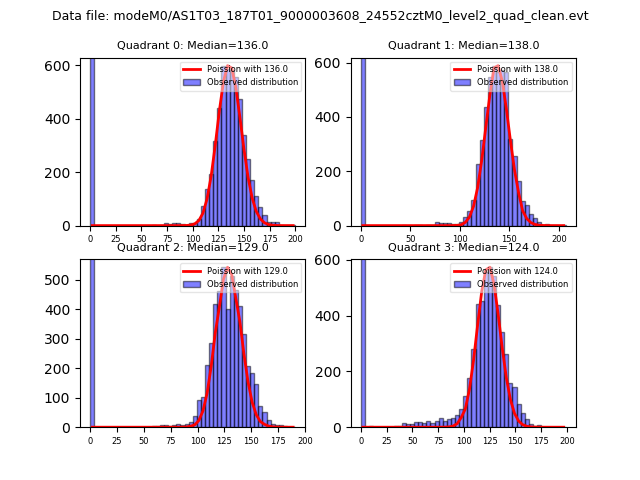 |
 |
| Quadrant-wise count rates Data is divided into 100 sec bins |
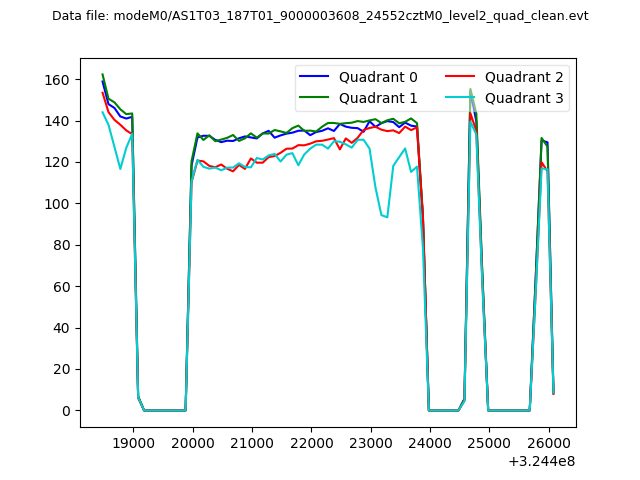 |
|
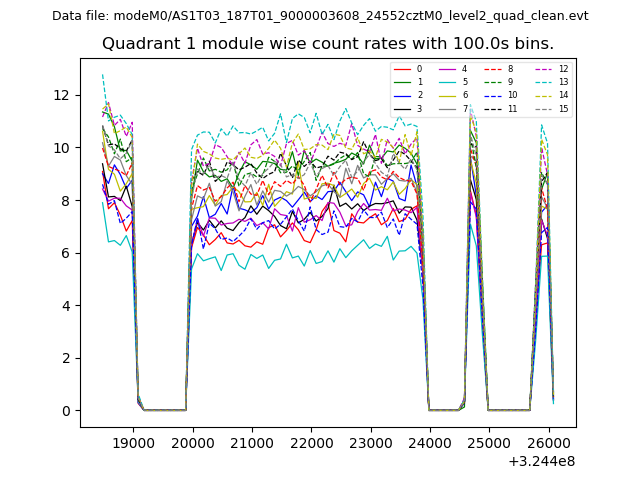
| Module-wise count rates for Quadrant A Data is divided into 100 sec bins |
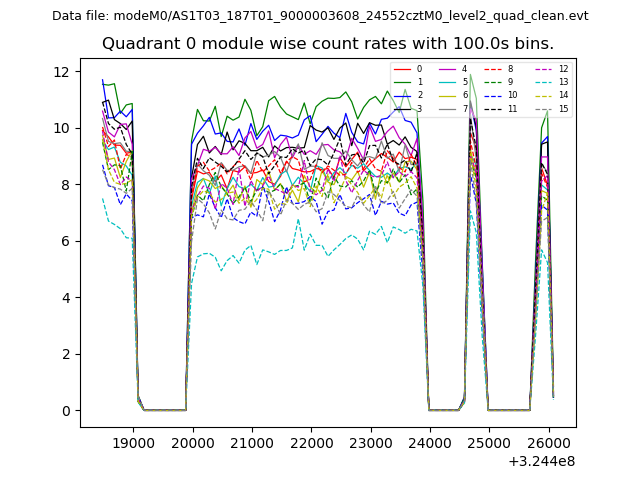 |
 |
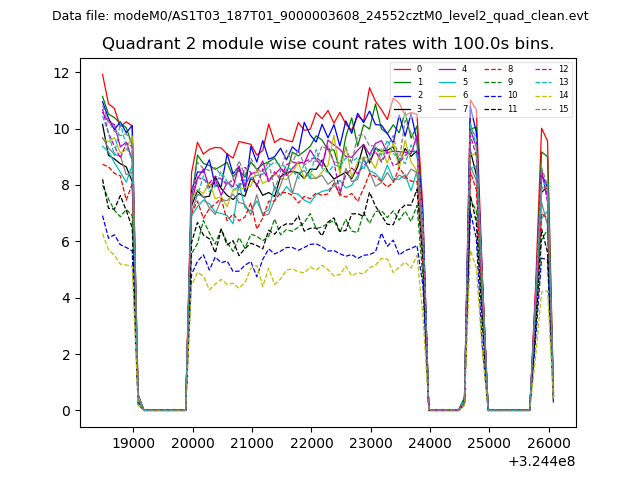
| Module-wise count rates for Quadrant B Data is divided into 100 sec bins |
 |
 |
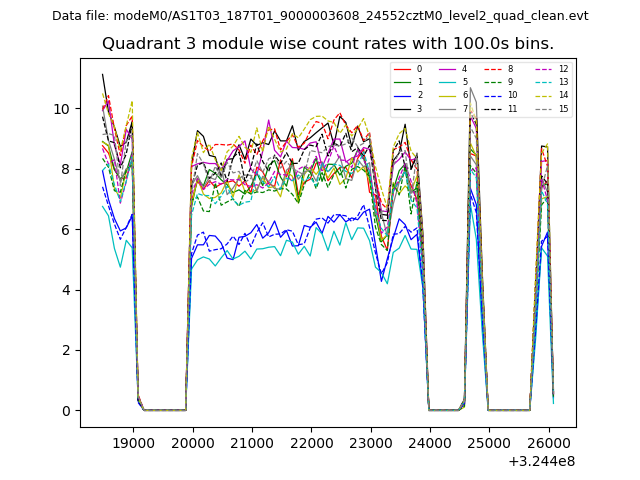
| Module-wise count rates for Quadrant C Data is divided into 100 sec bins |
 |
 |
| Module-wise count rates for Quadrant D Data is divided into 100 sec bins |
 |
 |
| Parameter | Plot |
|---|---|
| CZT HV Monitor | 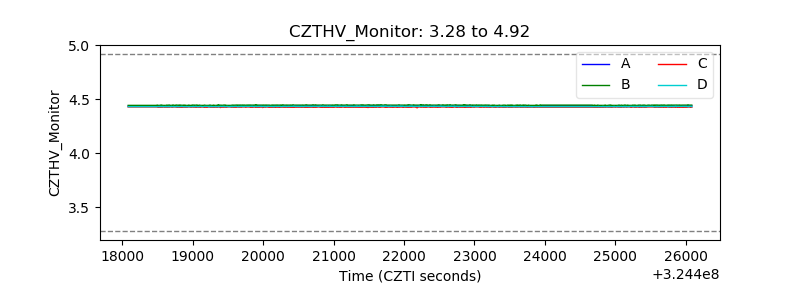 |
| D_VDD | 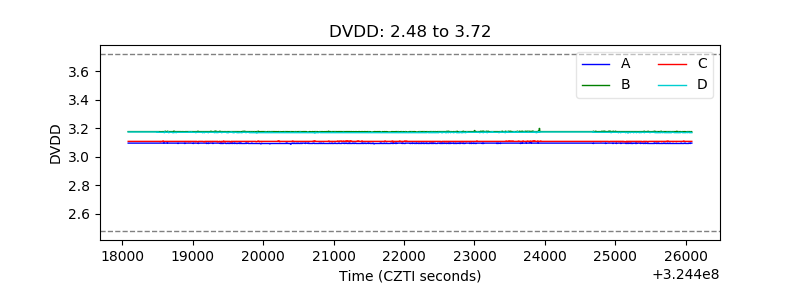 |
| Temperature 1 | 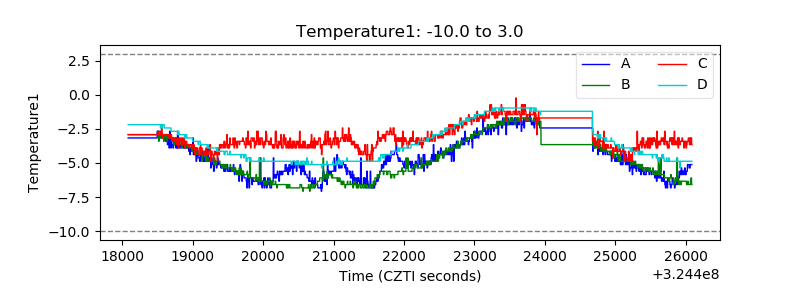 |
| Veto HV Monitor | 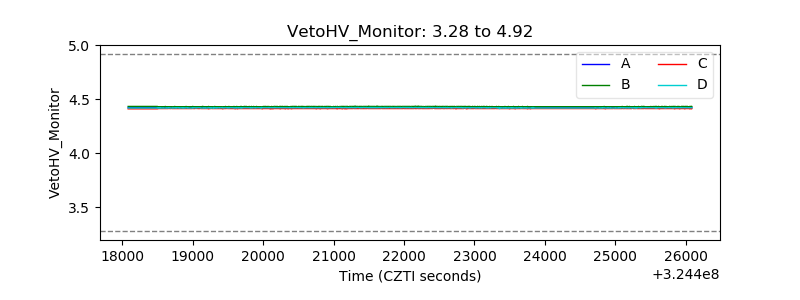 |
| Veto LLD | 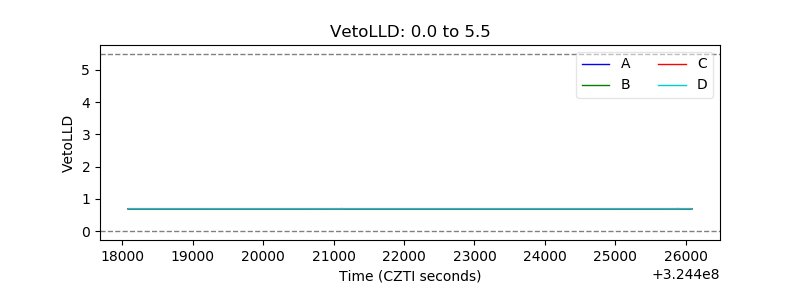 |
| Alpha Counter | 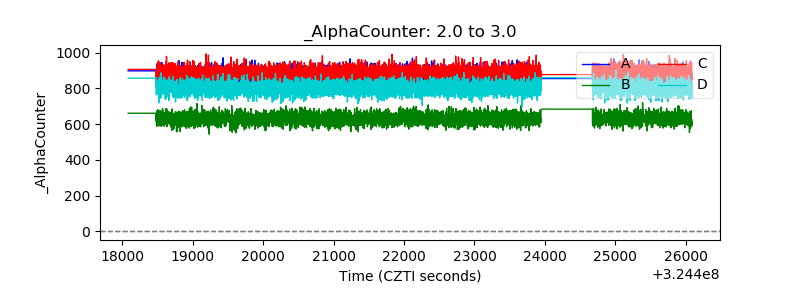 |
| _CPM_Rate | 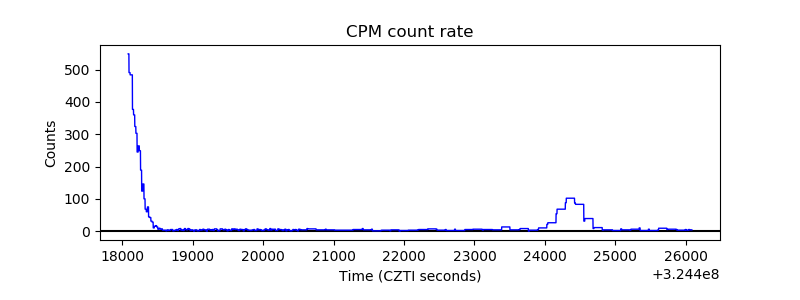 |
| CZT Counter | 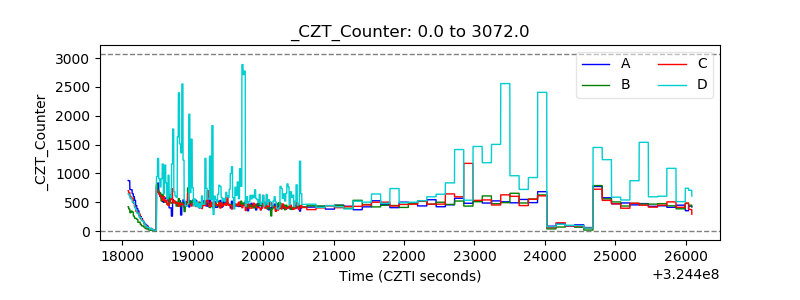 |
| +2.5 Volts monitor |  |
| +5 Volts monitor |  |
| _ROLL_ROT | 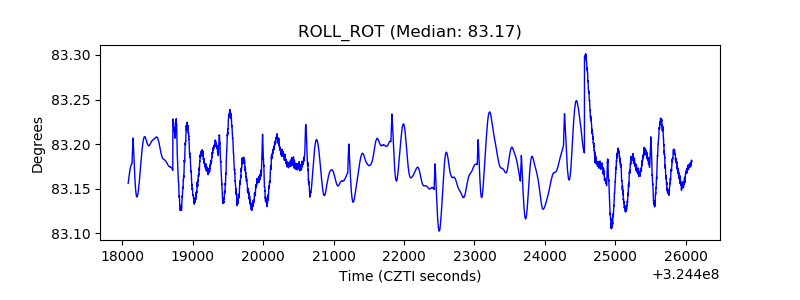 |
| _Roll_DEC | 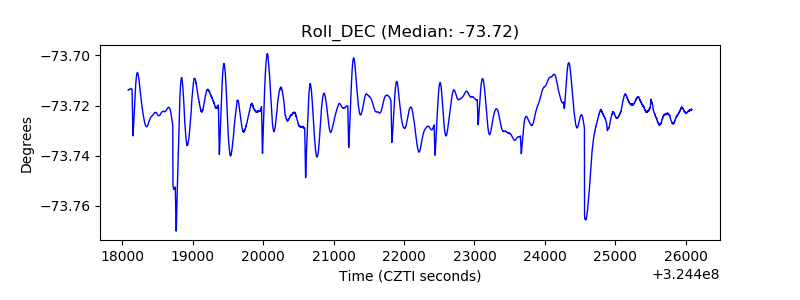 |
| _Roll_RA | 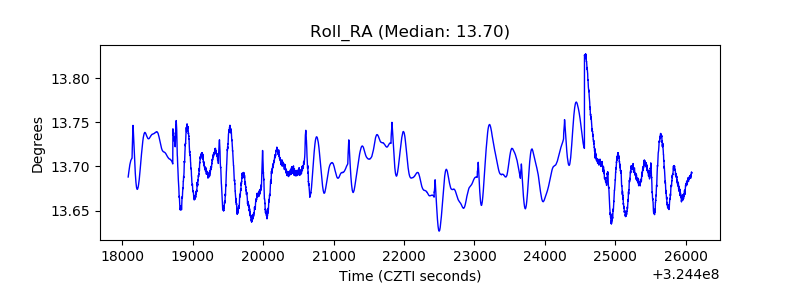 |
| Veto Counter | 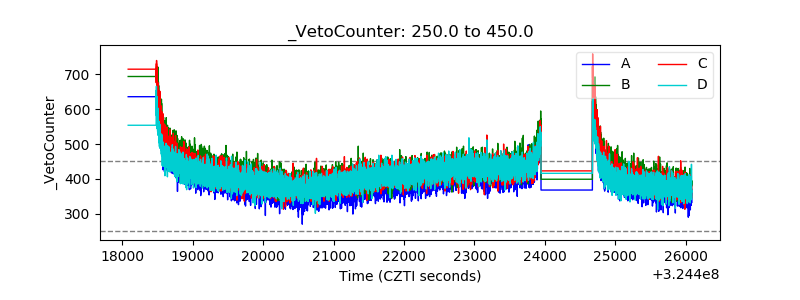 |