| Param | Original file | Final file |
|---|---|---|
| Filename | modeM0/AS1T03_187T01_9000003608_24553cztM0_level2.evt | modeM0/AS1T03_187T01_9000003608_24553cztM0_level2_quad_clean.evt |
| Size (bytes) | 609,788,160 | 116,755,200 |
| Size | 581.5 MB | 111.3 MB |
| Events in quadrant A | 3,602,008 | 779,441 |
| Events in quadrant B | 3,652,680 | 784,043 |
| Events in quadrant C | 3,602,030 | 739,507 |
| Events in quadrant D | 7,094,121 | 702,641 |
| Mode SS | |||
|---|---|---|---|
| Quadrant | BADHDUFLAG | Total packets | Discarded packets |
| A | 0 | 158 | 0 |
| B | 0 | 158 | 0 |
| C | 0 | 158 | 0 |
| D | 0 | 158 | 0 |
| Mode M9 | |||
|---|---|---|---|
| Quadrant | BADHDUFLAG | Total packets | Discarded packets |
| A | 0 | 10 | 0 |
| B | 0 | 10 | 0 |
| C | 0 | 10 | 0 |
| D | 0 | 10 | 0 |
| Mode M0 | |||
|---|---|---|---|
| Quadrant | BADHDUFLAG | Total packets | Discarded packets |
| A | 0 | 15725 | 2 |
| B | 0 | 15808 | 2 |
| C | 0 | 15686 | 2 |
| D | 0 | 26386 | 2 |
| Quadrant | Total seconds | Saturated seconds | Saturation percentage |
|---|---|---|---|
| A | 7618 | 74 | 0.971384% |
| B | 7619 | 109 | 1.430634% |
| C | 7619 | 121 | 1.588135% |
| D | 7619 | 621 | 8.150676% |
Noise dominated data is calculated using 1-second bins in cleaned event files. If a bin has >2000 counts, and if more than 50% of those come from <1% of pixels, then it is considered to be noise-dominated and hence unusable.
| Quadrant | # 1 sec bins | Bins with >0 counts | Bins with >2000 counts | High rate bins dominated by noise | Noise dominated (total time) | Noise dominated (detector-on time) | Marked lightcurve |
|---|---|---|---|---|---|---|---|
| A | 8638 | 7620 | 0 | 0 | 0.00% | 0.00% | 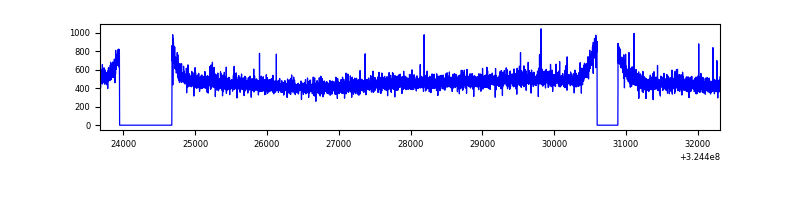 |
| B | 8639 | 7621 | 4 | 4 | 0.05% | 0.05% | 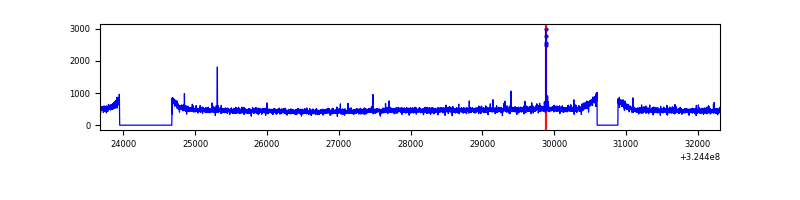 |
| C | 8639 | 7621 | 0 | 0 | 0.00% | 0.00% | 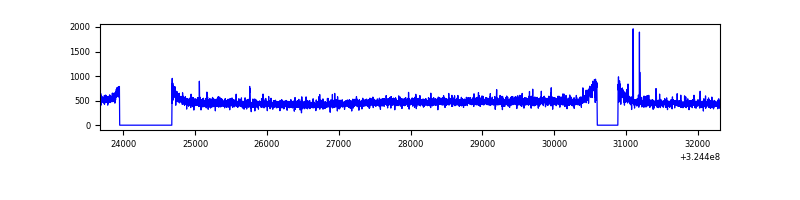 |
| D | 8639 | 7621 | 385 | 385 | 4.46% | 5.05% | 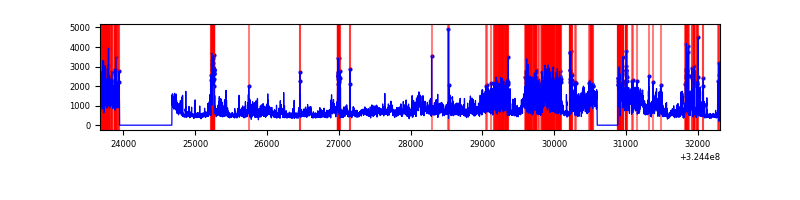 |
Top three noisy pixels from each quadrant. If the there are fewer than three noisy pixels in the level2.evt file, extra rows are filled as -1
| Pixel properties | Quadrant properties | ||||||
|---|---|---|---|---|---|---|---|
| Quadrant | DetID | PixID | Counts | Sigma | Mean | Median | Sigma |
| A | 13 | 254 | 11943 | 59.11 | 930 | 908 | 186.7 |
| A | 10 | 255 | 10753 | 52.73 | 930 | 908 | 186.7 |
| A | 3 | 137 | 8517 | 40.76 | 930 | 908 | 186.7 |
| B | 12 | 111 | 21675 | 118.59 | 922 | 901 | 175.2 |
| B | 11 | 111 | 19206 | 104.49 | 922 | 901 | 175.2 |
| B | 14 | 111 | 17213 | 93.11 | 922 | 901 | 175.2 |
| C | 14 | 238 | 141270 | 689.28 | 878 | 880 | 203.7 |
| C | 2 | 16 | 18014 | 84.12 | 878 | 880 | 203.7 |
| C | 3 | 233 | 13482 | 61.87 | 878 | 880 | 203.7 |
| D | 8 | 195 | 2745409 | 12794.81 | 874 | 843 | 214.5 |
| D | 1 | 52 | 542840 | 2526.72 | 874 | 843 | 214.5 |
| D | 1 | 255 | 221717 | 1029.69 | 874 | 843 | 214.5 |
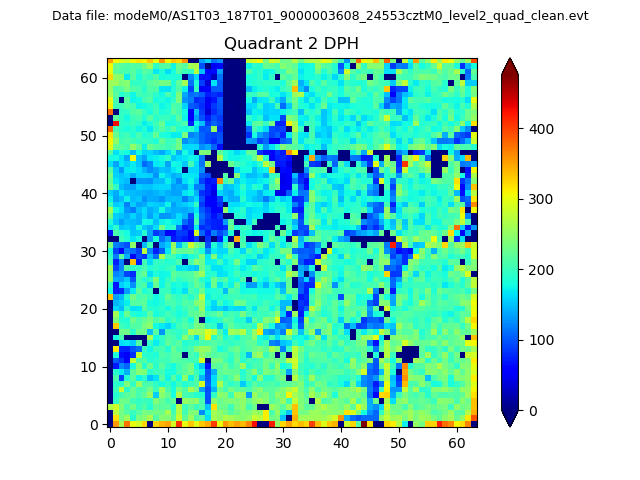
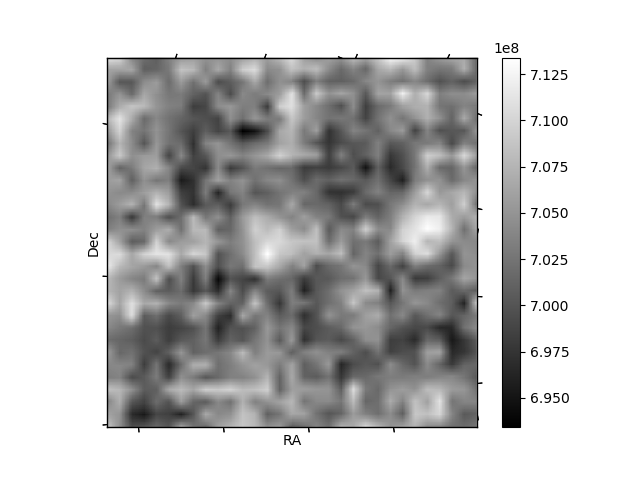
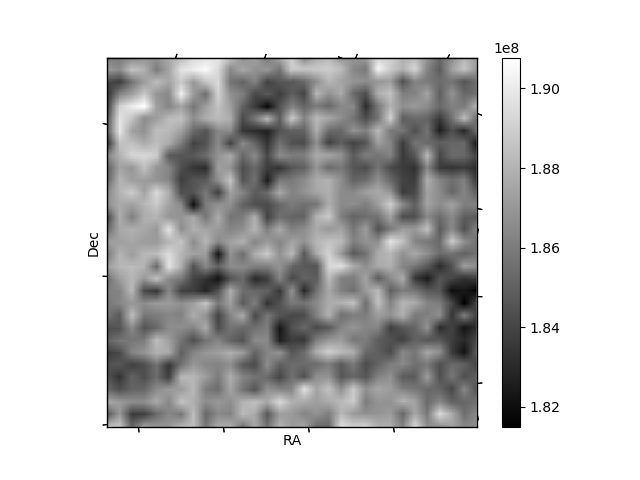
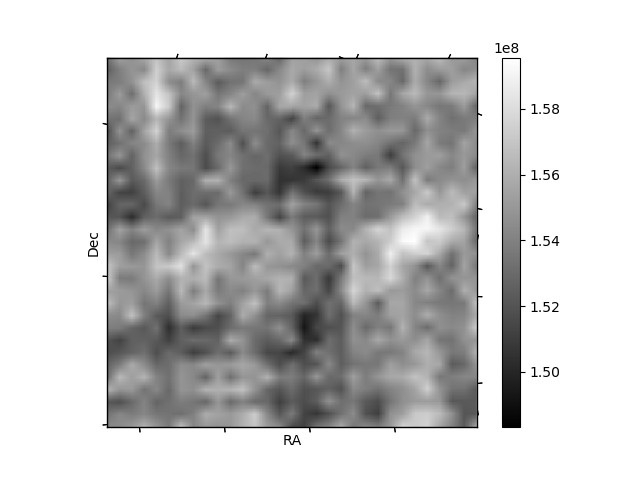
Histogram calculated using DETX and DETY for each event in the final _common_clean file
| Quadrant A | 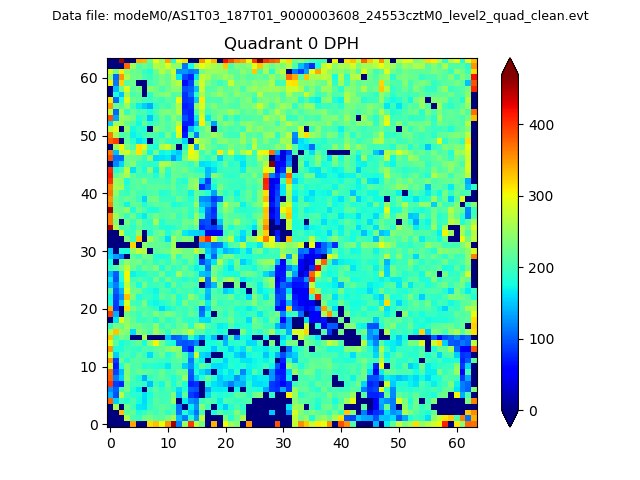 |
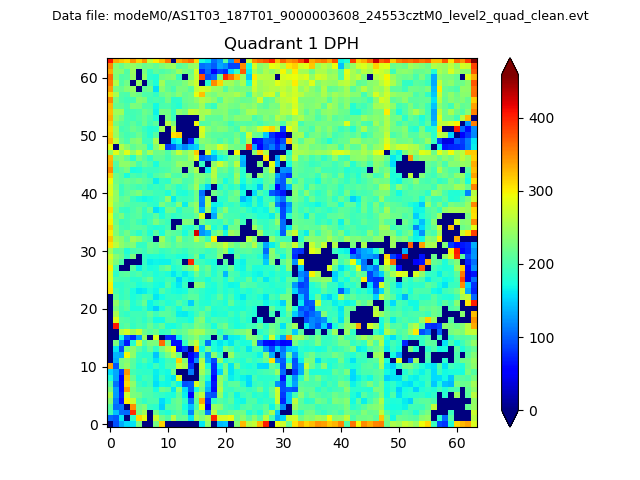 |
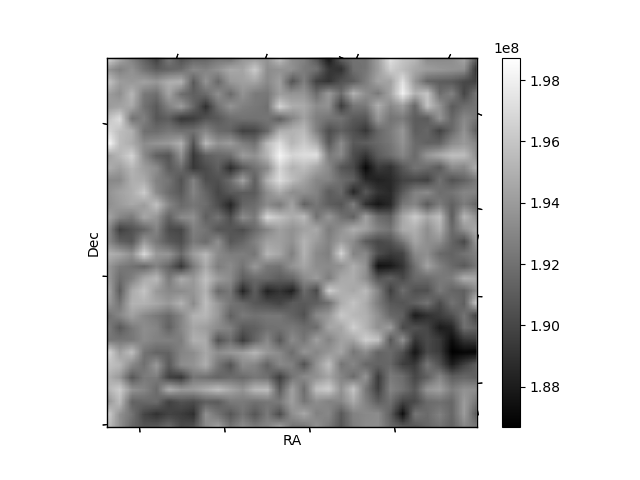
Quadrant B |
|---|---|---|---|
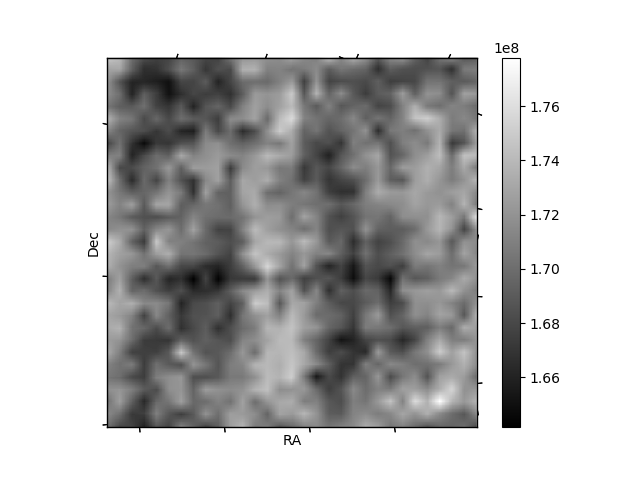
| Quadrant D | 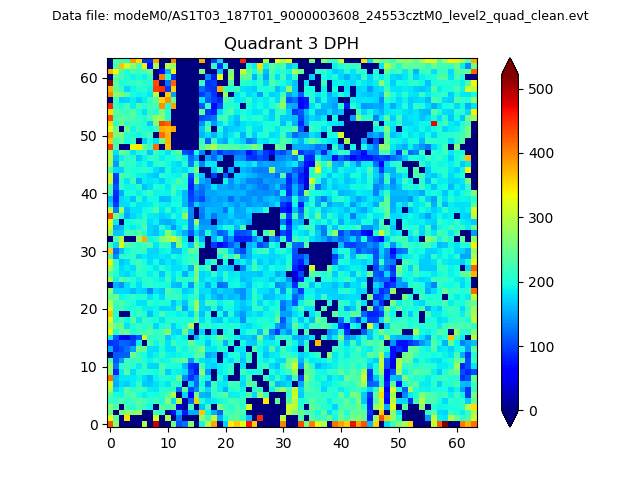 |
 |
Quadrant C |
| Plot type | Count rate plots | Images |
|---|---|---|
| Comparison with Poisson distribution Blue bars denote a histogram of data divided into 1 sec bins. Red curve is a Poisson curve with rate = median count rate of data. |
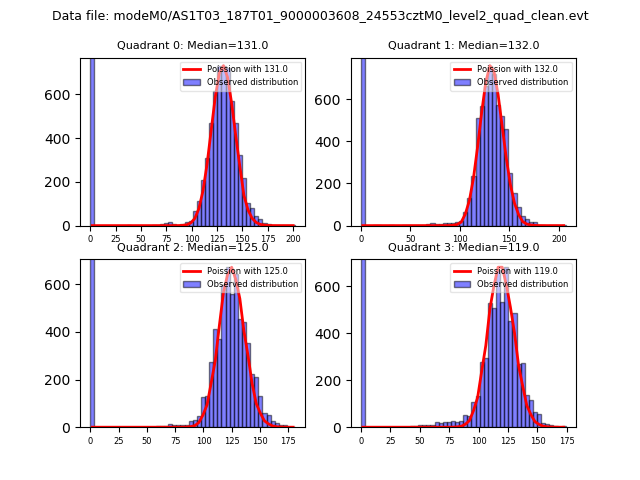 |
 |
| Quadrant-wise count rates Data is divided into 100 sec bins |
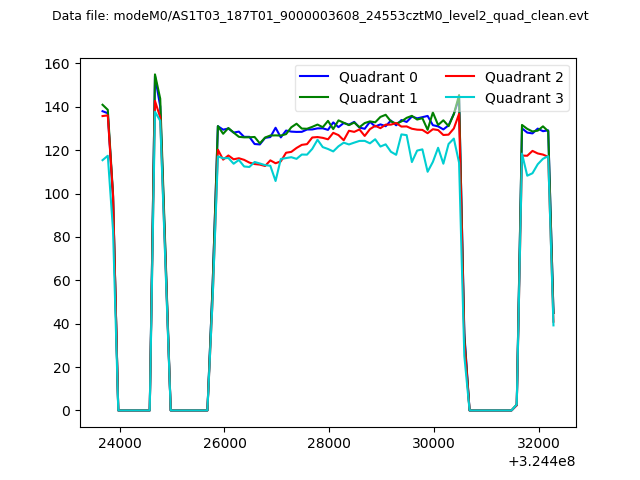 |
|
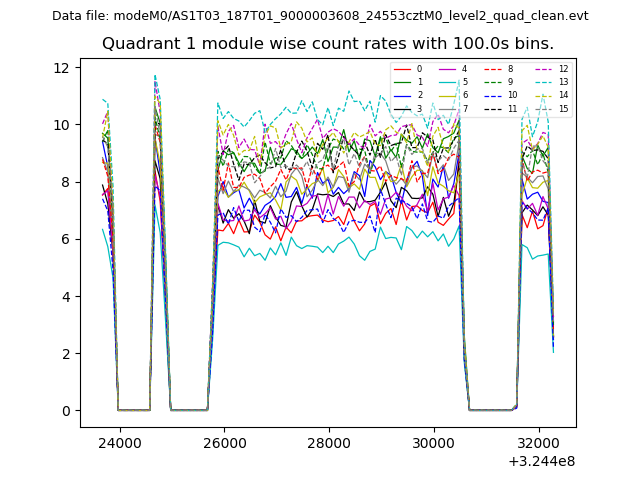
| Module-wise count rates for Quadrant A Data is divided into 100 sec bins |
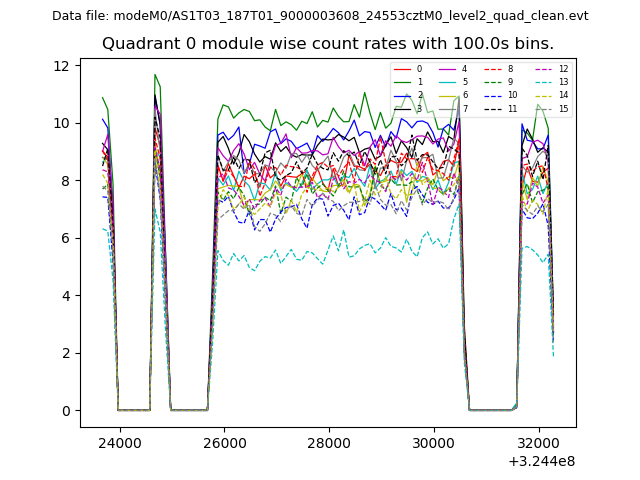 |
 |
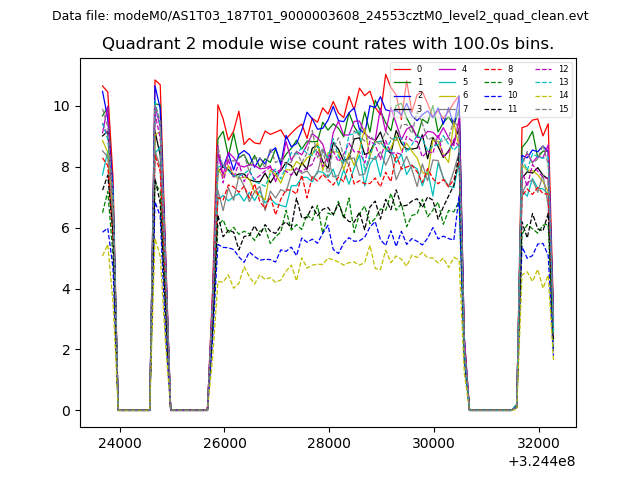
| Module-wise count rates for Quadrant B Data is divided into 100 sec bins |
 |
 |
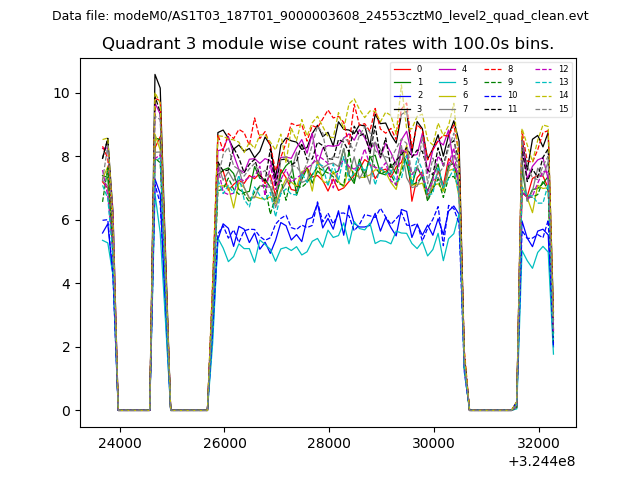
| Module-wise count rates for Quadrant C Data is divided into 100 sec bins |
 |
 |
| Module-wise count rates for Quadrant D Data is divided into 100 sec bins |
 |
 |
| Parameter | Plot |
|---|---|
| CZT HV Monitor | 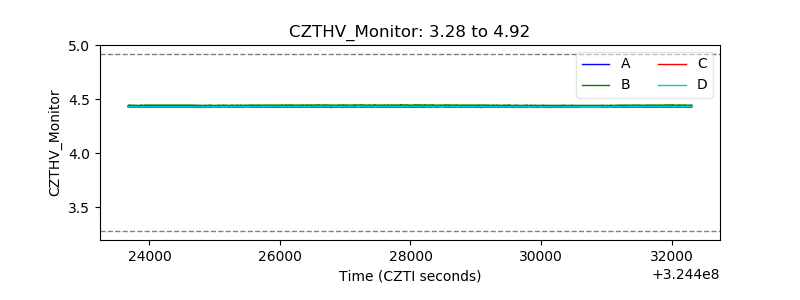 |
| D_VDD | 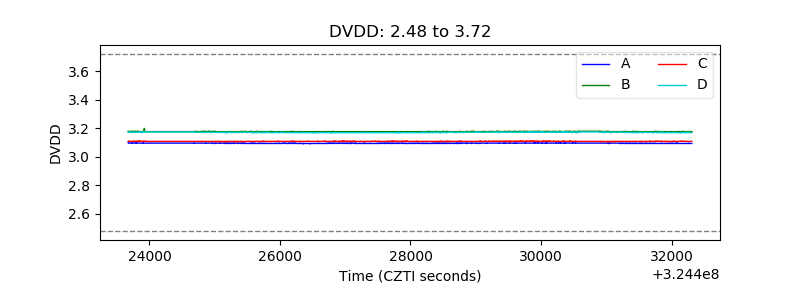 |
| Temperature 1 | 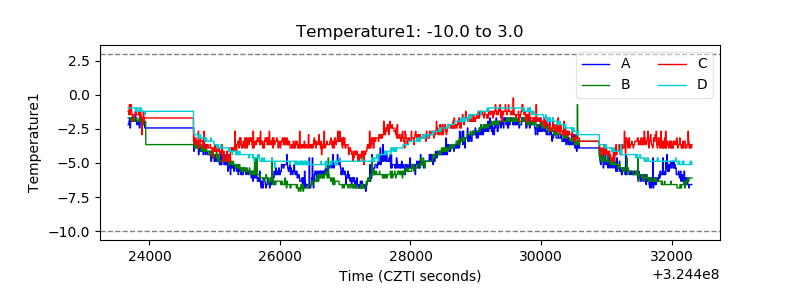 |
| Veto HV Monitor | 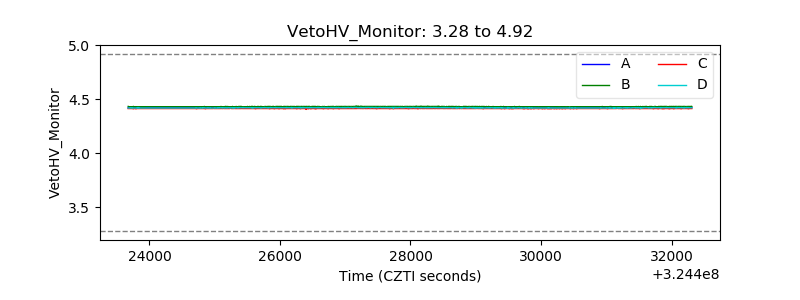 |
| Veto LLD | 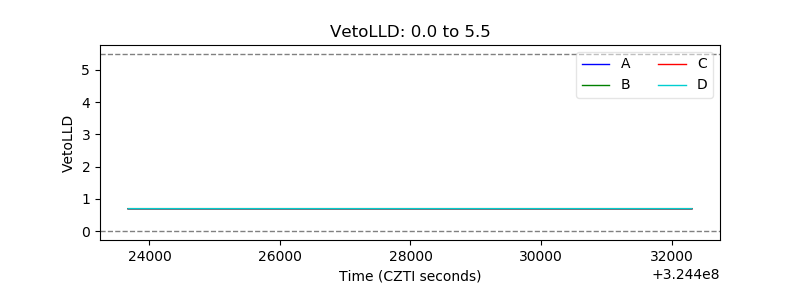 |
| Alpha Counter | 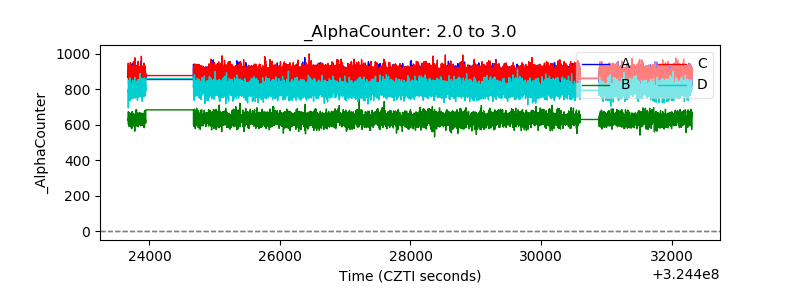 |
| _CPM_Rate | 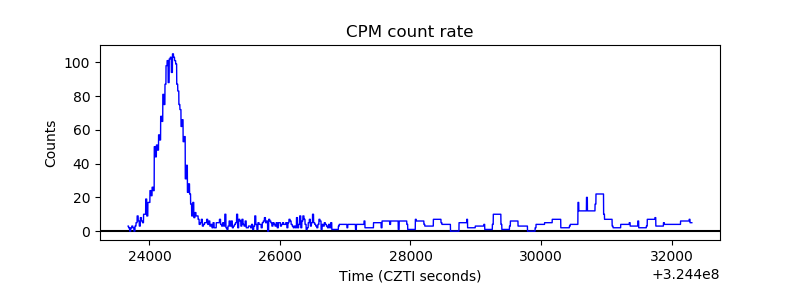 |
| CZT Counter | 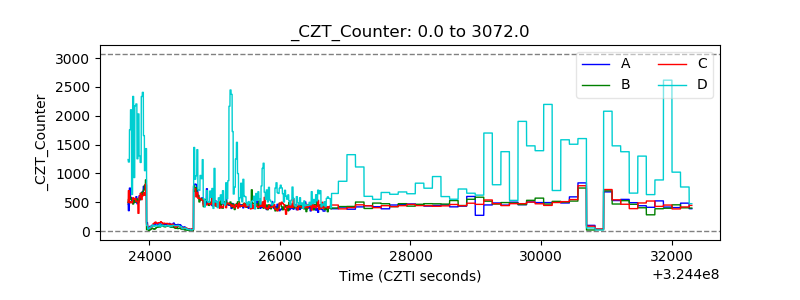 |
| +2.5 Volts monitor |  |
| +5 Volts monitor |  |
| _ROLL_ROT | 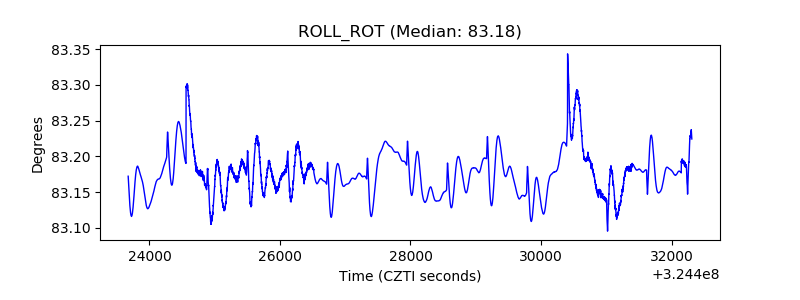 |
| _Roll_DEC | 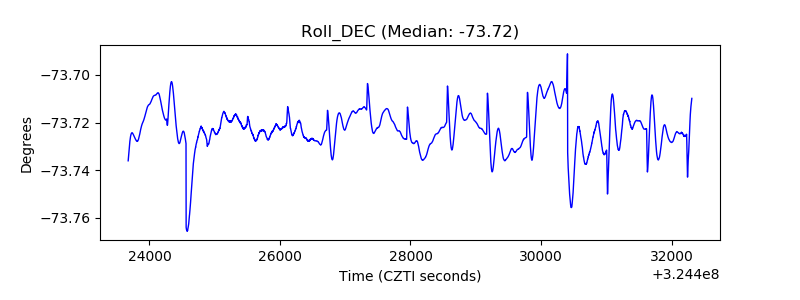 |
| _Roll_RA | 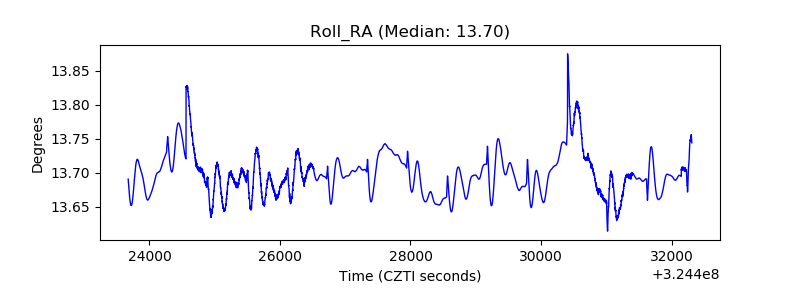 |
| Veto Counter | 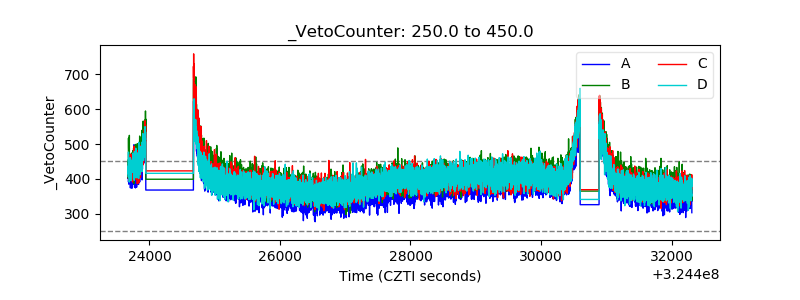 |