| Param | Original file | Final file |
|---|---|---|
| Filename | modeM0/AS1T03_187T01_9000003608_24555cztM0_level2.evt | modeM0/AS1T03_187T01_9000003608_24555cztM0_level2_quad_clean.evt |
| Size (bytes) | 601,813,440 | 125,429,760 |
| Size | 573.9 MB | 119.6 MB |
| Events in quadrant A | 3,680,002 | 835,893 |
| Events in quadrant B | 3,731,227 | 847,881 |
| Events in quadrant C | 3,728,803 | 794,891 |
| Events in quadrant D | 6,552,691 | 773,353 |
| Mode SS | |||
|---|---|---|---|
| Quadrant | BADHDUFLAG | Total packets | Discarded packets |
| A | 0 | 162 | 0 |
| B | 0 | 162 | 0 |
| C | 0 | 162 | 0 |
| D | 0 | 162 | 0 |
| Mode M9 | |||
|---|---|---|---|
| Quadrant | BADHDUFLAG | Total packets | Discarded packets |
| A | 0 | 5 | 0 |
| B | 0 | 5 | 0 |
| C | 0 | 5 | 0 |
| D | 0 | 5 | 0 |
| Mode M0 | |||
|---|---|---|---|
| Quadrant | BADHDUFLAG | Total packets | Discarded packets |
| A | 0 | 16174 | 2 |
| B | 0 | 16227 | 2 |
| C | 0 | 16195 | 2 |
| D | 0 | 24946 | 2 |
| Quadrant | Total seconds | Saturated seconds | Saturation percentage |
|---|---|---|---|
| A | 7864 | 144 | 1.831129% |
| B | 7865 | 205 | 2.606484% |
| C | 7865 | 209 | 2.657343% |
| D | 7865 | 388 | 4.933249% |
Noise dominated data is calculated using 1-second bins in cleaned event files. If a bin has >2000 counts, and if more than 50% of those come from <1% of pixels, then it is considered to be noise-dominated and hence unusable.
| Quadrant | # 1 sec bins | Bins with >0 counts | Bins with >2000 counts | High rate bins dominated by noise | Noise dominated (total time) | Noise dominated (detector-on time) | Marked lightcurve |
|---|---|---|---|---|---|---|---|
| A | 8399 | 7866 | 2 | 2 | 0.02% | 0.03% | 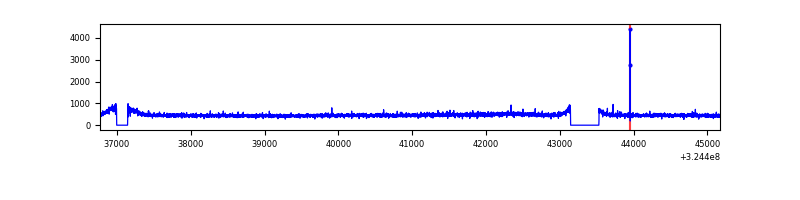 |
| B | 8400 | 7867 | 1 | 1 | 0.01% | 0.01% | 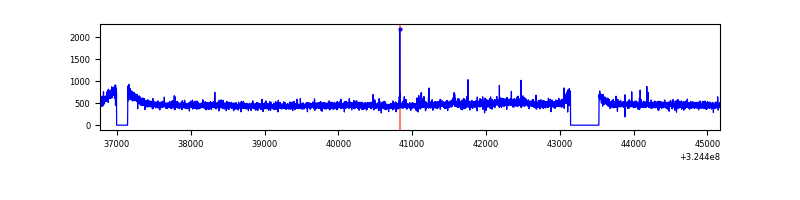 |
| C | 8400 | 7867 | 1 | 1 | 0.01% | 0.01% | 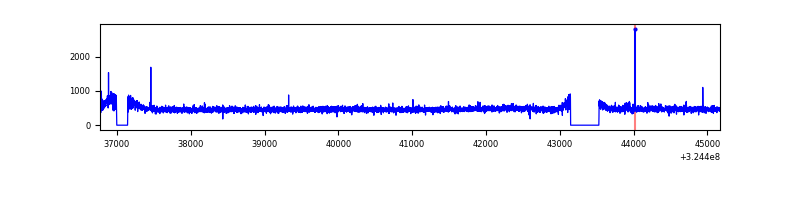 |
| D | 8400 | 7866 | 180 | 180 | 2.14% | 2.29% | 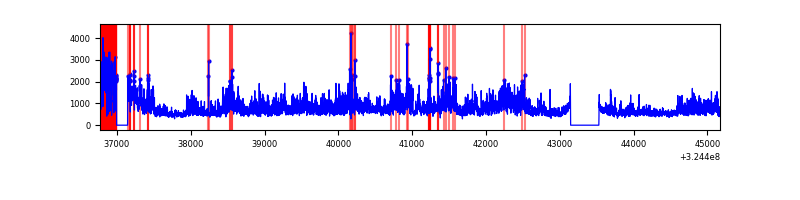 |
Top three noisy pixels from each quadrant. If the there are fewer than three noisy pixels in the level2.evt file, extra rows are filled as -1
| Pixel properties | Quadrant properties | ||||||
|---|---|---|---|---|---|---|---|
| Quadrant | DetID | PixID | Counts | Sigma | Mean | Median | Sigma |
| A | 10 | 255 | 13876 | 67.67 | 949 | 928 | 191.3 |
| A | 13 | 254 | 12733 | 61.7 | 949 | 928 | 191.3 |
| A | 3 | 137 | 8816 | 41.23 | 949 | 928 | 191.3 |
| B | 12 | 111 | 22218 | 117.67 | 947 | 921 | 181.0 |
| B | 11 | 111 | 19949 | 105.13 | 947 | 921 | 181.0 |
| B | 14 | 111 | 17640 | 92.37 | 947 | 921 | 181.0 |
| C | 14 | 238 | 145550 | 689.37 | 905 | 908 | 209.8 |
| C | 2 | 16 | 15263 | 68.42 | 905 | 908 | 209.8 |
| C | 3 | 233 | 12805 | 56.7 | 905 | 908 | 209.8 |
| D | 8 | 195 | 2432050 | 11038.34 | 899 | 870 | 220.2 |
| D | 1 | 255 | 449648 | 2037.6 | 899 | 870 | 220.2 |
| D | 12 | 218 | 114238 | 514.73 | 899 | 870 | 220.2 |
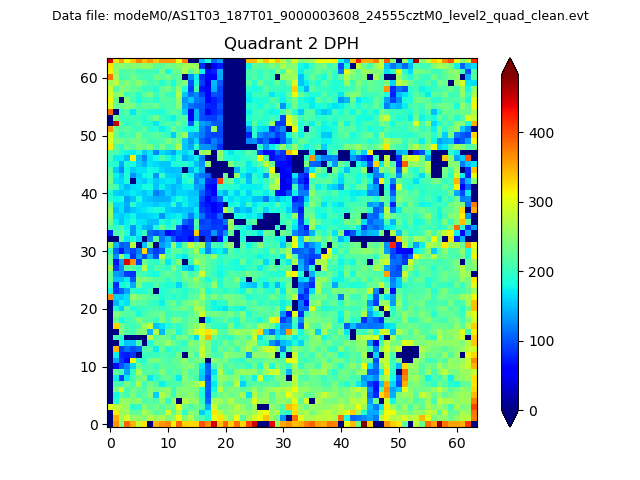
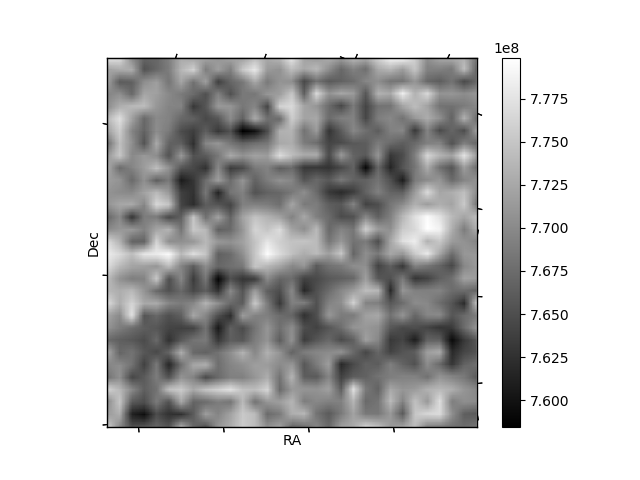
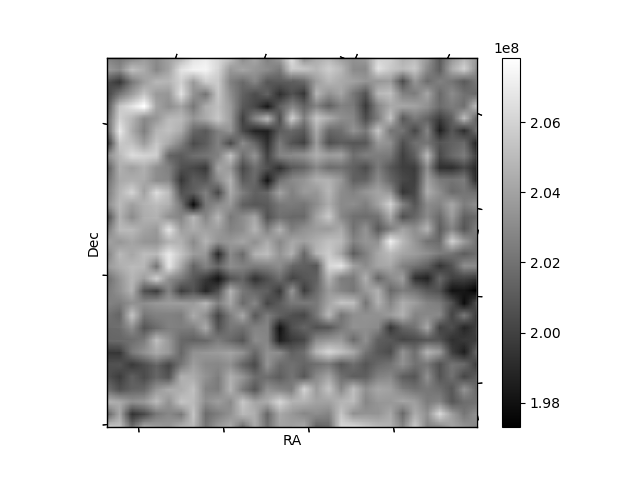
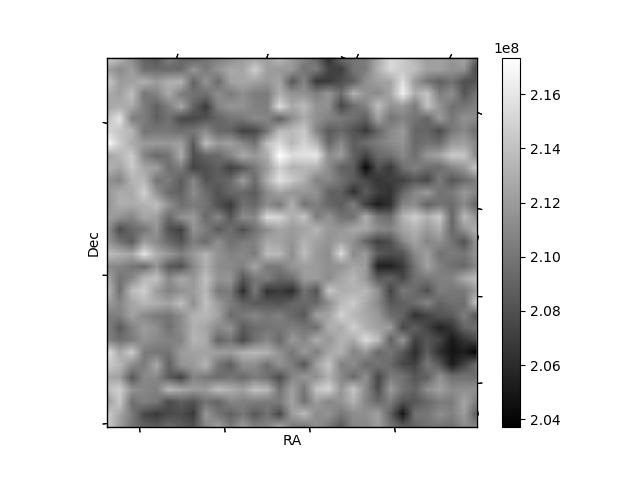
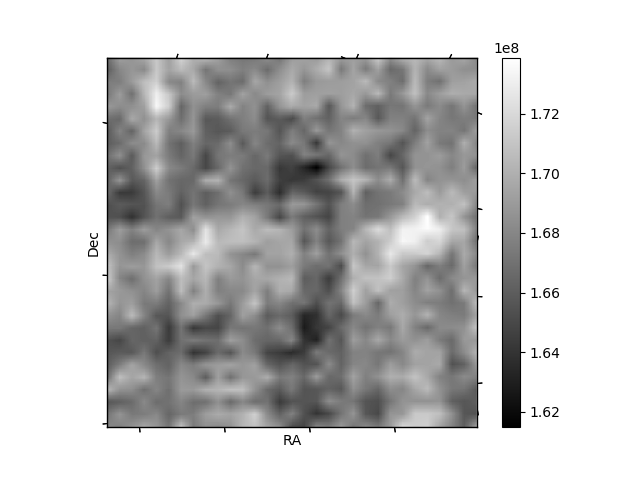
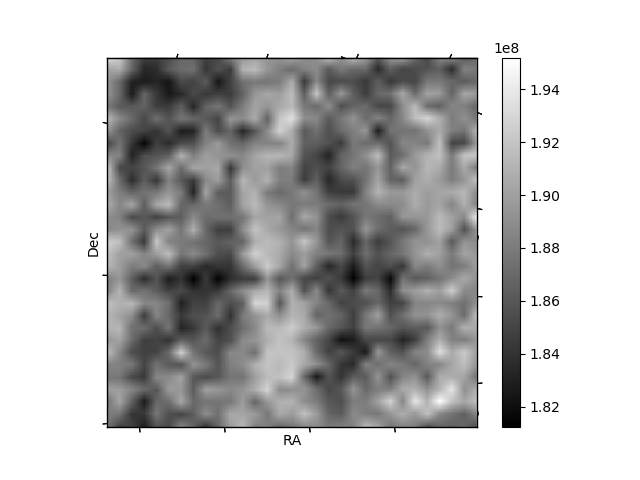
Histogram calculated using DETX and DETY for each event in the final _common_clean file
| Quadrant A | 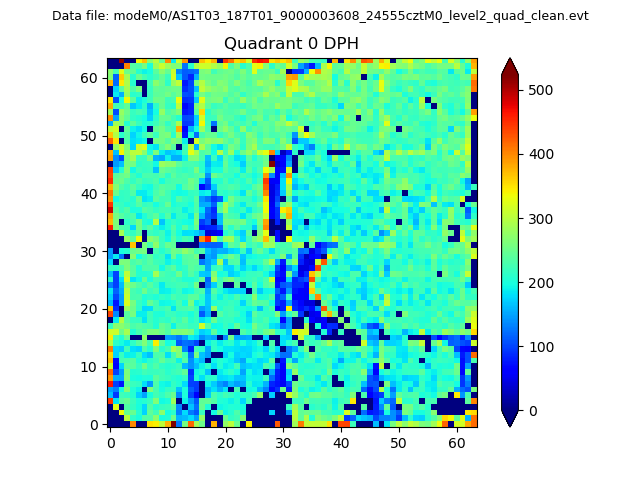 |
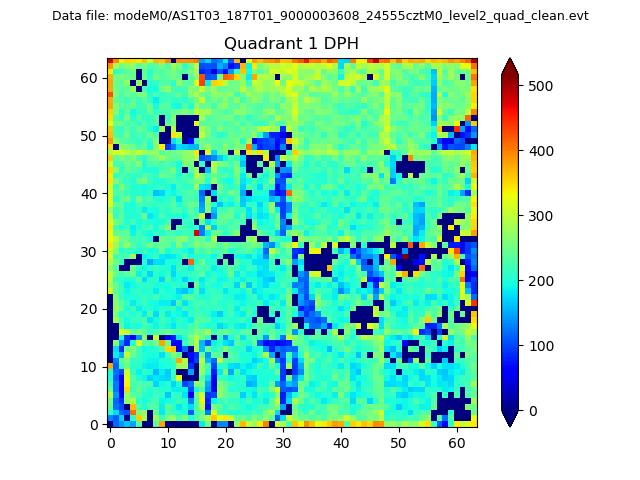 |
Quadrant B |
|---|---|---|---|
| Quadrant D | 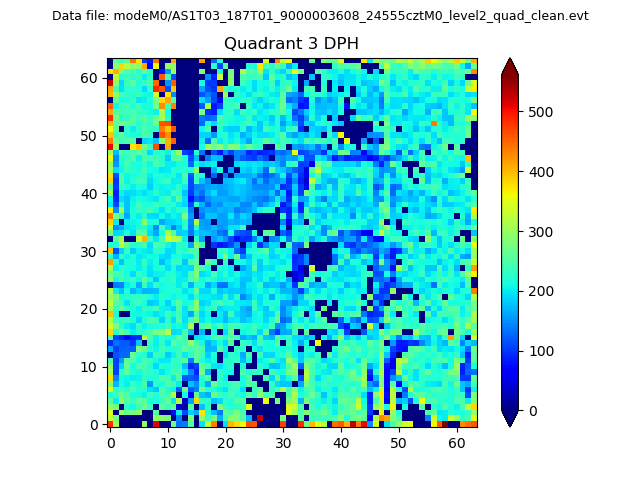 |
 |
Quadrant C |
| Plot type | Count rate plots | Images |
|---|---|---|
| Comparison with Poisson distribution Blue bars denote a histogram of data divided into 1 sec bins. Red curve is a Poisson curve with rate = median count rate of data. |
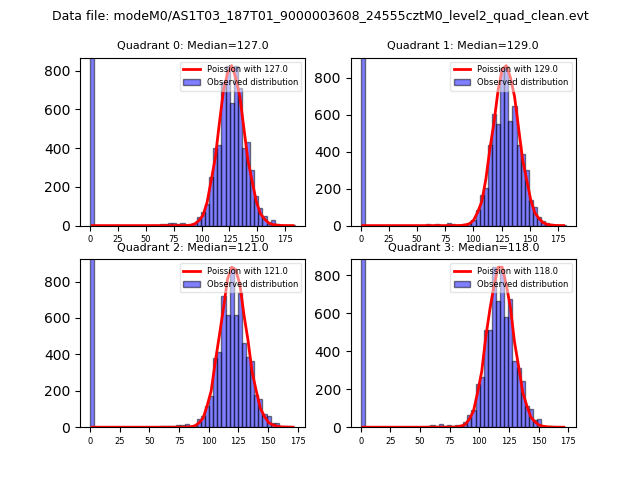 |
 |
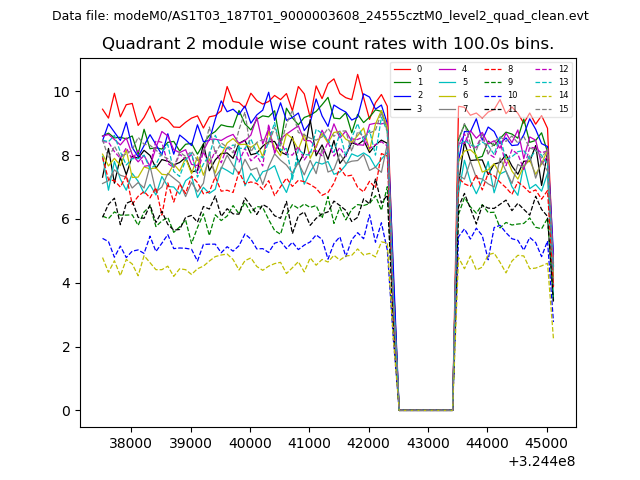
| Quadrant-wise count rates Data is divided into 100 sec bins |
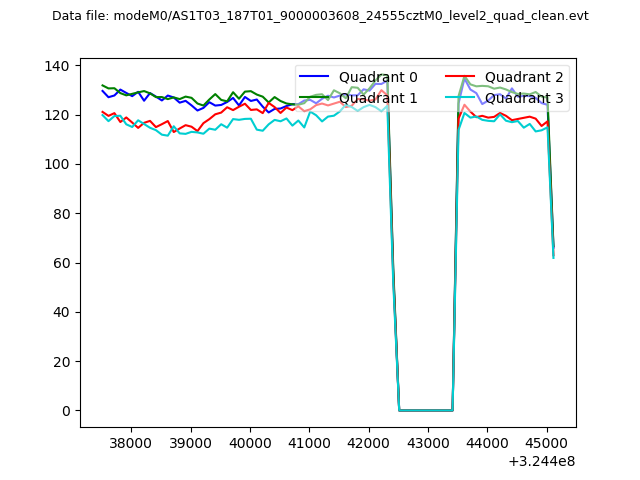 |
|
| Module-wise count rates for Quadrant A Data is divided into 100 sec bins |
 |
 |
| Module-wise count rates for Quadrant B Data is divided into 100 sec bins |
 |
 |
| Module-wise count rates for Quadrant C Data is divided into 100 sec bins |
 |
 |
| Module-wise count rates for Quadrant D Data is divided into 100 sec bins |
 |
 |
| Parameter | Plot |
|---|---|
| CZT HV Monitor | 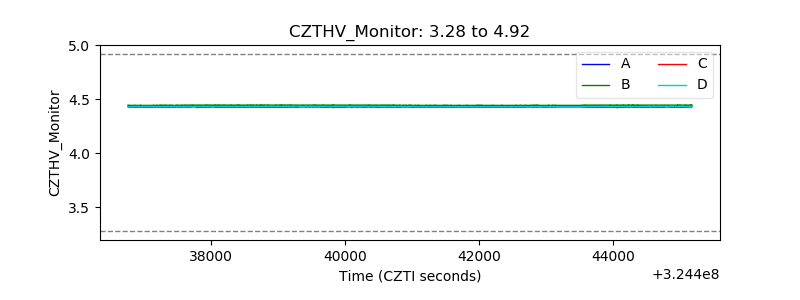 |
| D_VDD | 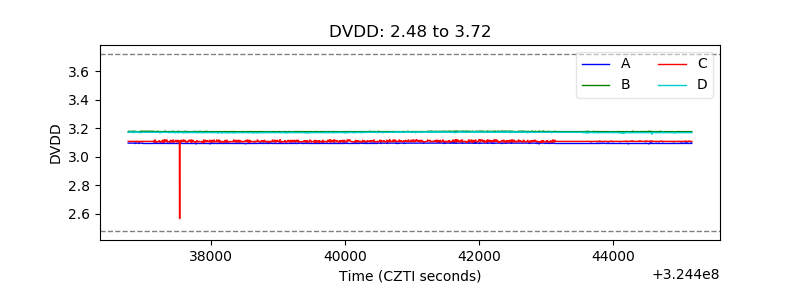 |
| Temperature 1 | 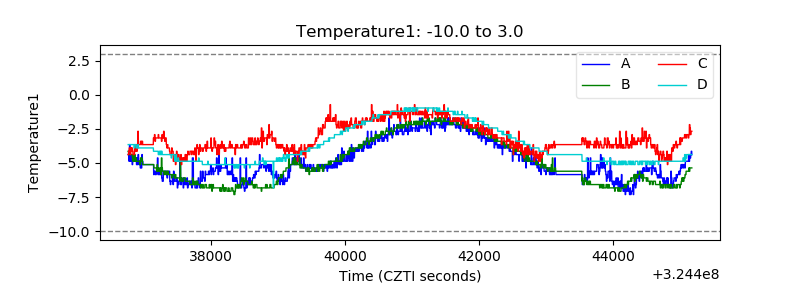 |
| Veto HV Monitor | 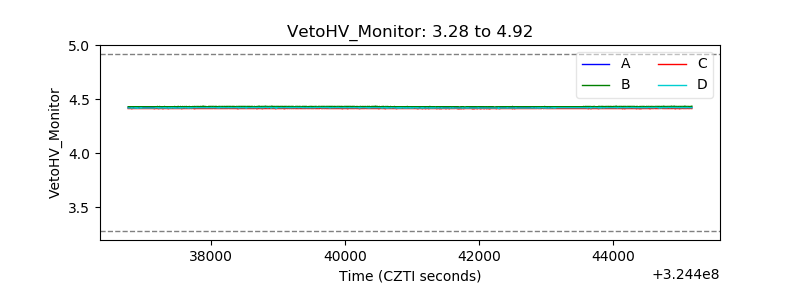 |
| Veto LLD | 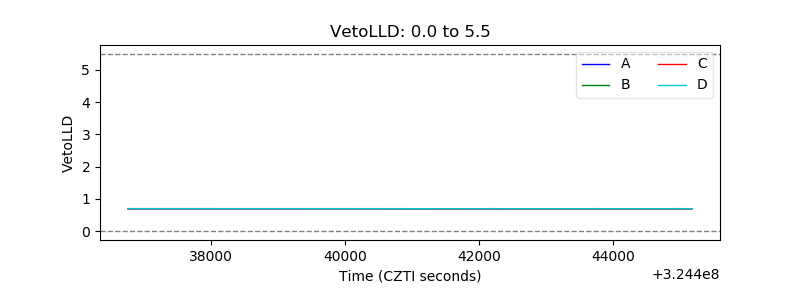 |
| Alpha Counter | 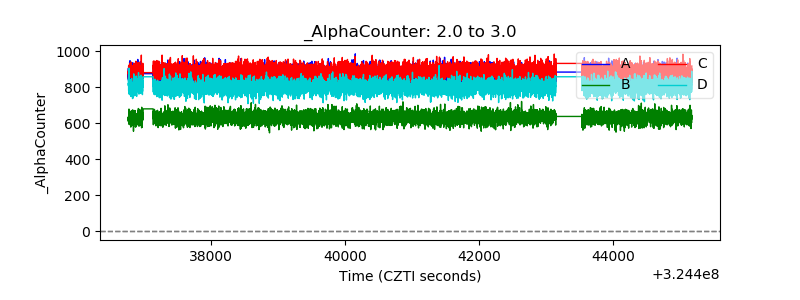 |
| _CPM_Rate | 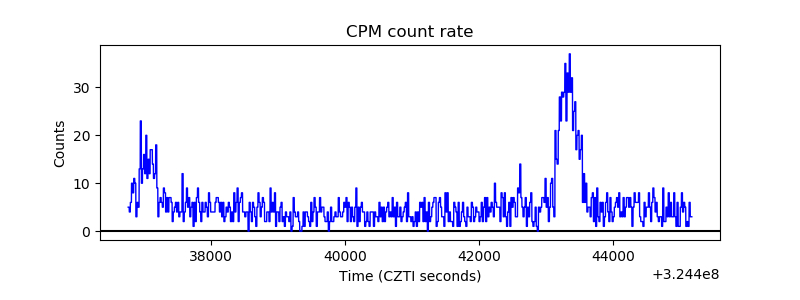 |
| CZT Counter | 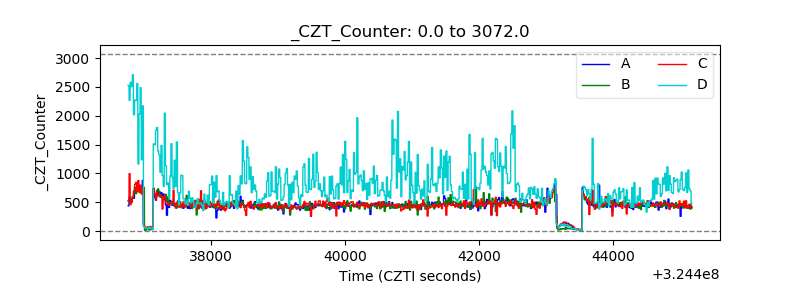 |
| +2.5 Volts monitor |  |
| +5 Volts monitor |  |
| _ROLL_ROT | 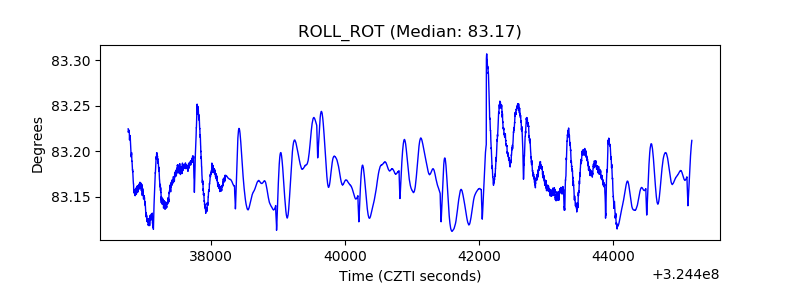 |
| _Roll_DEC |  |
| _Roll_RA | 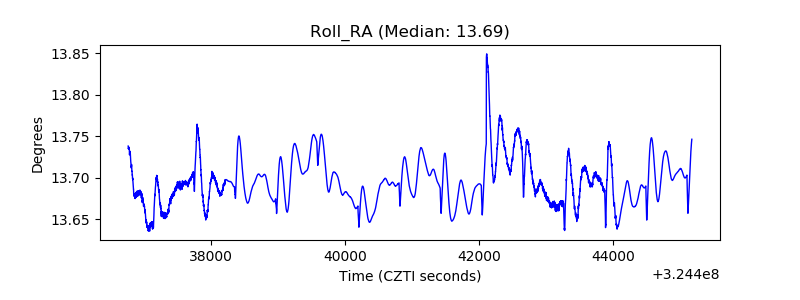 |
| Veto Counter | 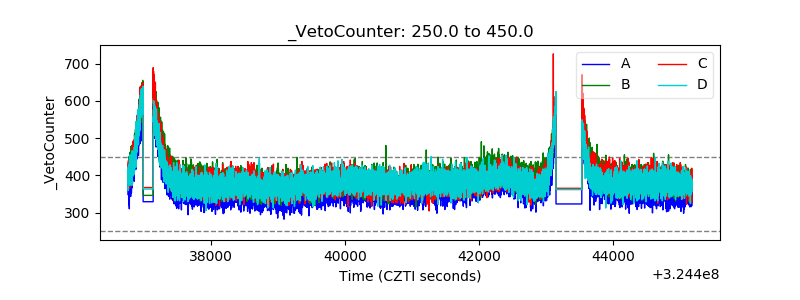 |