| Param | Original file | Final file |
|---|---|---|
| Filename | modeM0/AS1T03_187T01_9000003608_24558cztM0_level2.evt | modeM0/AS1T03_187T01_9000003608_24558cztM0_level2_quad_clean.evt |
| Size (bytes) | 1,475,832,960 | 297,941,760 |
| Size | 1.4 GB | 284.1 MB |
| Events in quadrant A | 8,620,797 | 1,986,071 |
| Events in quadrant B | 8,565,252 | 2,010,082 |
| Events in quadrant C | 8,774,127 | 1,921,812 |
| Events in quadrant D | 17,504,788 | 1,848,537 |
| Mode SS | |||
|---|---|---|---|
| Quadrant | BADHDUFLAG | Total packets | Discarded packets |
| A | 0 | 372 | 0 |
| B | 0 | 372 | 0 |
| C | 0 | 372 | 0 |
| D | 0 | 372 | 0 |
| Mode M9 | |||
|---|---|---|---|
| Quadrant | BADHDUFLAG | Total packets | Discarded packets |
| A | 0 | 22 | 0 |
| B | 0 | 22 | 0 |
| C | 0 | 22 | 0 |
| D | 0 | 22 | 0 |
| Mode M0 | |||
|---|---|---|---|
| Quadrant | BADHDUFLAG | Total packets | Discarded packets |
| A | 0 | 37509 | 3 |
| B | 0 | 37154 | 3 |
| C | 0 | 37794 | 3 |
| D | 0 | 64727 | 3 |
| Quadrant | Total seconds | Saturated seconds | Saturation percentage |
|---|---|---|---|
| A | 18251 | 148 | 0.810914% |
| B | 18251 | 115 | 0.630102% |
| C | 18251 | 236 | 1.293080% |
| D | 18251 | 975 | 5.342173% |
Noise dominated data is calculated using 1-second bins in cleaned event files. If a bin has >2000 counts, and if more than 50% of those come from <1% of pixels, then it is considered to be noise-dominated and hence unusable.
| Quadrant | # 1 sec bins | Bins with >0 counts | Bins with >2000 counts | High rate bins dominated by noise | Noise dominated (total time) | Noise dominated (detector-on time) | Marked lightcurve |
|---|---|---|---|---|---|---|---|
| A | 20471 | 18254 | 44 | 44 | 0.21% | 0.24% | 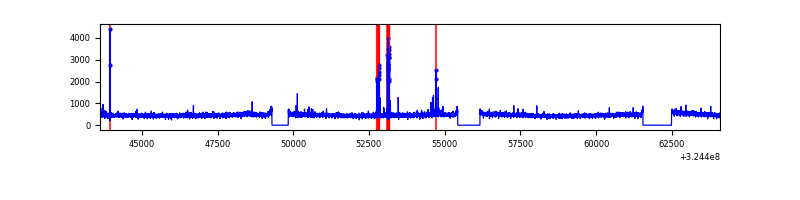 |
| B | 20471 | 18254 | 1 | 1 | 0.00% | 0.01% | 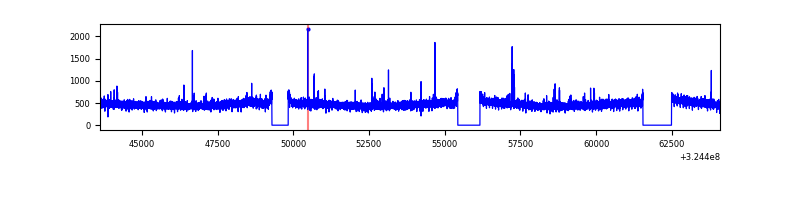 |
| C | 20471 | 18254 | 23 | 23 | 0.11% | 0.13% | 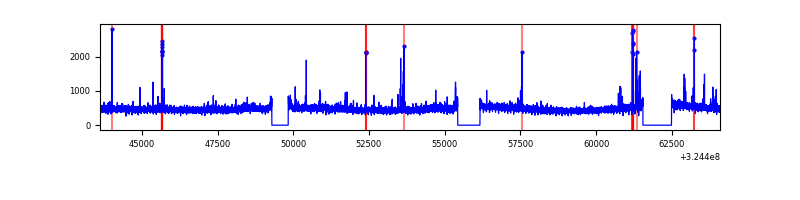 |
| D | 20471 | 18254 | 957 | 957 | 4.67% | 5.24% | 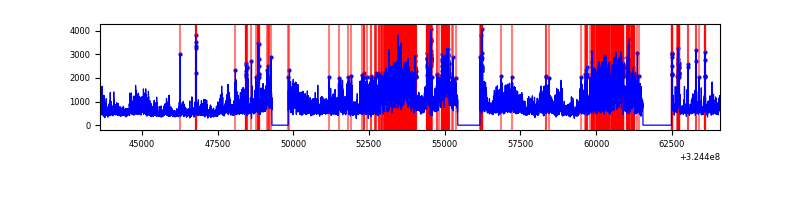 |
Top three noisy pixels from each quadrant. If the there are fewer than three noisy pixels in the level2.evt file, extra rows are filled as -1
| Pixel properties | Quadrant properties | ||||||
|---|---|---|---|---|---|---|---|
| Quadrant | DetID | PixID | Counts | Sigma | Mean | Median | Sigma |
| A | 6 | 16 | 188247 | 428.6 | 2178 | 2128 | 434.2 |
| A | 10 | 255 | 29098 | 62.11 | 2178 | 2128 | 434.2 |
| A | 13 | 254 | 28976 | 61.83 | 2178 | 2128 | 434.2 |
| B | 12 | 111 | 50724 | 118.21 | 2167 | 2113 | 411.2 |
| B | 11 | 111 | 45965 | 106.63 | 2167 | 2113 | 411.2 |
| B | 14 | 111 | 40375 | 93.04 | 2167 | 2113 | 411.2 |
| C | 14 | 238 | 335832 | 687.97 | 2093 | 2103 | 485.1 |
| C | 2 | 16 | 173598 | 353.53 | 2093 | 2103 | 485.1 |
| C | 5 | 112 | 66084 | 131.89 | 2093 | 2103 | 485.1 |
| D | 8 | 195 | 8526920 | 16674.52 | 2105 | 2042 | 511.3 |
| D | 1 | 52 | 428792 | 834.71 | 2105 | 2042 | 511.3 |
| D | 12 | 218 | 343971 | 668.81 | 2105 | 2042 | 511.3 |
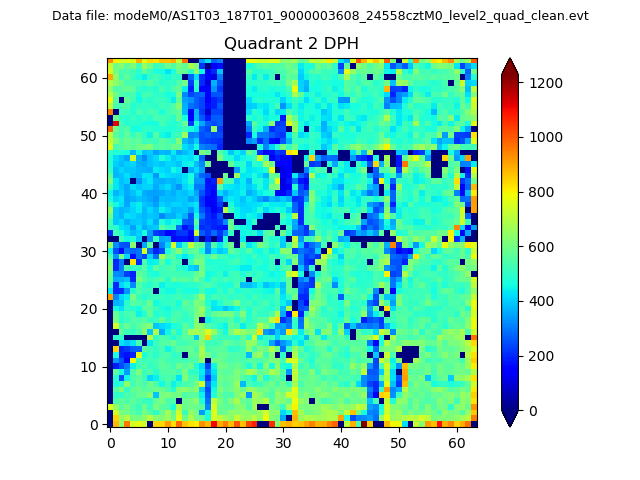
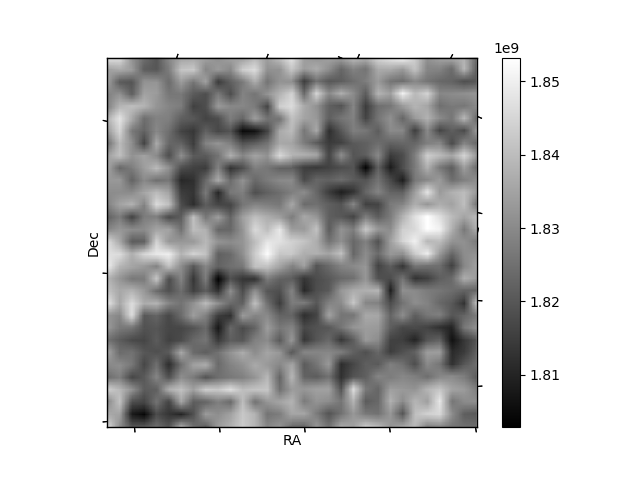
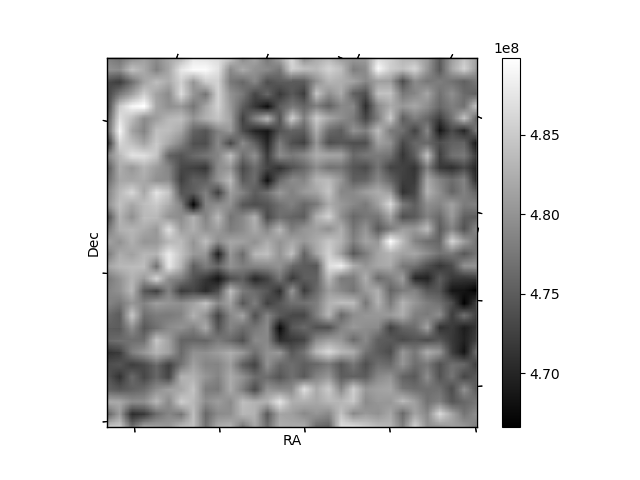
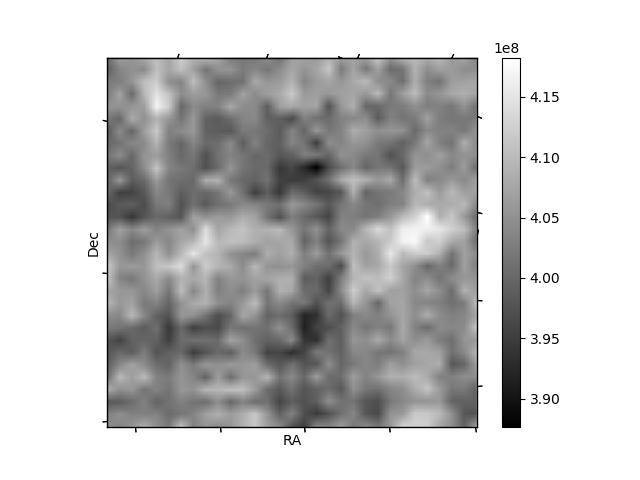
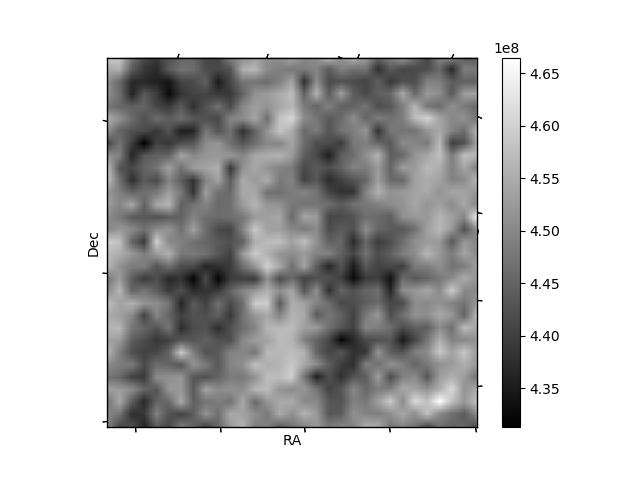
Histogram calculated using DETX and DETY for each event in the final _common_clean file
| Quadrant A | 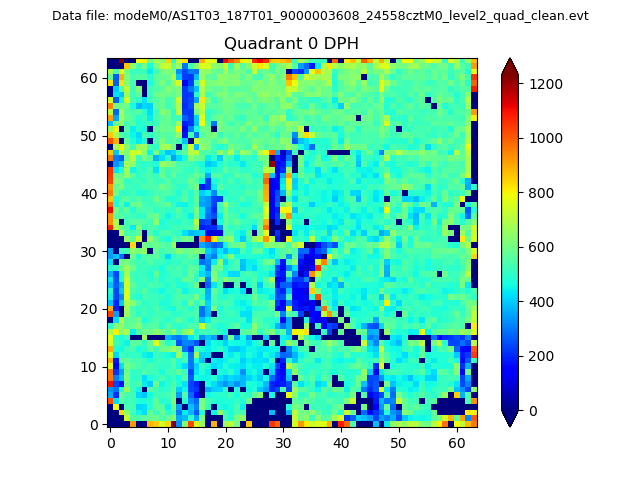 |
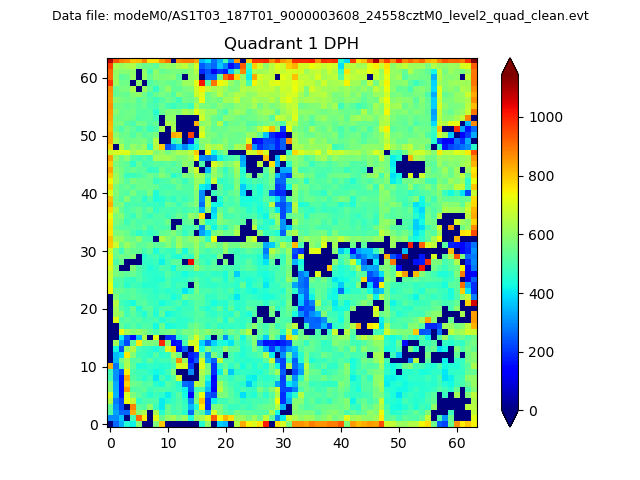 |
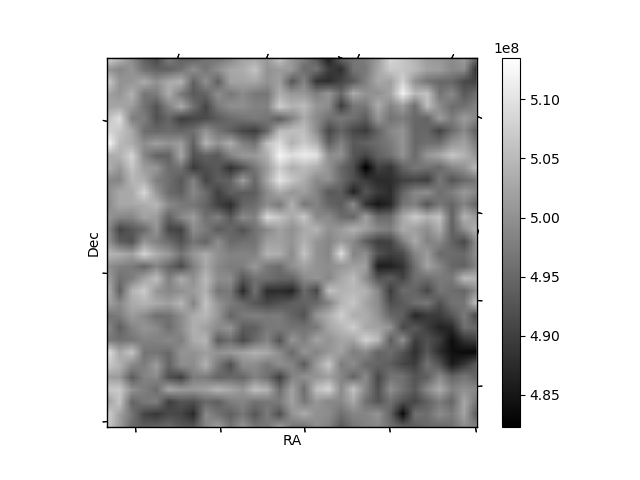
Quadrant B |
|---|---|---|---|
| Quadrant D | 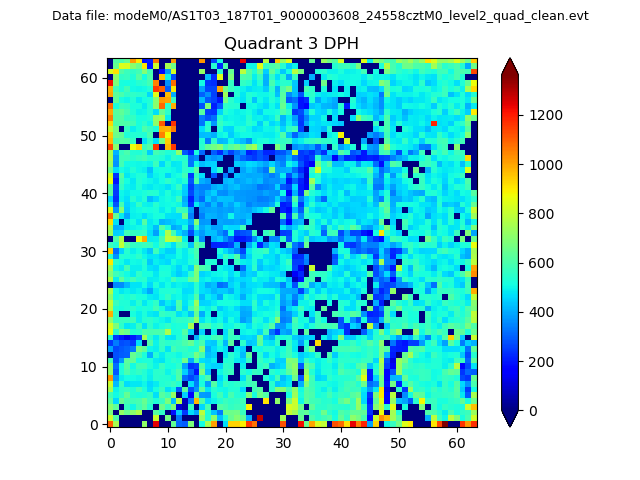 |
 |
Quadrant C |
| Plot type | Count rate plots | Images |
|---|---|---|
| Comparison with Poisson distribution Blue bars denote a histogram of data divided into 1 sec bins. Red curve is a Poisson curve with rate = median count rate of data. |
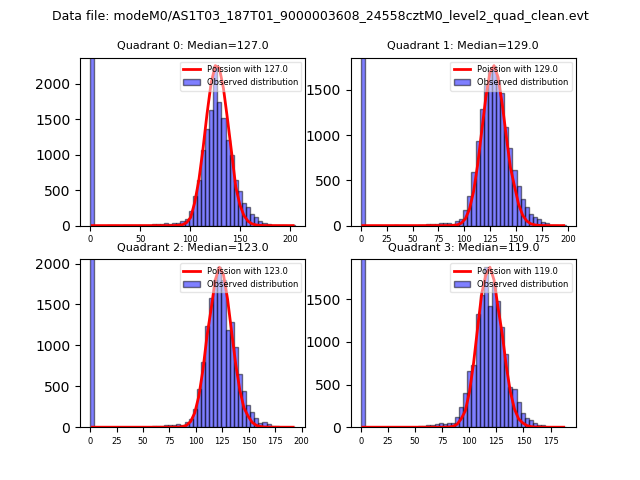 |
 |
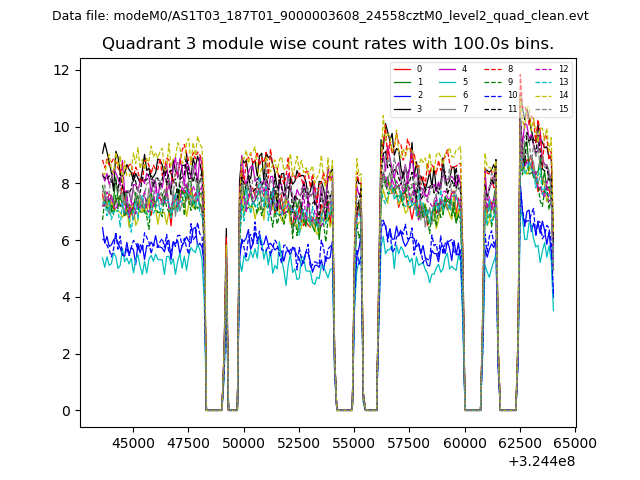
| Quadrant-wise count rates Data is divided into 100 sec bins |
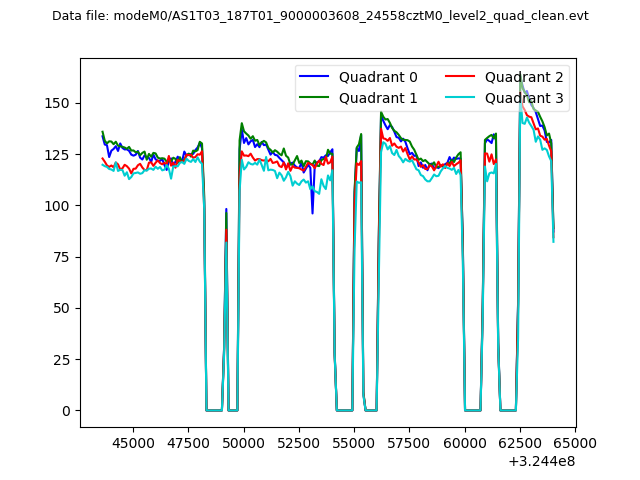 |
|
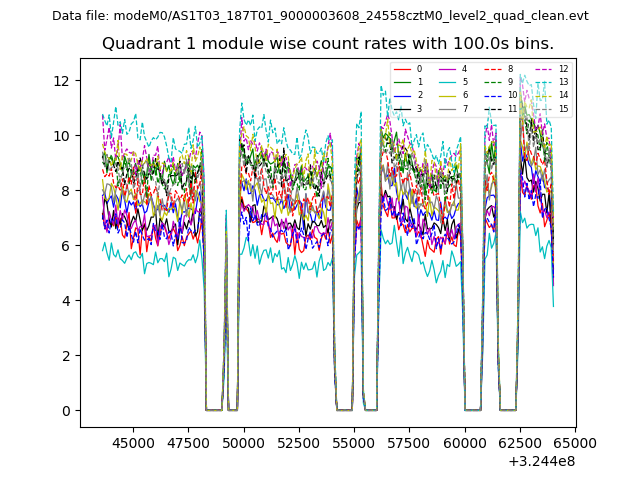
| Module-wise count rates for Quadrant A Data is divided into 100 sec bins |
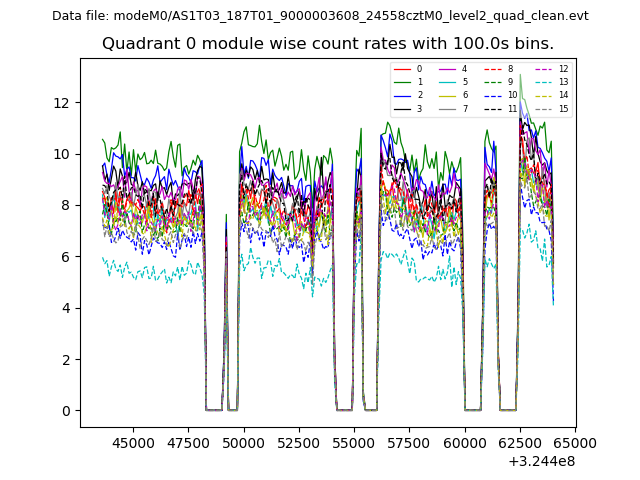 |
 |
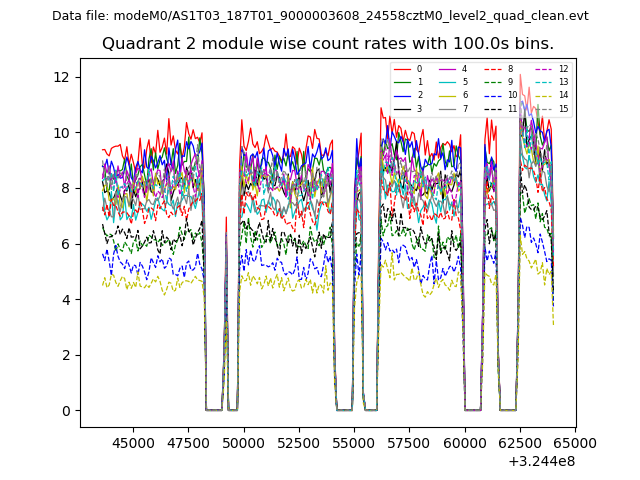
| Module-wise count rates for Quadrant B Data is divided into 100 sec bins |
 |
 |
| Module-wise count rates for Quadrant C Data is divided into 100 sec bins |
 |
 |
| Module-wise count rates for Quadrant D Data is divided into 100 sec bins |
 |
 |
| Parameter | Plot |
|---|---|
| CZT HV Monitor | 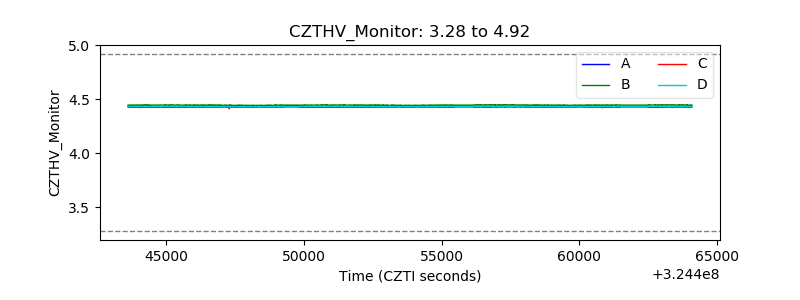 |
| D_VDD | 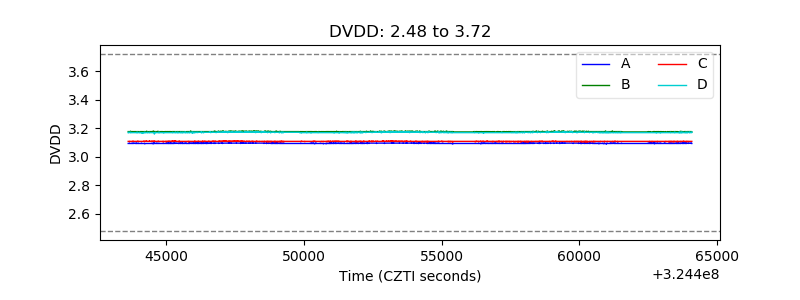 |
| Temperature 1 | 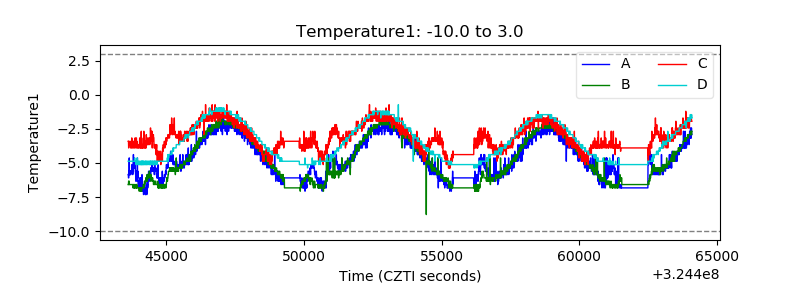 |
| Veto HV Monitor | 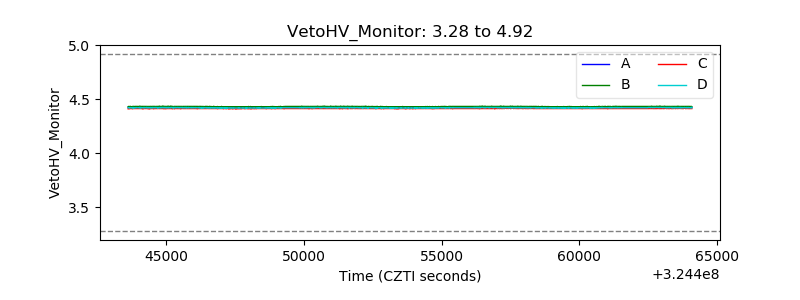 |
| Veto LLD | 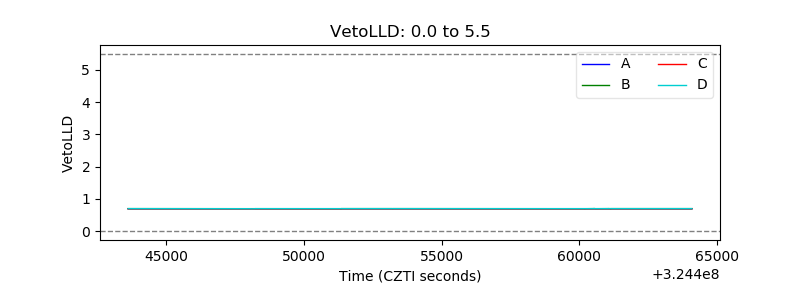 |
| Alpha Counter | 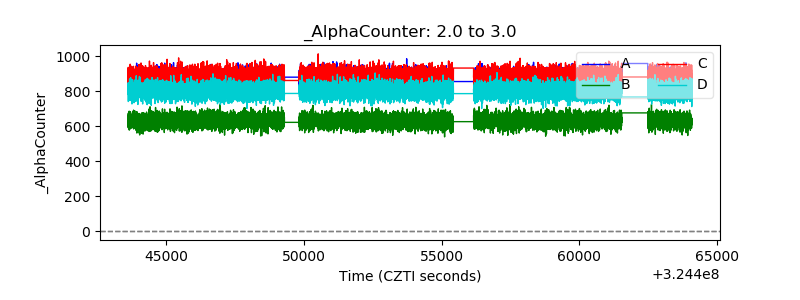 |
| _CPM_Rate | 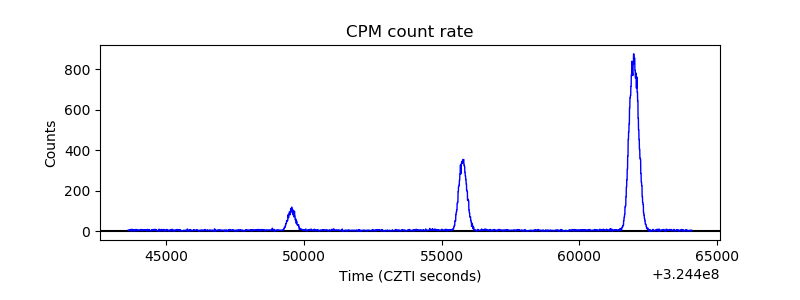 |
| CZT Counter | 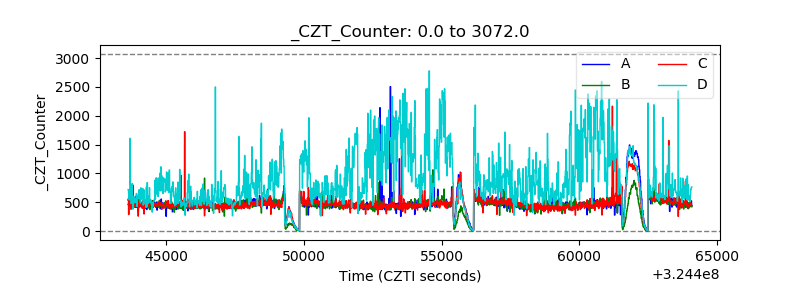 |
| +2.5 Volts monitor |  |
| +5 Volts monitor | 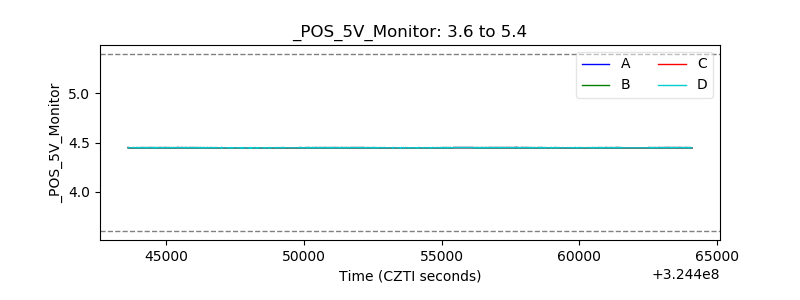 |
| _ROLL_ROT | 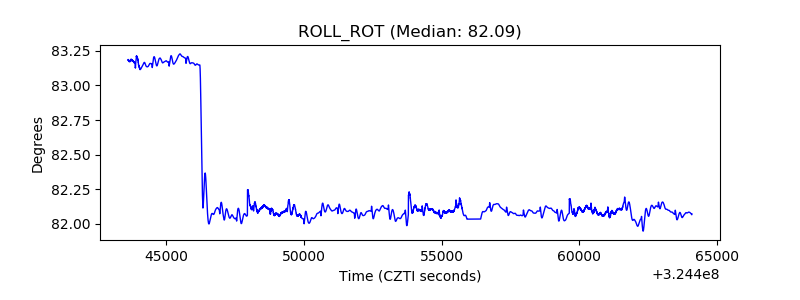 |
| _Roll_DEC | 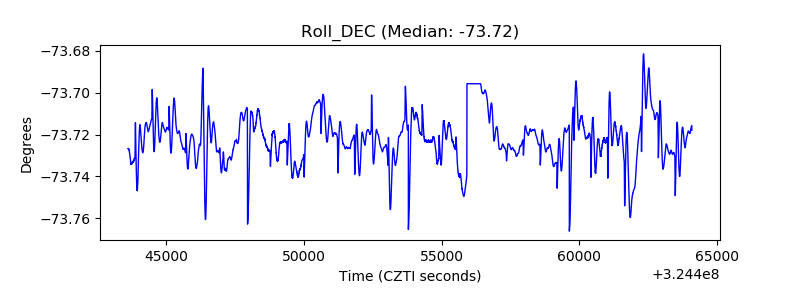 |
| _Roll_RA | 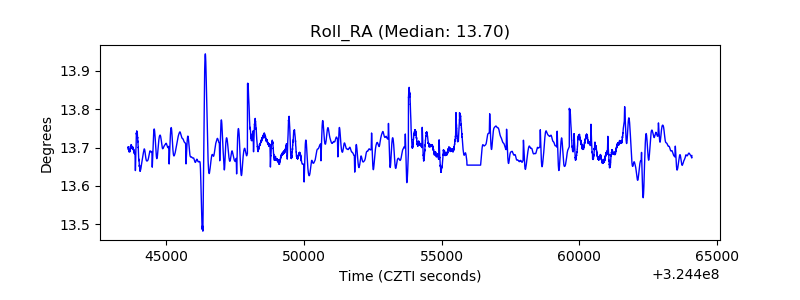 |
| Veto Counter | 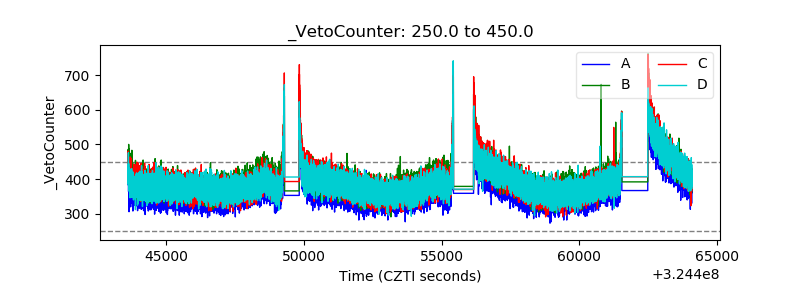 |