| Param | Original file | Final file |
|---|---|---|
| Filename | modeM0/AS1T03_183T01_9000003610cztM0_level2.fits | modeM0/AS1T03_183T01_9000003610cztM0_level2_quad_clean.evt |
| Size (bytes) | 1,215,319,680 | 1,328,489,280 |
| Size | 1.1 GB | 1.2 GB |
| Events in quadrant A | 7,763,990 | 8,747,788 |
| Events in quadrant B | 7,353,388 | 8,694,386 |
| Events in quadrant C | 6,964,472 | 7,076,542 |
| Events in quadrant D | 6,353,110 | 7,353,702 |
| Mode M0 | |||
|---|---|---|---|
| Quadrant | BADHDUFLAG | Total packets | Discarded packets |
| A | 0 | 259547 | 0 |
| B | 0 | 264330 | 0 |
| C | 0 | 397047 | 0 |
| D | 0 | 365216 | 0 |
| Mode SS | |||
|---|---|---|---|
| Quadrant | BADHDUFLAG | Total packets | Discarded packets |
| A | 0 | 2486 | 0 |
| B | 0 | 2486 | 0 |
| C | 0 | 2486 | 0 |
| D | 0 | 2486 | 0 |
| Mode M9 | |||
|---|---|---|---|
| Quadrant | BADHDUFLAG | Total packets | Discarded packets |
| A | 0 | 199 | 0 |
| B | 0 | 199 | 0 |
| C | 0 | 199 | 0 |
| D | 0 | 199 | 0 |
| Quadrant | Total seconds | Saturated seconds | Saturation percentage |
|---|---|---|---|
| A | 122041 | 1582 | 1.296286% |
| B | 122041 | 2260 | 1.851837% |
| C | 122041 | 18269 | 14.969559% |
| D | 122041 | 4564 | 3.739727% |
Noise dominated data is calculated using 1-second bins in cleaned event files. If a bin has >2000 counts, and if more than 50% of those come from <1% of pixels, then it is considered to be noise-dominated and hence unusable.
| Quadrant | # 1 sec bins | Bins with >0 counts | Bins with >2000 counts | High rate bins dominated by noise | Noise dominated (total time) | Noise dominated (detector-on time) | Marked lightcurve |
|---|---|---|---|---|---|---|---|
| A | 141792 | 122037 | 0 | 0 | 0.00% | 0.00% | 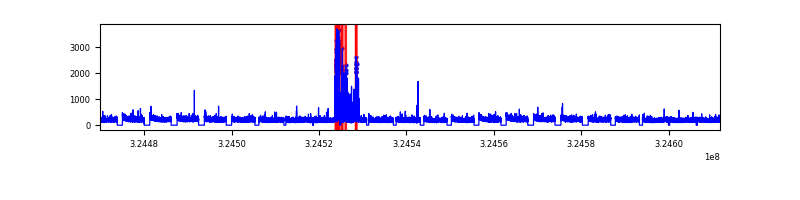 |
| B | 141792 | 122018 | 0 | 0 | 0.00% | 0.00% |  |
| C | 141792 | 122024 | 0 | 0 | 0.00% | 0.00% |  |
| D | 141792 | 122017 | 0 | 0 | 0.00% | 0.00% |  |
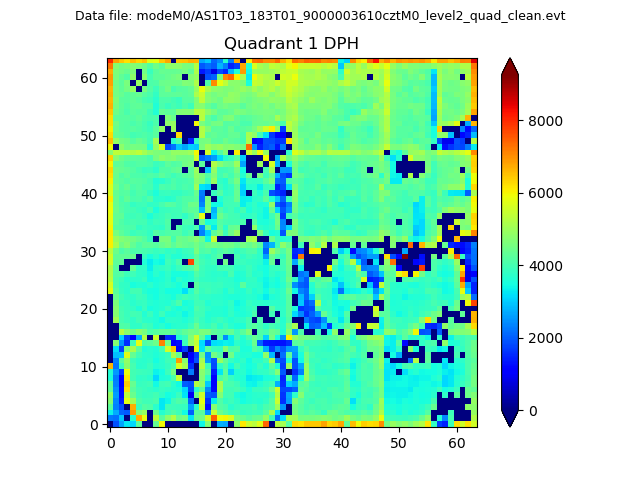
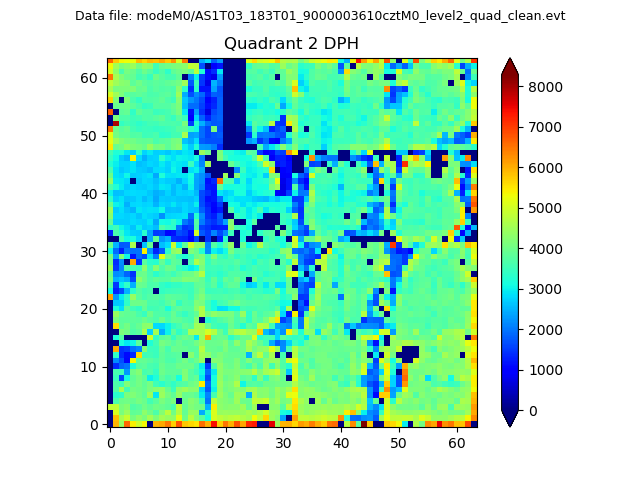
Top three noisy pixels from each quadrant. If the there are fewer than three noisy pixels in the level2.evt file, extra rows are filled as -1
| Pixel properties | Quadrant properties | ||||||
|---|---|---|---|---|---|---|---|
| Quadrant | DetID | PixID | Counts | Sigma | Mean | Median | Sigma |
| A | 0 | 29 | 7290 | 10.98 | 2022 | 1911 | 489.8 |
| A | 7 | 110 | 6183 | 8.72 | 2022 | 1911 | 489.8 |
| A | 9 | 19 | 5753 | 7.84 | 2022 | 1911 | 489.8 |
| B | 2 | 9 | 5815 | 10.47 | 1951 | 1876 | 376.2 |
| B | 2 | 8 | 4885 | 8.0 | 1951 | 1876 | 376.2 |
| B | 5 | 128 | 4754 | 7.65 | 1951 | 1876 | 376.2 |
| C | 1 | 81 | 5455 | 8.03 | 1838 | 1729 | 464.1 |
| C | 1 | 80 | 5383 | 7.87 | 1838 | 1729 | 464.1 |
| C | 12 | 241 | 4744 | 6.5 | 1838 | 1729 | 464.1 |
| D | 6 | 67 | 4540 | 6.0 | 1816 | 1658 | 480.4 |
| D | 7 | 3 | 4534 | 5.99 | 1816 | 1658 | 480.4 |
| D | 6 | 231 | 4507 | 5.93 | 1816 | 1658 | 480.4 |
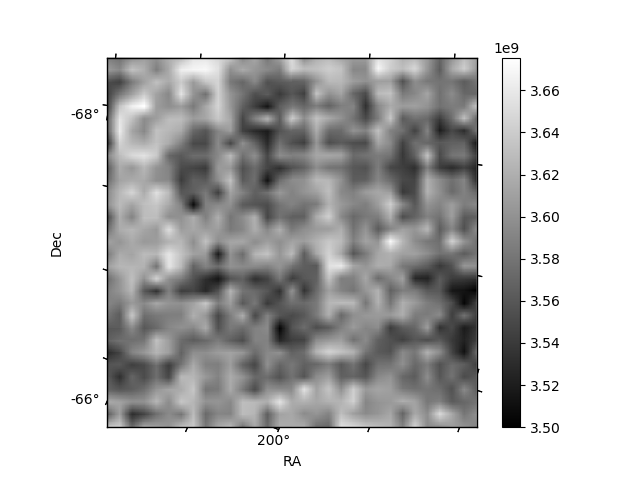
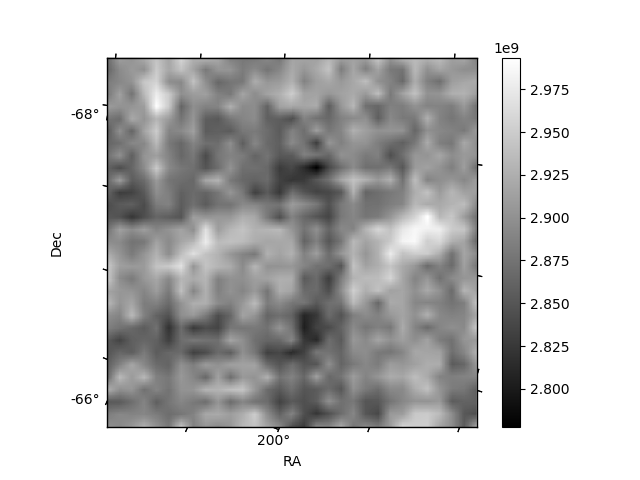
Histogram calculated using DETX and DETY for each event in the final _common_clean file
| Quadrant A |  |
 |
Quadrant B |
|---|---|---|---|
| Quadrant D | 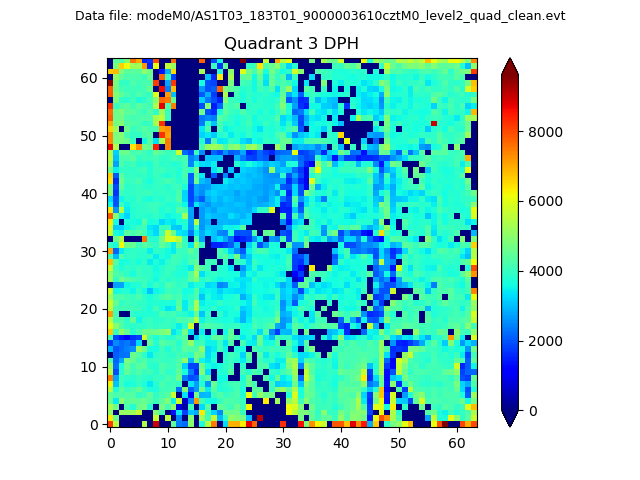 |
 |
Quadrant C |
| Plot type | Count rate plots | Images |
|---|---|---|
| Comparison with Poisson distribution Blue bars denote a histogram of data divided into 1 sec bins. Red curve is a Poisson curve with rate = median count rate of data. |
 |
 |
| Quadrant-wise count rates Data is divided into 100 sec bins |
 |
|
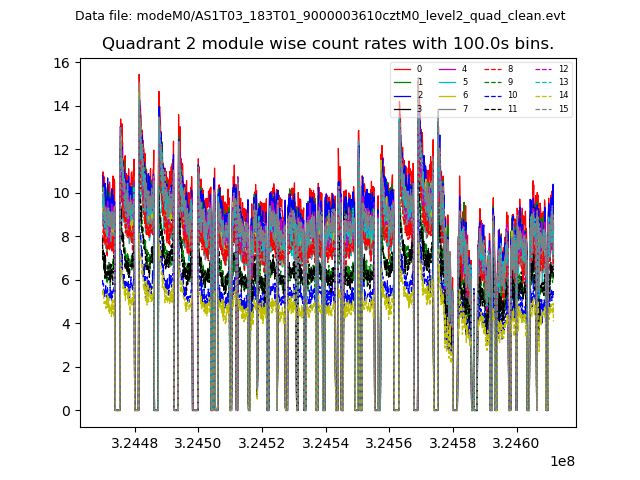
| Module-wise count rates for Quadrant A Data is divided into 100 sec bins |
 |
 |
| Module-wise count rates for Quadrant B Data is divided into 100 sec bins |
 |
 |
| Module-wise count rates for Quadrant C Data is divided into 100 sec bins |
 |
 |
| Module-wise count rates for Quadrant D Data is divided into 100 sec bins |
 |
 |
| Parameter | Plot |
|---|---|
| CZT HV Monitor |  |
| D_VDD |  |
| Temperature 1 |  |
| Veto HV Monitor |  |
| Veto LLD | 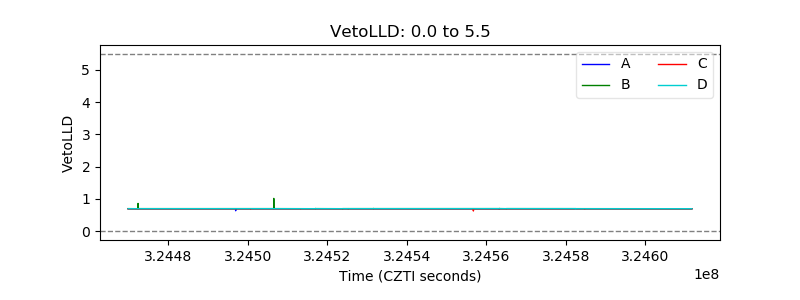 |
| Alpha Counter |  |
| _CPM_Rate | 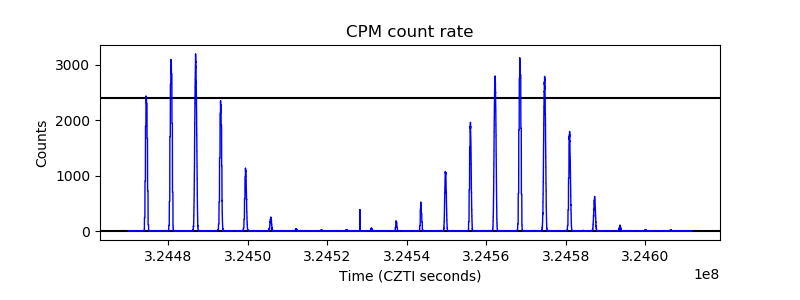 |
| CZT Counter | 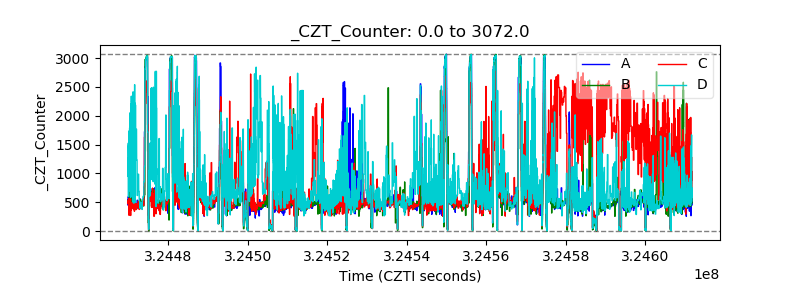 |
| +2.5 Volts monitor |  |
| +5 Volts monitor | 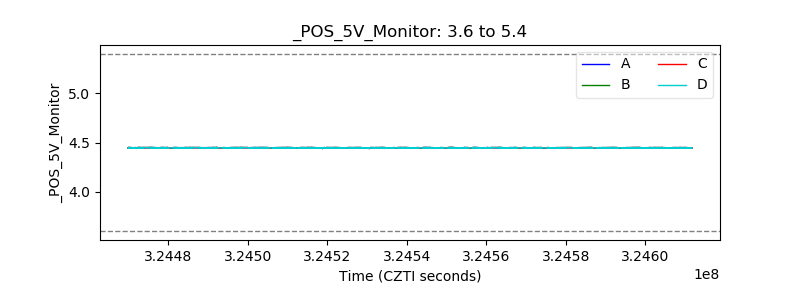 |
| _ROLL_ROT | 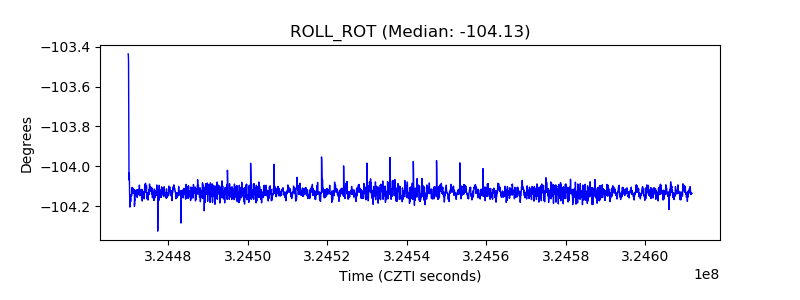 |
| _Roll_DEC | 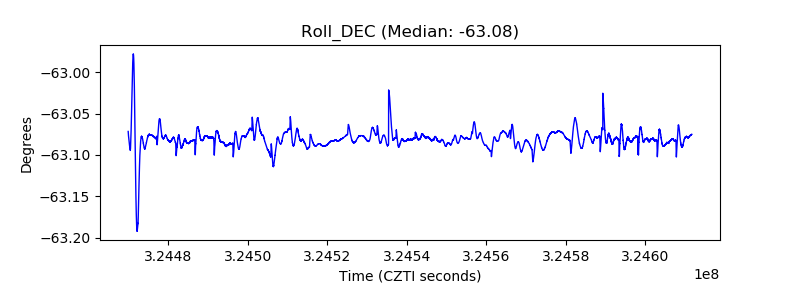 |
| _Roll_RA |  |
| Veto Counter |  |