| Param | Original file | Final file |
|---|---|---|
| Filename | modeM0/AS1T03_183T01_9000003610_24561cztM0_level2.evt | modeM0/AS1T03_183T01_9000003610_24561cztM0_level2_quad_clean.evt |
| Size (bytes) | 505,739,520 | 106,571,520 |
| Size | 482.3 MB | 101.6 MB |
| Events in quadrant A | 2,800,553 | 739,918 |
| Events in quadrant B | 2,877,605 | 740,472 |
| Events in quadrant C | 2,833,952 | 704,985 |
| Events in quadrant D | 6,426,074 | 651,831 |
| Mode M0 | |||
|---|---|---|---|
| Quadrant | BADHDUFLAG | Total packets | Discarded packets |
| A | 0 | 12058 | 1 |
| B | 0 | 12223 | 1 |
| C | 0 | 12141 | 1 |
| D | 0 | 22971 | 1 |
| Mode SS | |||
|---|---|---|---|
| Quadrant | BADHDUFLAG | Total packets | Discarded packets |
| A | 0 | 112 | 0 |
| B | 0 | 112 | 0 |
| C | 0 | 112 | 0 |
| D | 0 | 112 | 0 |
| Mode M9 | |||
|---|---|---|---|
| Quadrant | BADHDUFLAG | Total packets | Discarded packets |
| A | 0 | 12 | 0 |
| B | 0 | 12 | 0 |
| C | 0 | 12 | 0 |
| D | 0 | 12 | 0 |
| Quadrant | Total seconds | Saturated seconds | Saturation percentage |
|---|---|---|---|
| A | 5585 | 66 | 1.181737% |
| B | 5585 | 75 | 1.342883% |
| C | 5585 | 126 | 2.256043% |
| D | 5585 | 604 | 10.814682% |
Noise dominated data is calculated using 1-second bins in cleaned event files. If a bin has >2000 counts, and if more than 50% of those come from <1% of pixels, then it is considered to be noise-dominated and hence unusable.
| Quadrant | # 1 sec bins | Bins with >0 counts | Bins with >2000 counts | High rate bins dominated by noise | Noise dominated (total time) | Noise dominated (detector-on time) | Marked lightcurve |
|---|---|---|---|---|---|---|---|
| A | 6765 | 5585 | 0 | 0 | 0.00% | 0.00% | 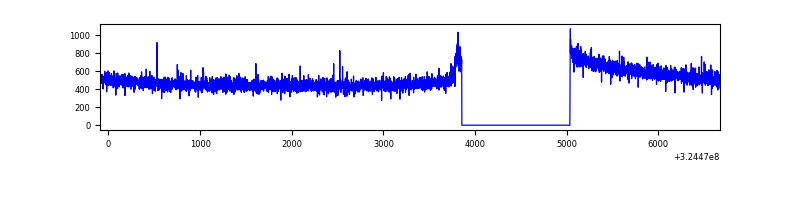 |
| B | 6765 | 5585 | 1 | 1 | 0.01% | 0.02% | 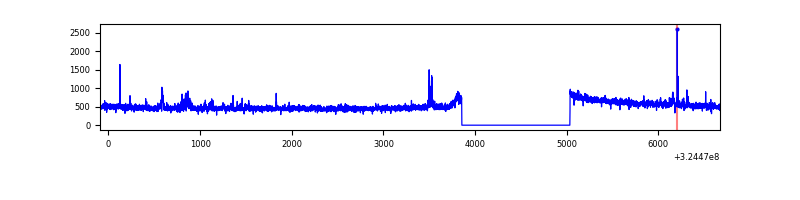 |
| C | 6765 | 5585 | 6 | 6 | 0.09% | 0.11% | 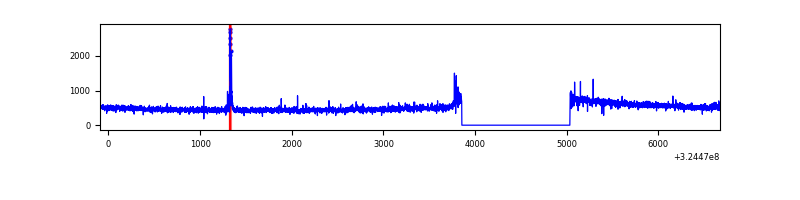 |
| D | 6765 | 5585 | 496 | 496 | 7.33% | 8.88% |  |
Top three noisy pixels from each quadrant. If the there are fewer than three noisy pixels in the level2.evt file, extra rows are filled as -1
| Pixel properties | Quadrant properties | ||||||
|---|---|---|---|---|---|---|---|
| Quadrant | DetID | PixID | Counts | Sigma | Mean | Median | Sigma |
| A | 13 | 254 | 9212 | 59.23 | 726 | 714 | 143.5 |
| A | 0 | 226 | 6278 | 38.78 | 726 | 714 | 143.5 |
| A | 3 | 137 | 6010 | 36.91 | 726 | 714 | 143.5 |
| B | 0 | 190 | 50125 | 368.25 | 714 | 699 | 134.2 |
| B | 12 | 111 | 15324 | 108.96 | 714 | 699 | 134.2 |
| B | 11 | 111 | 13830 | 97.83 | 714 | 699 | 134.2 |
| C | 14 | 238 | 112611 | 723.43 | 678 | 684 | 154.7 |
| C | 2 | 16 | 59156 | 377.93 | 678 | 684 | 154.7 |
| C | 3 | 233 | 8049 | 47.6 | 678 | 684 | 154.7 |
| D | 8 | 195 | 3038387 | 18701.56 | 674 | 655 | 162.4 |
| D | 12 | 218 | 548391 | 3372.09 | 674 | 655 | 162.4 |
| D | 1 | 52 | 203234 | 1247.16 | 674 | 655 | 162.4 |
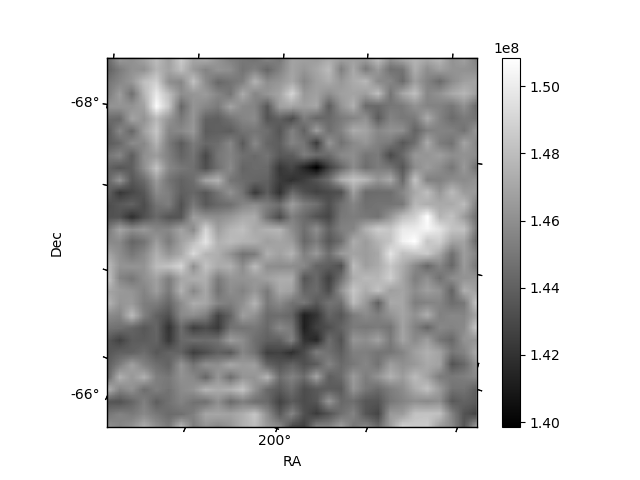
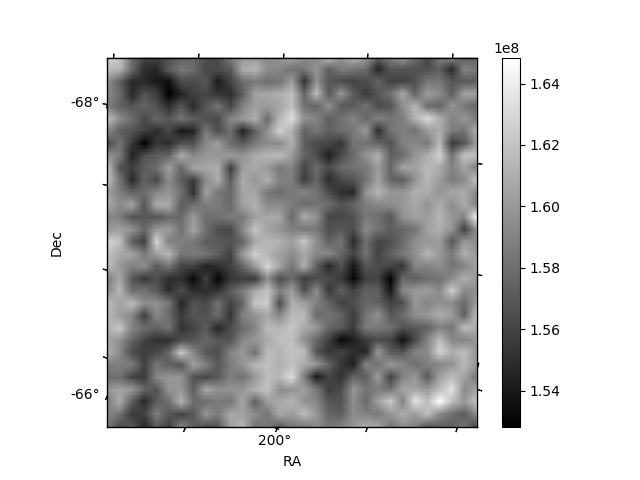
Histogram calculated using DETX and DETY for each event in the final _common_clean file
| Quadrant A |  |
 |
Quadrant B |
|---|---|---|---|
| Quadrant D | 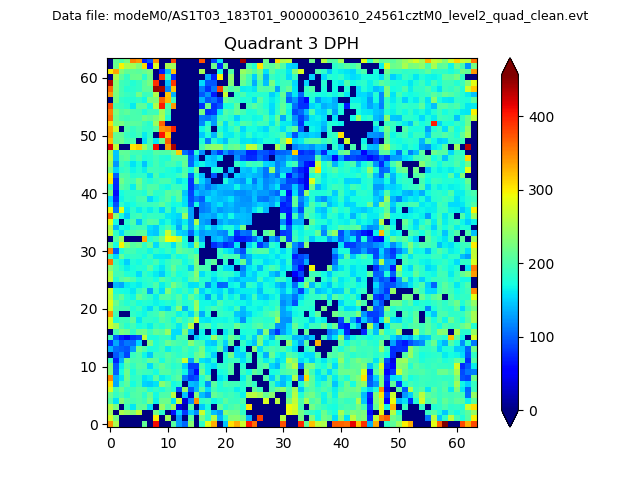 |
 |
Quadrant C |
| Plot type | Count rate plots | Images |
|---|---|---|
| Comparison with Poisson distribution Blue bars denote a histogram of data divided into 1 sec bins. Red curve is a Poisson curve with rate = median count rate of data. |
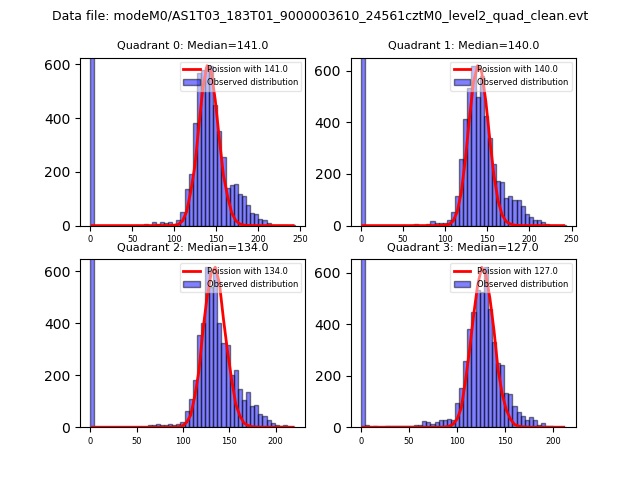 |
 |
| Quadrant-wise count rates Data is divided into 100 sec bins |
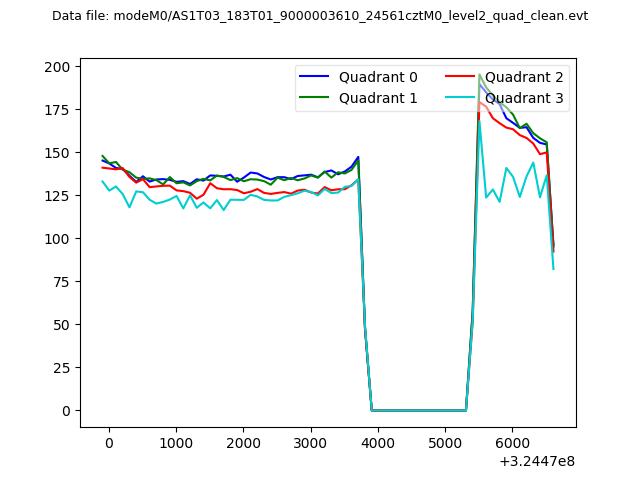 |
|
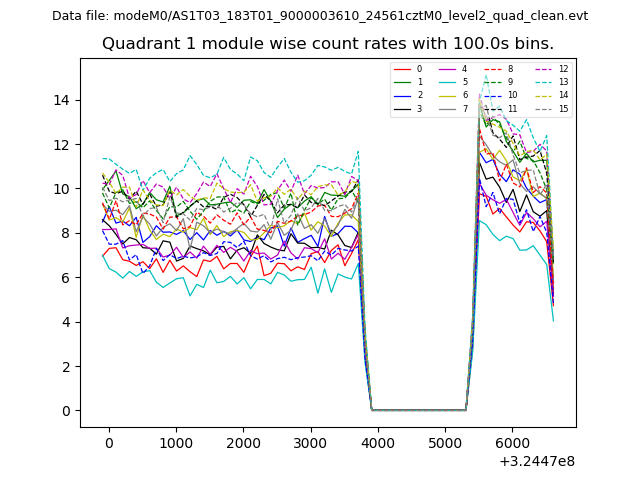
| Module-wise count rates for Quadrant A Data is divided into 100 sec bins |
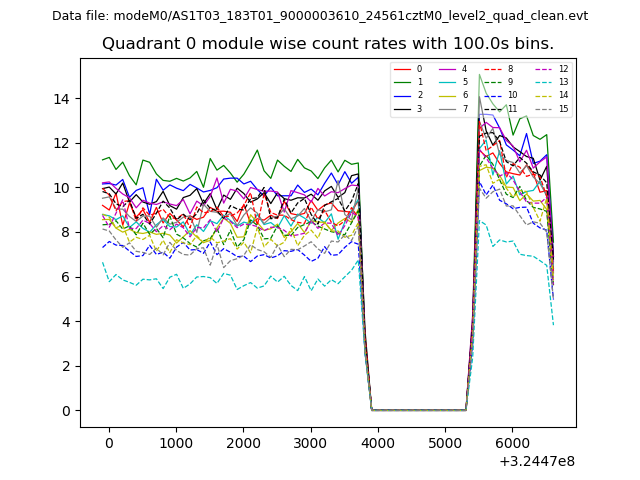 |
 |
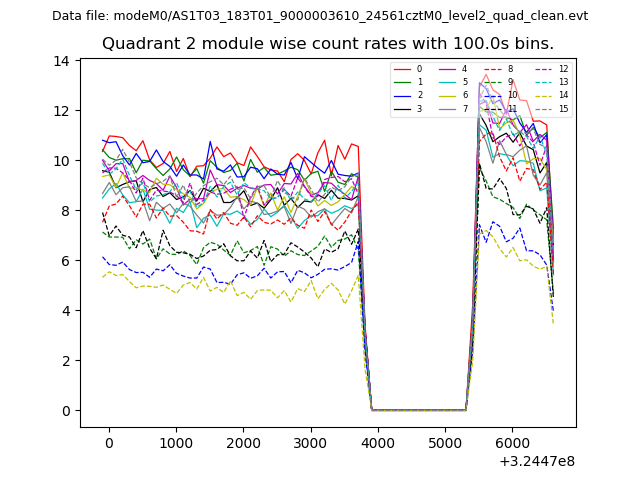
| Module-wise count rates for Quadrant B Data is divided into 100 sec bins |
 |
 |
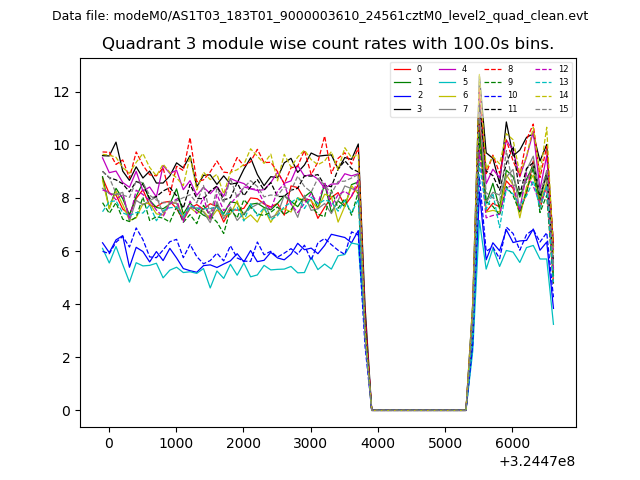
| Module-wise count rates for Quadrant C Data is divided into 100 sec bins |
 |
 |
| Module-wise count rates for Quadrant D Data is divided into 100 sec bins |
 |
 |
| Parameter | Plot |
|---|---|
| CZT HV Monitor | 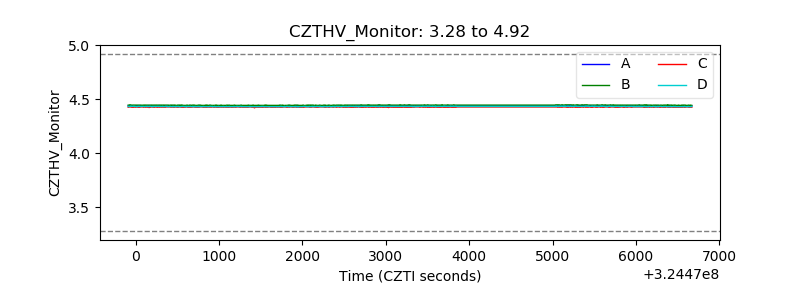 |
| D_VDD | 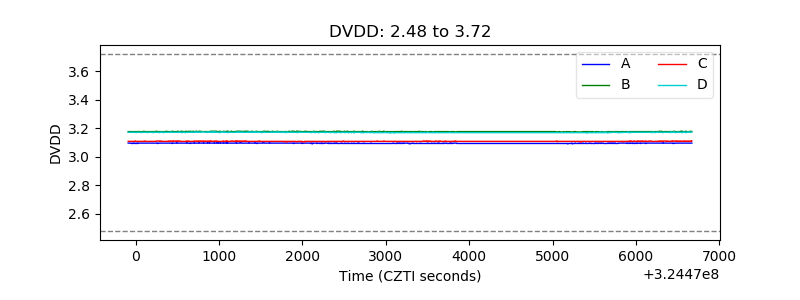 |
| Temperature 1 | 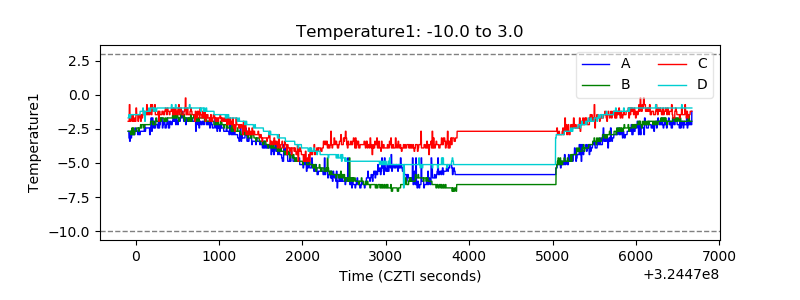 |
| Veto HV Monitor | 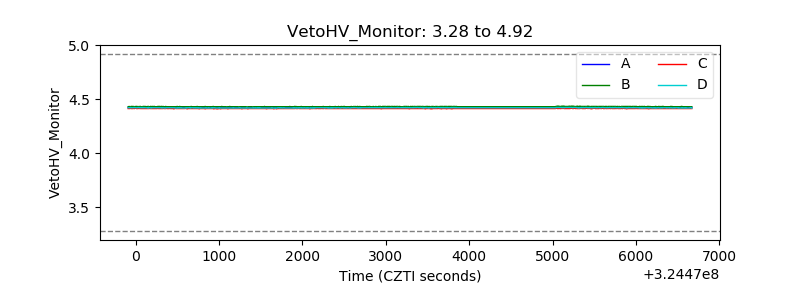 |
| Veto LLD | 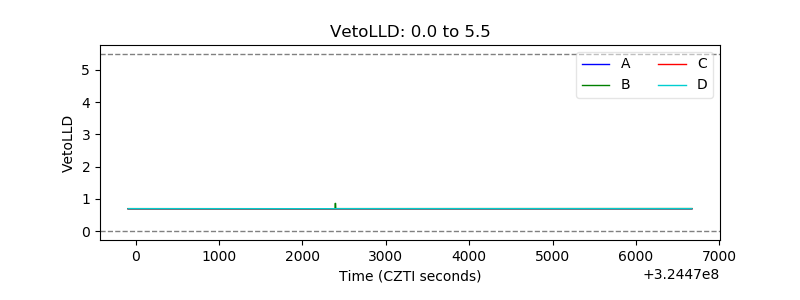 |
| Alpha Counter | 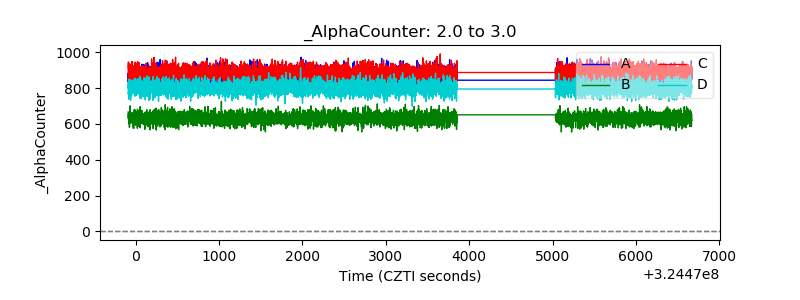 |
| _CPM_Rate | 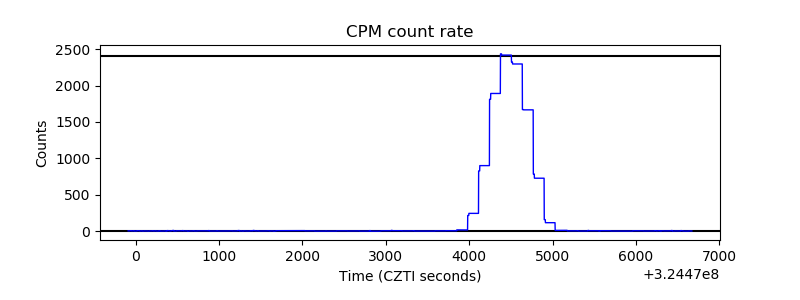 |
| CZT Counter |  |
| +2.5 Volts monitor |  |
| +5 Volts monitor | 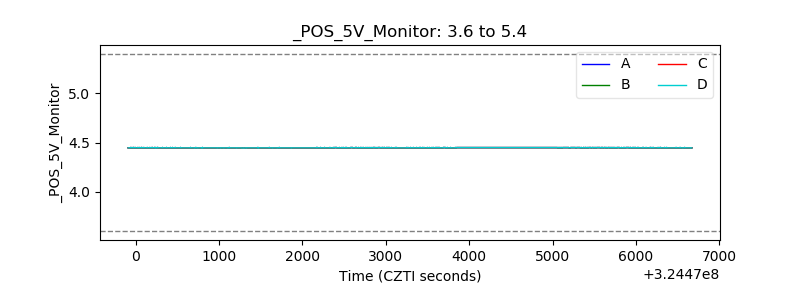 |
| _ROLL_ROT | 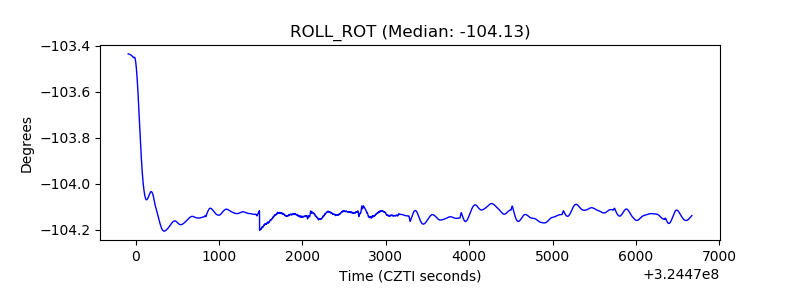 |
| _Roll_DEC | 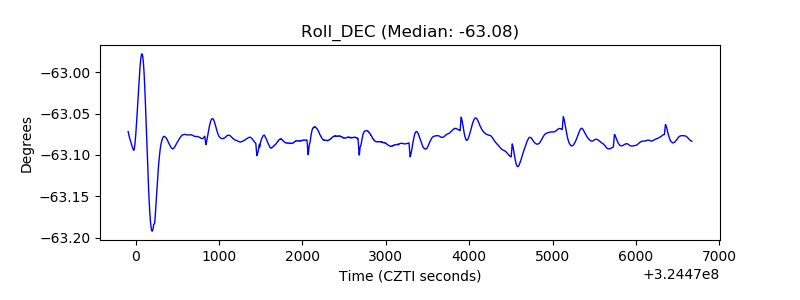 |
| _Roll_RA | 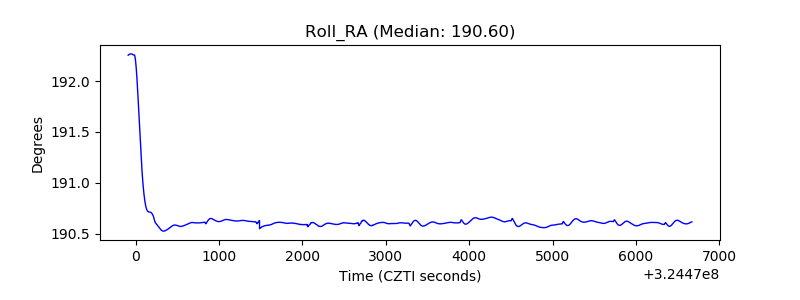 |
| Veto Counter | 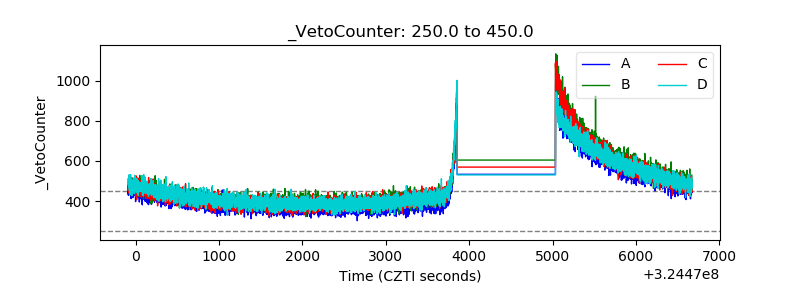 |