| Param | Original file | Final file |
|---|---|---|
| Filename | modeM0/AS1T03_183T01_9000003610_24562cztM0_level2.evt | modeM0/AS1T03_183T01_9000003610_24562cztM0_level2_quad_clean.evt |
| Size (bytes) | 558,149,760 | 129,110,400 |
| Size | 532.3 MB | 123.1 MB |
| Events in quadrant A | 3,069,111 | 926,654 |
| Events in quadrant B | 3,127,308 | 932,158 |
| Events in quadrant C | 3,051,301 | 873,089 |
| Events in quadrant D | 7,260,828 | 770,692 |
| Mode M0 | |||
|---|---|---|---|
| Quadrant | BADHDUFLAG | Total packets | Discarded packets |
| A | 0 | 12862 | 1 |
| B | 0 | 12998 | 2 |
| C | 0 | 12779 | 1 |
| D | 0 | 25602 | 1 |
| Mode SS | |||
|---|---|---|---|
| Quadrant | BADHDUFLAG | Total packets | Discarded packets |
| A | 0 | 120 | 0 |
| B | 0 | 120 | 0 |
| C | 0 | 120 | 0 |
| D | 0 | 120 | 0 |
| Mode M9 | |||
|---|---|---|---|
| Quadrant | BADHDUFLAG | Total packets | Discarded packets |
| A | 0 | 12 | 0 |
| B | 0 | 12 | 0 |
| C | 0 | 12 | 0 |
| D | 0 | 12 | 0 |
| Quadrant | Total seconds | Saturated seconds | Saturation percentage |
|---|---|---|---|
| A | 5829 | 74 | 1.269514% |
| B | 5829 | 83 | 1.423915% |
| C | 5829 | 108 | 1.852805% |
| D | 5829 | 1224 | 20.998456% |
Noise dominated data is calculated using 1-second bins in cleaned event files. If a bin has >2000 counts, and if more than 50% of those come from <1% of pixels, then it is considered to be noise-dominated and hence unusable.
| Quadrant | # 1 sec bins | Bins with >0 counts | Bins with >2000 counts | High rate bins dominated by noise | Noise dominated (total time) | Noise dominated (detector-on time) | Marked lightcurve |
|---|---|---|---|---|---|---|---|
| A | 7104 | 5830 | 0 | 0 | 0.00% | 0.00% |  |
| B | 7104 | 5830 | 2 | 2 | 0.03% | 0.03% |  |
| C | 7104 | 5830 | 0 | 0 | 0.00% | 0.00% |  |
| D | 7104 | 5830 | 901 | 901 | 12.68% | 15.45% | 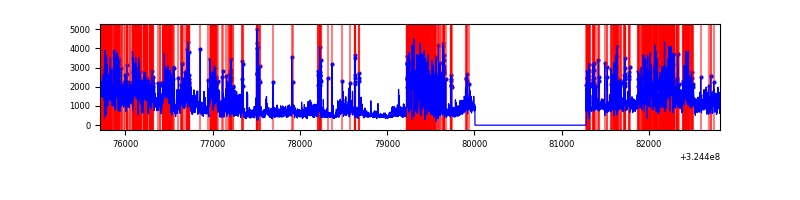 |
Top three noisy pixels from each quadrant. If the there are fewer than three noisy pixels in the level2.evt file, extra rows are filled as -1
| Pixel properties | Quadrant properties | ||||||
|---|---|---|---|---|---|---|---|
| Quadrant | DetID | PixID | Counts | Sigma | Mean | Median | Sigma |
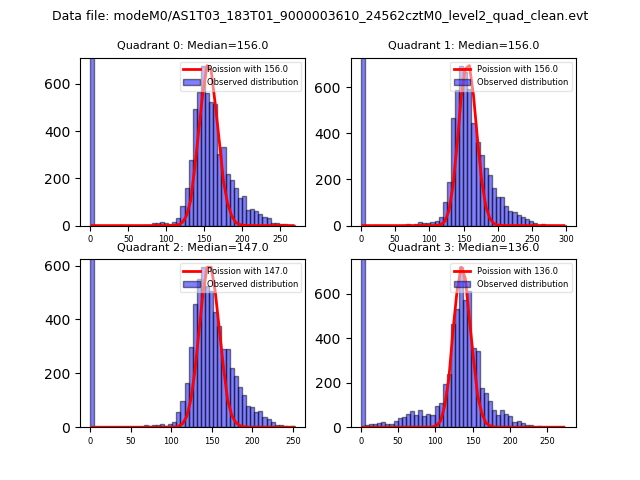
| A | 13 | 254 | 9970 | 58.86 | 795 | 782 | 156.1 |
| A | 0 | 226 | 6980 | 39.71 | 795 | 782 | 156.1 |
| A | 3 | 137 | 6480 | 36.5 | 795 | 782 | 156.1 |
| B | 0 | 190 | 27672 | 185.93 | 782 | 766 | 144.7 |
| B | 3 | 64 | 22456 | 149.89 | 782 | 766 | 144.7 |
| B | 12 | 111 | 16426 | 108.22 | 782 | 766 | 144.7 |
| C | 14 | 238 | 121982 | 725.71 | 740 | 747 | 167.1 |
| C | 2 | 16 | 22402 | 129.63 | 740 | 747 | 167.1 |
| C | 3 | 233 | 13190 | 74.48 | 740 | 747 | 167.1 |
| D | 8 | 195 | 2131347 | 12812.15 | 698 | 679 | 166.3 |
| D | 12 | 218 | 1801124 | 10826.45 | 698 | 679 | 166.3 |
| D | 1 | 52 | 560783 | 3368.02 | 698 | 679 | 166.3 |
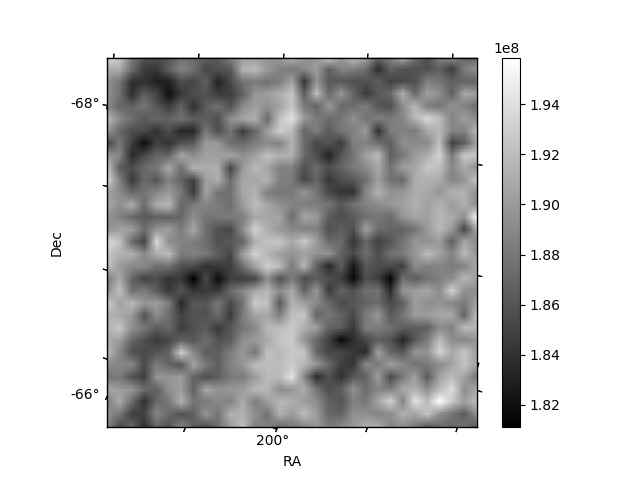
Histogram calculated using DETX and DETY for each event in the final _common_clean file
| Quadrant A | 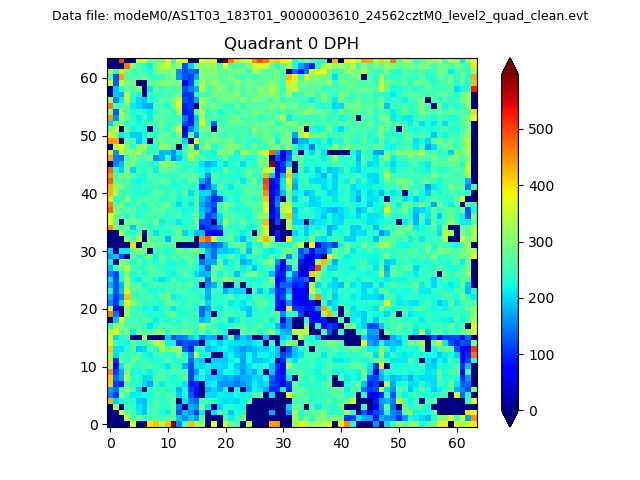 |
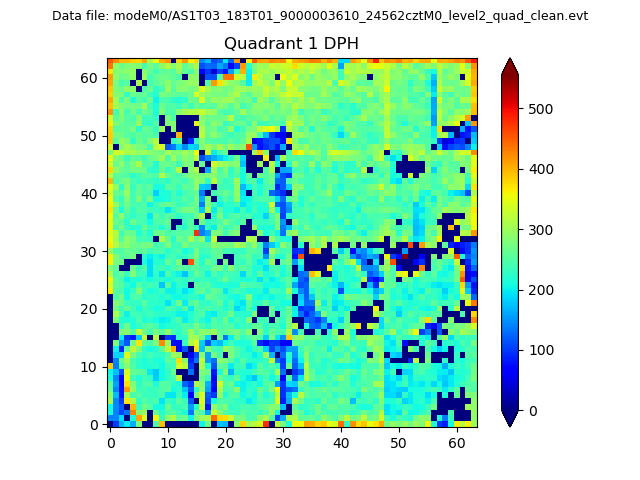 |
Quadrant B |
|---|---|---|---|
| Quadrant D | 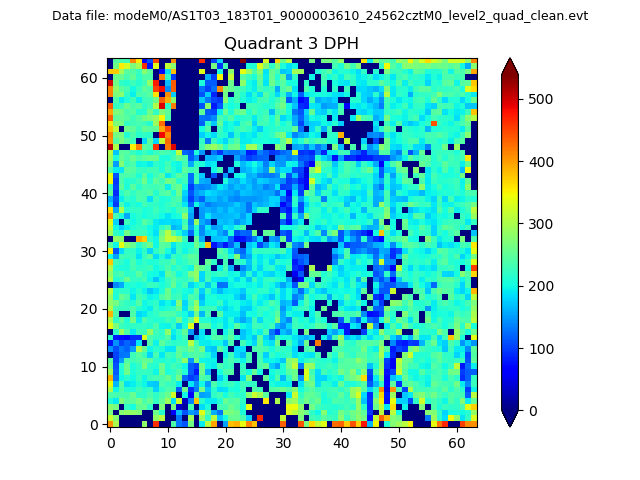 |
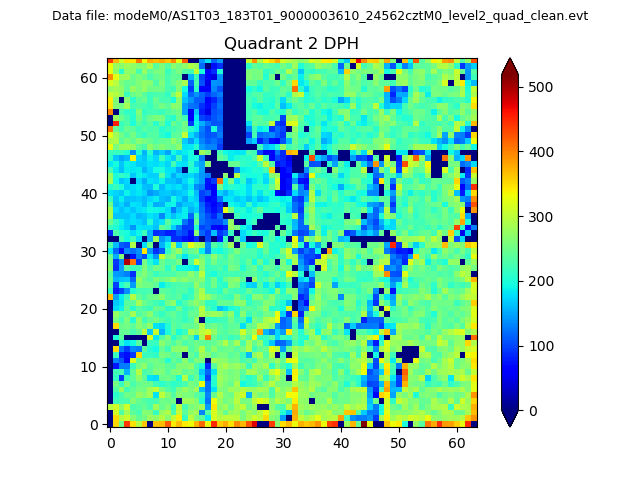 |
Quadrant C |
| Plot type | Count rate plots | Images |
|---|---|---|
| Comparison with Poisson distribution Blue bars denote a histogram of data divided into 1 sec bins. Red curve is a Poisson curve with rate = median count rate of data. |
 |
 |
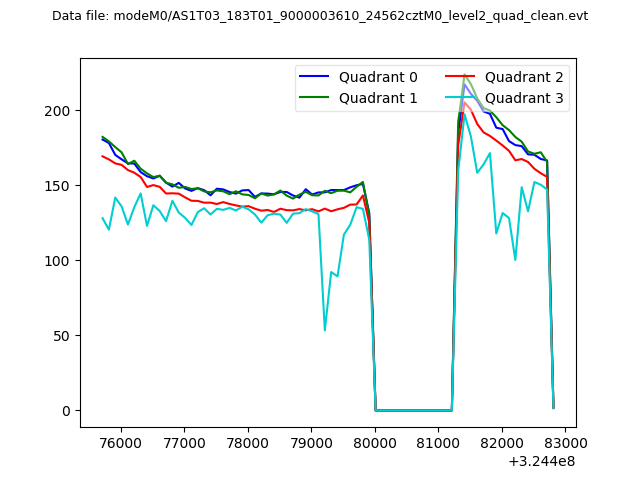
| Quadrant-wise count rates Data is divided into 100 sec bins |
 |
|
| Module-wise count rates for Quadrant A Data is divided into 100 sec bins |
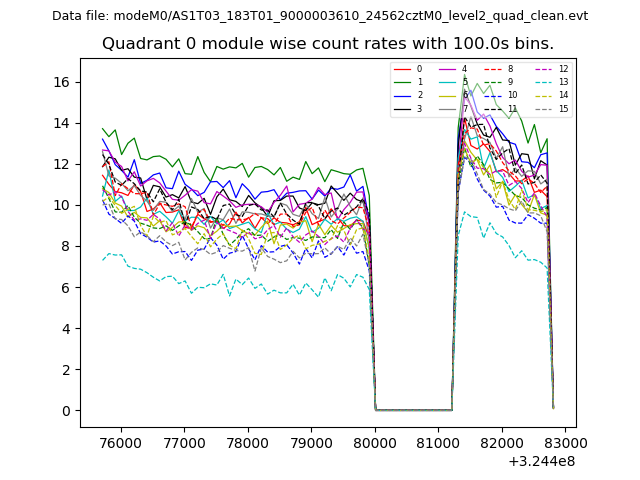 |
 |
| Module-wise count rates for Quadrant B Data is divided into 100 sec bins |
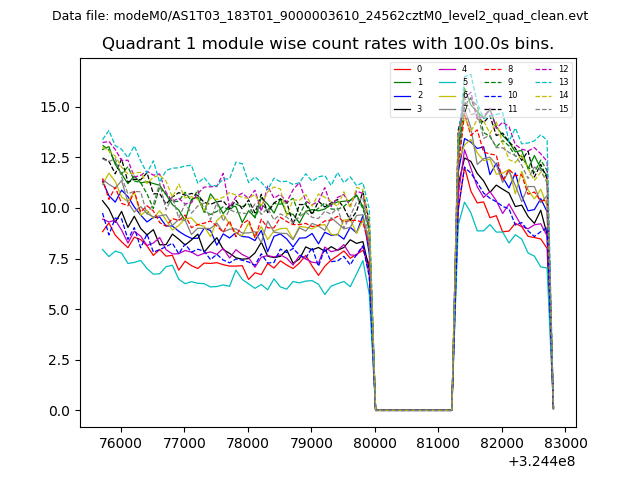 |
 |
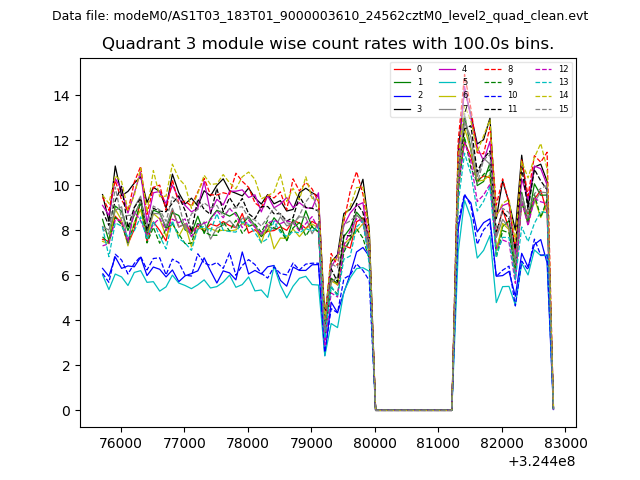
| Module-wise count rates for Quadrant C Data is divided into 100 sec bins |
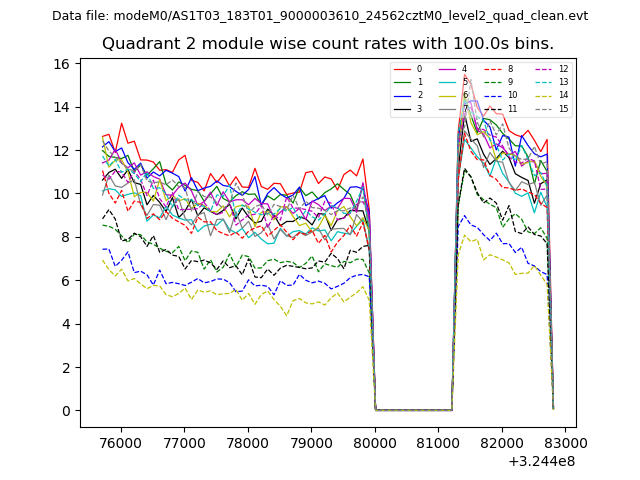 |
 |
| Module-wise count rates for Quadrant D Data is divided into 100 sec bins |
 |
 |
| Parameter | Plot |
|---|---|
| CZT HV Monitor | 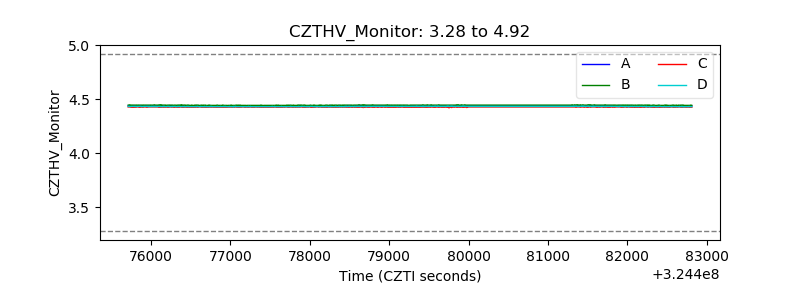 |
| D_VDD | 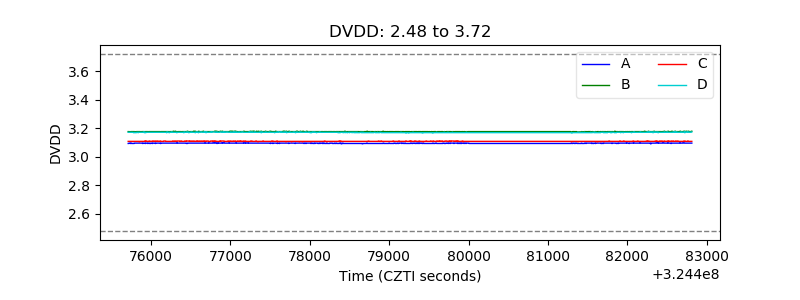 |
| Temperature 1 | 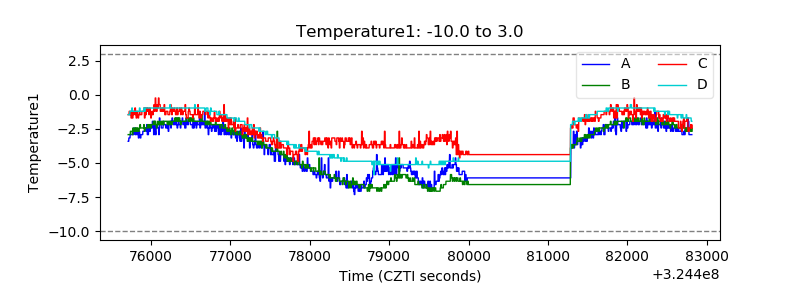 |
| Veto HV Monitor | 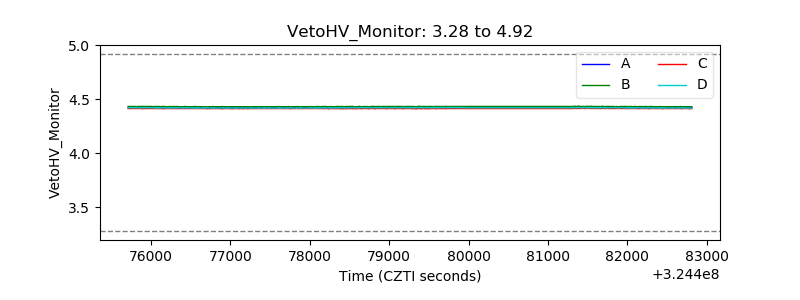 |
| Veto LLD | 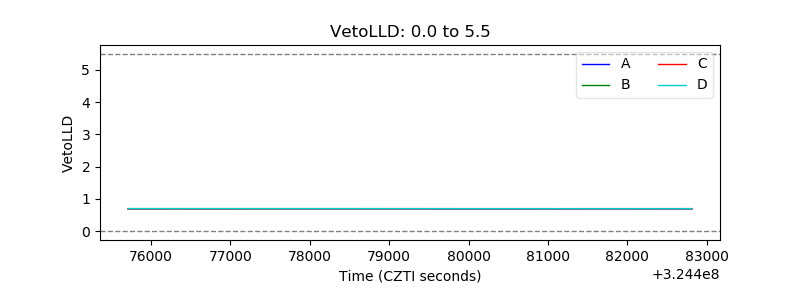 |
| Alpha Counter | 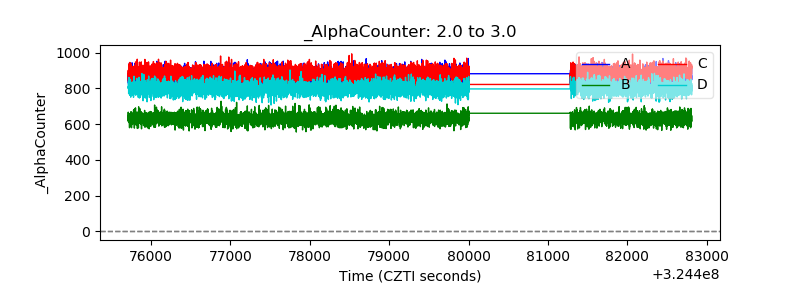 |
| _CPM_Rate | 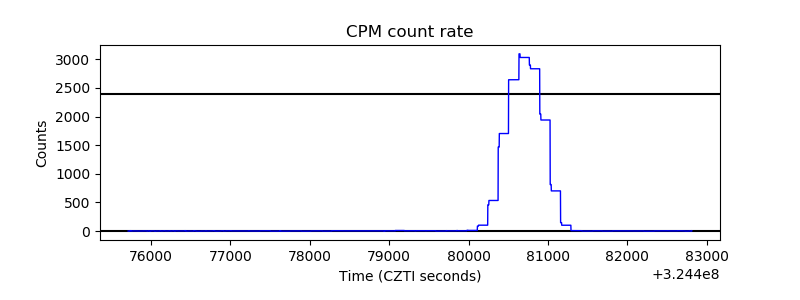 |
| CZT Counter | 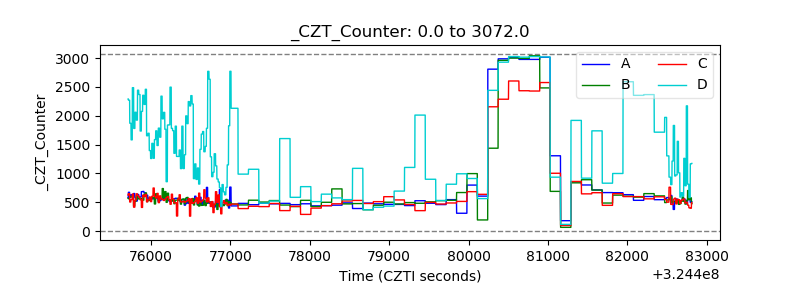 |
| +2.5 Volts monitor |  |
| +5 Volts monitor | 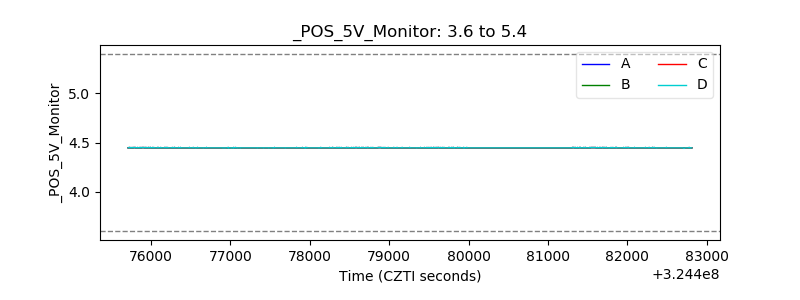 |
| _ROLL_ROT | 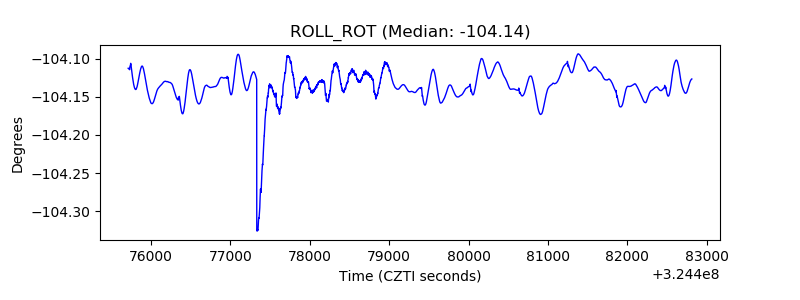 |
| _Roll_DEC | 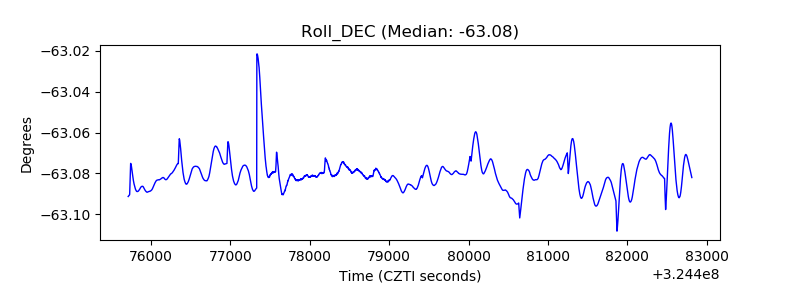 |
| _Roll_RA | 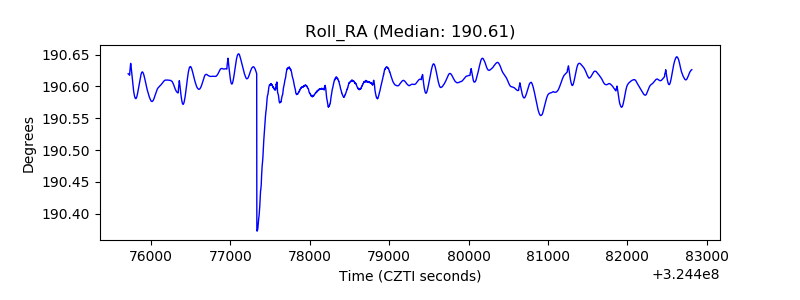 |
| Veto Counter | 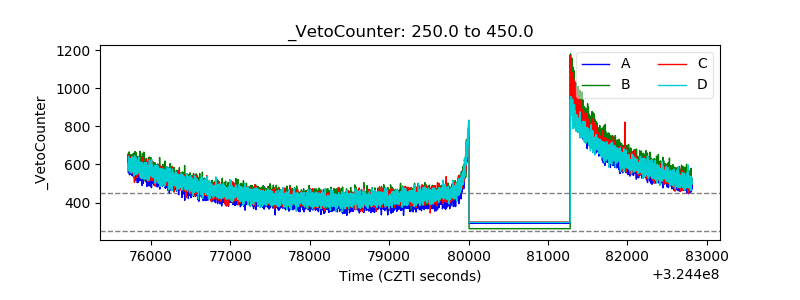 |