| Param | Original file | Final file |
|---|---|---|
| Filename | modeM0/AS1T03_183T01_9000003610_24565cztM0_level2.evt | modeM0/AS1T03_183T01_9000003610_24565cztM0_level2_quad_clean.evt |
| Size (bytes) | 540,256,320 | 113,299,200 |
| Size | 515.2 MB | 108.1 MB |
| Events in quadrant A | 2,922,473 | 790,778 |
| Events in quadrant B | 2,971,383 | 799,197 |
| Events in quadrant C | 4,636,349 | 725,135 |
| Events in quadrant D | 5,427,613 | 699,590 |
| Mode M0 | |||
|---|---|---|---|
| Quadrant | BADHDUFLAG | Total packets | Discarded packets |
| A | 0 | 12405 | 1 |
| B | 0 | 12494 | 1 |
| C | 0 | 17851 | 1 |
| D | 0 | 20360 | 1 |
| Mode SS | |||
|---|---|---|---|
| Quadrant | BADHDUFLAG | Total packets | Discarded packets |
| A | 0 | 120 | 0 |
| B | 0 | 120 | 0 |
| C | 0 | 120 | 0 |
| D | 0 | 120 | 0 |
| Mode M9 | |||
|---|---|---|---|
| Quadrant | BADHDUFLAG | Total packets | Discarded packets |
| A | 0 | 13 | 0 |
| B | 0 | 13 | 0 |
| C | 0 | 13 | 0 |
| D | 0 | 13 | 0 |
| Quadrant | Total seconds | Saturated seconds | Saturation percentage |
|---|---|---|---|
| A | 5969 | 43 | 0.720389% |
| B | 5970 | 65 | 1.088777% |
| C | 5970 | 325 | 5.443886% |
| D | 5970 | 262 | 4.388610% |
Noise dominated data is calculated using 1-second bins in cleaned event files. If a bin has >2000 counts, and if more than 50% of those come from <1% of pixels, then it is considered to be noise-dominated and hence unusable.
| Quadrant | # 1 sec bins | Bins with >0 counts | Bins with >2000 counts | High rate bins dominated by noise | Noise dominated (total time) | Noise dominated (detector-on time) | Marked lightcurve |
|---|---|---|---|---|---|---|---|
| A | 7199 | 5970 | 0 | 0 | 0.00% | 0.00% | 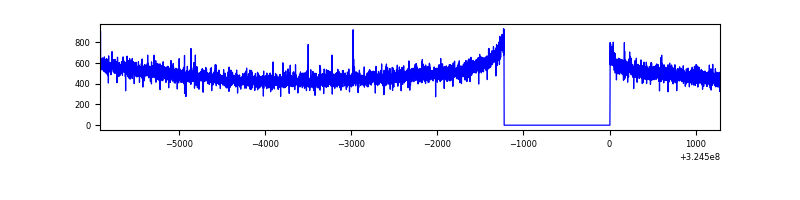 |
| B | 7200 | 5971 | 0 | 0 | 0.00% | 0.00% | 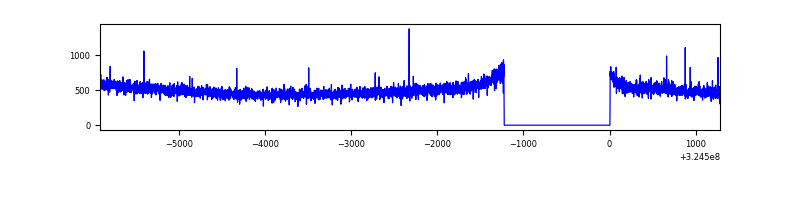 |
| C | 7200 | 5971 | 29 | 29 | 0.40% | 0.49% | 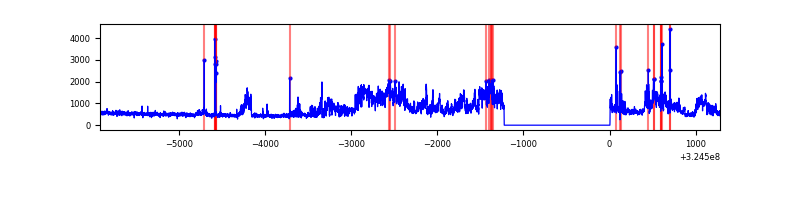 |
| D | 7200 | 5971 | 182 | 182 | 2.53% | 3.05% | 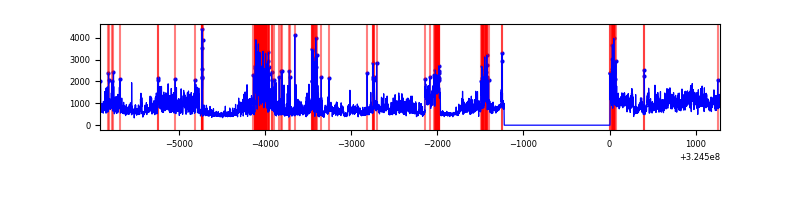 |
Top three noisy pixels from each quadrant. If the there are fewer than three noisy pixels in the level2.evt file, extra rows are filled as -1
| Pixel properties | Quadrant properties | ||||||
|---|---|---|---|---|---|---|---|
| Quadrant | DetID | PixID | Counts | Sigma | Mean | Median | Sigma |
| A | 13 | 254 | 9680 | 59.4 | 756 | 742 | 150.5 |
| A | 3 | 137 | 6521 | 38.4 | 756 | 742 | 150.5 |
| A | 0 | 226 | 6468 | 38.05 | 756 | 742 | 150.5 |
| B | 12 | 111 | 16465 | 111.78 | 755 | 739 | 140.7 |
| B | 11 | 111 | 14514 | 97.91 | 755 | 739 | 140.7 |
| B | 14 | 111 | 13025 | 87.33 | 755 | 739 | 140.7 |
| C | 7 | 247 | 1570332 | 9735.06 | 703 | 710 | 161.2 |
| C | 0 | 239 | 119902 | 739.25 | 703 | 710 | 161.2 |
| C | 14 | 238 | 113185 | 697.59 | 703 | 710 | 161.2 |
| D | 8 | 195 | 1847416 | 10901.44 | 706 | 687 | 169.4 |
| D | 12 | 218 | 537940 | 3171.46 | 706 | 687 | 169.4 |
| D | 1 | 255 | 244599 | 1439.84 | 706 | 687 | 169.4 |
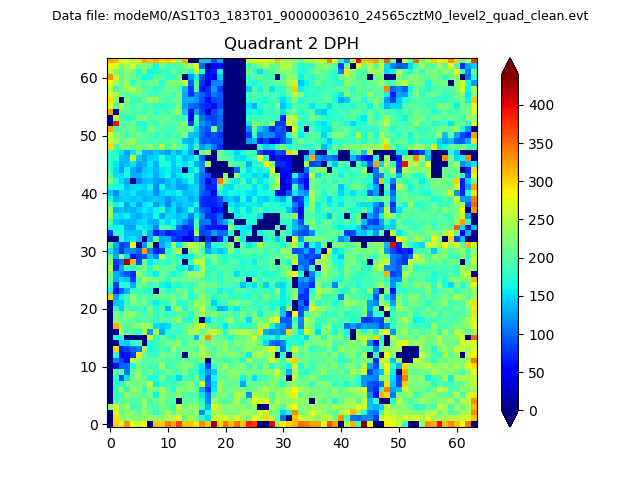
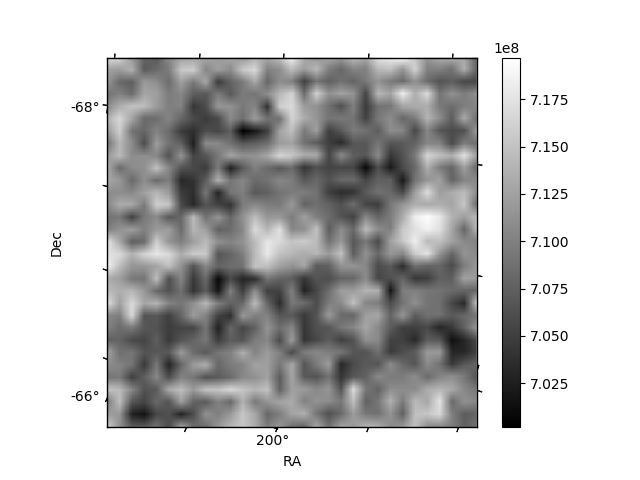
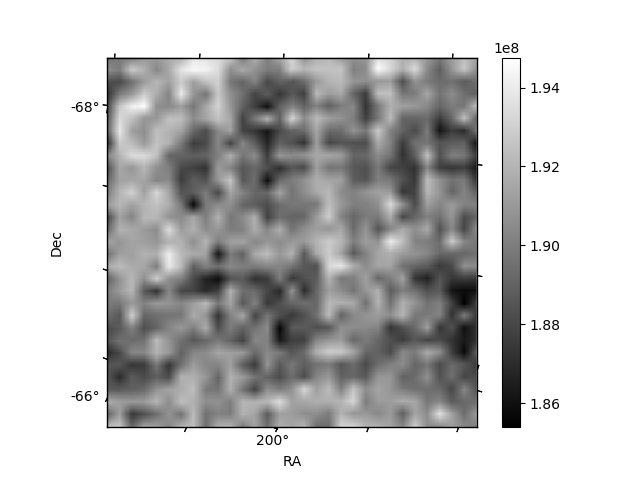
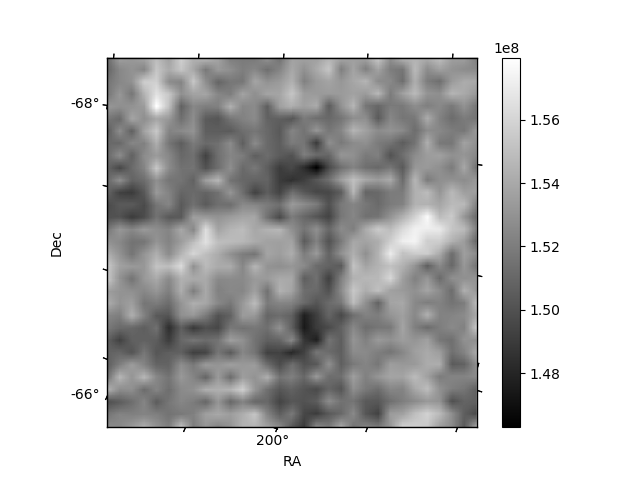
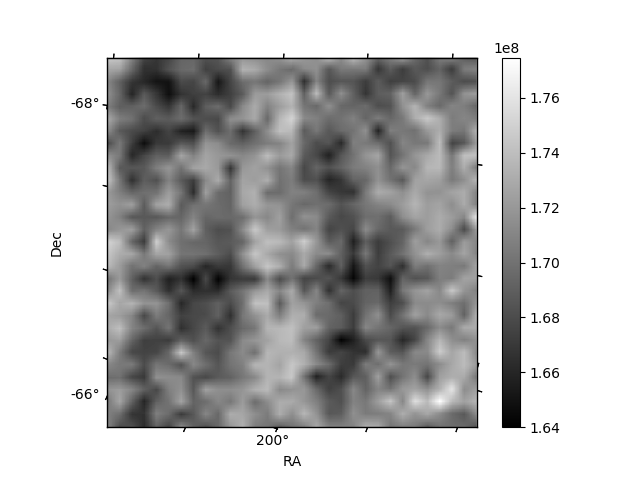
Histogram calculated using DETX and DETY for each event in the final _common_clean file
| Quadrant A | 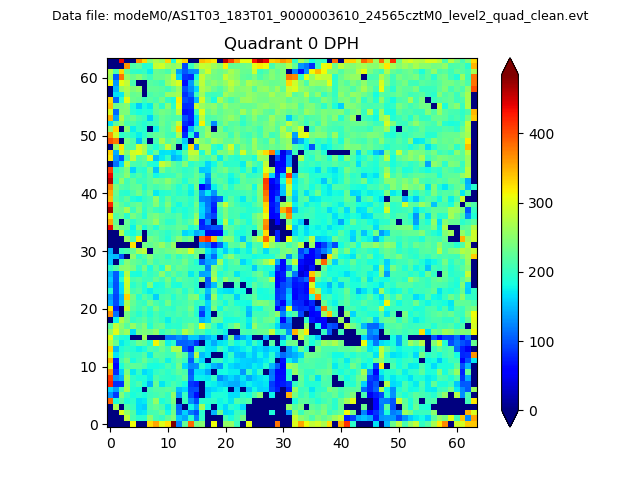 |
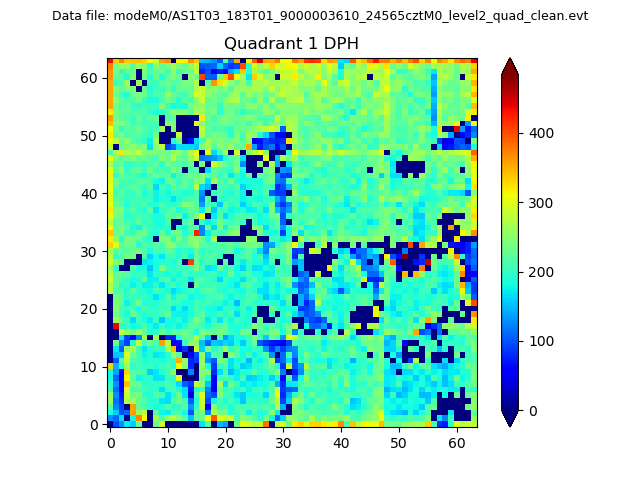 |
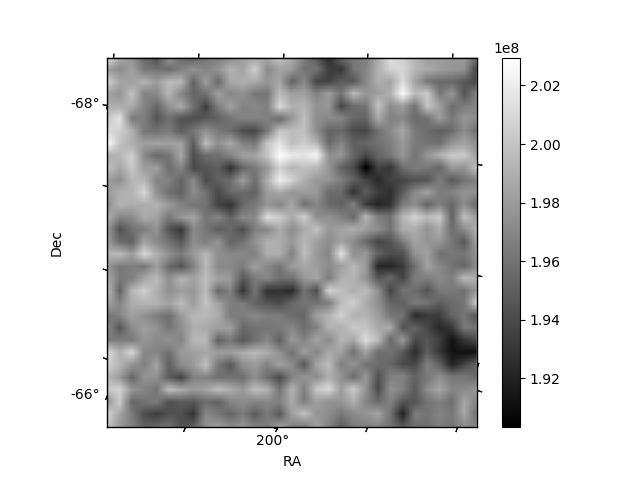
Quadrant B |
|---|---|---|---|
| Quadrant D | 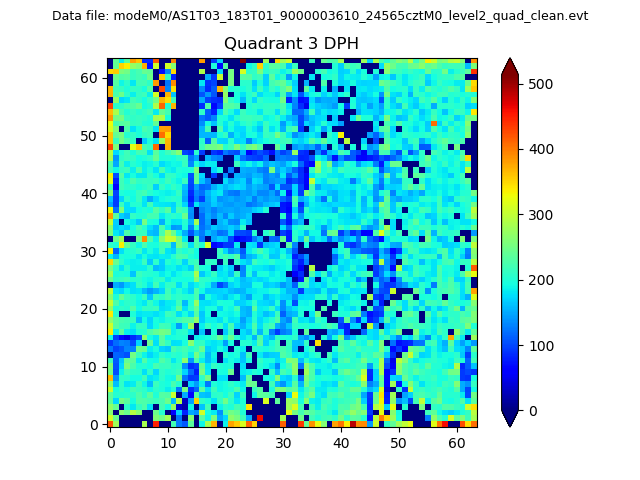 |
 |
Quadrant C |
| Plot type | Count rate plots | Images |
|---|---|---|
| Comparison with Poisson distribution Blue bars denote a histogram of data divided into 1 sec bins. Red curve is a Poisson curve with rate = median count rate of data. |
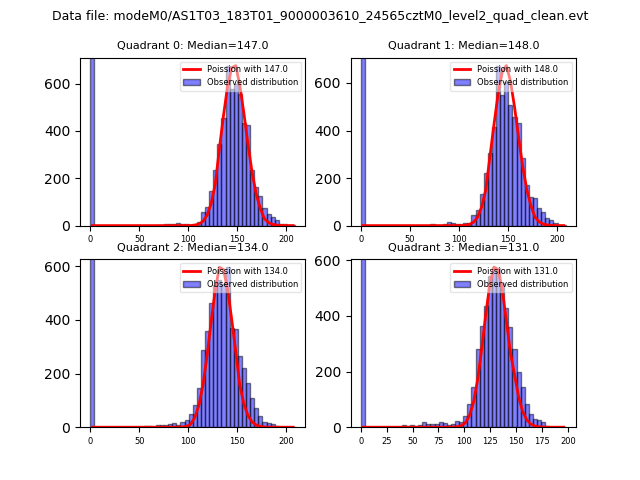 |
 |
| Quadrant-wise count rates Data is divided into 100 sec bins |
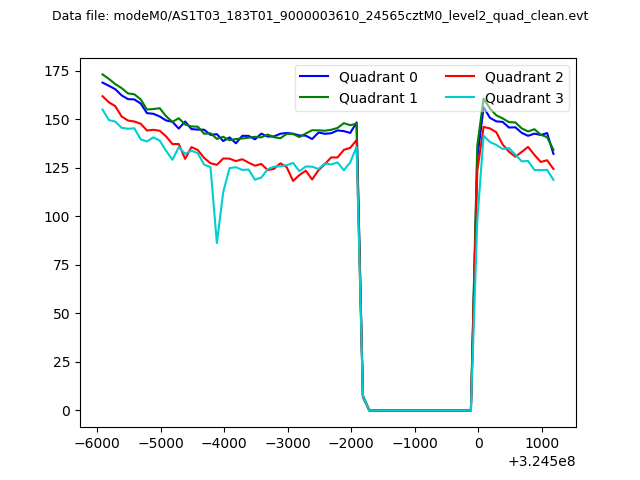 |
|
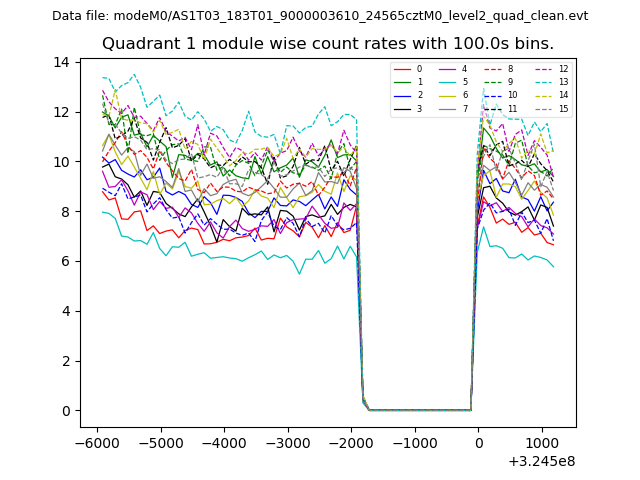
| Module-wise count rates for Quadrant A Data is divided into 100 sec bins |
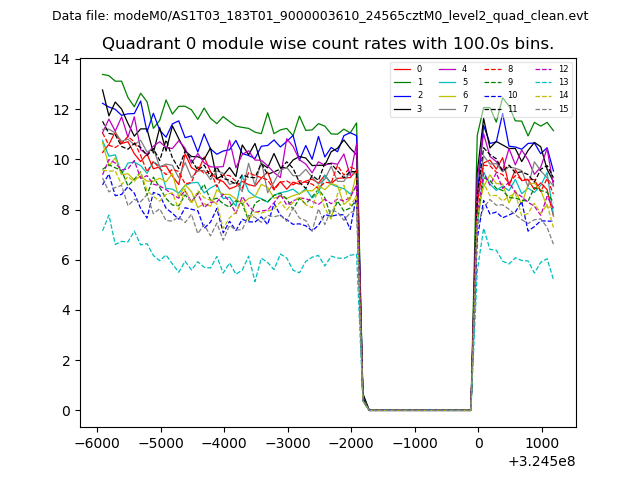 |
 |
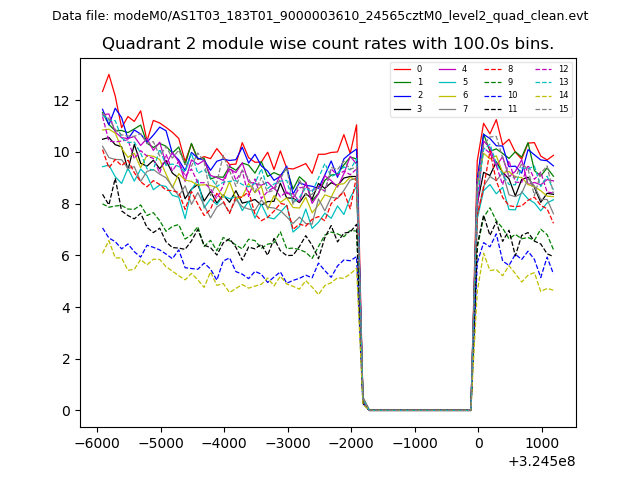
| Module-wise count rates for Quadrant B Data is divided into 100 sec bins |
 |
 |
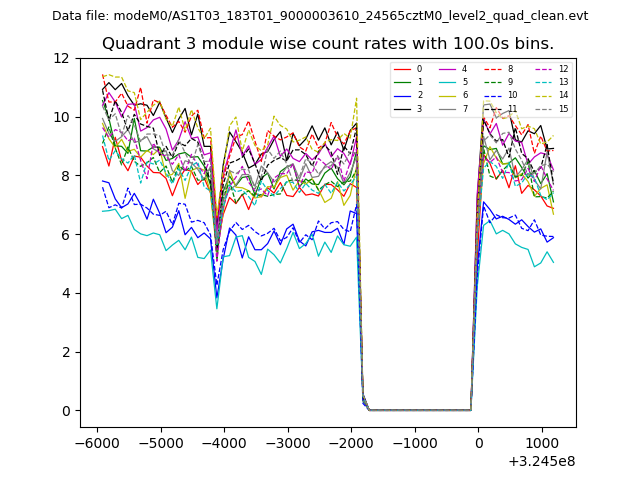
| Module-wise count rates for Quadrant C Data is divided into 100 sec bins |
 |
 |
| Module-wise count rates for Quadrant D Data is divided into 100 sec bins |
 |
 |
| Parameter | Plot |
|---|---|
| CZT HV Monitor | 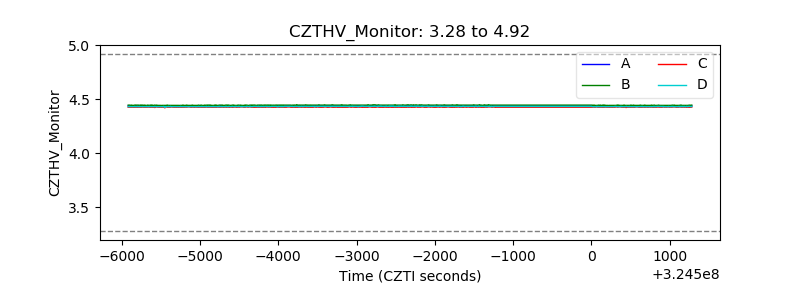 |
| D_VDD | 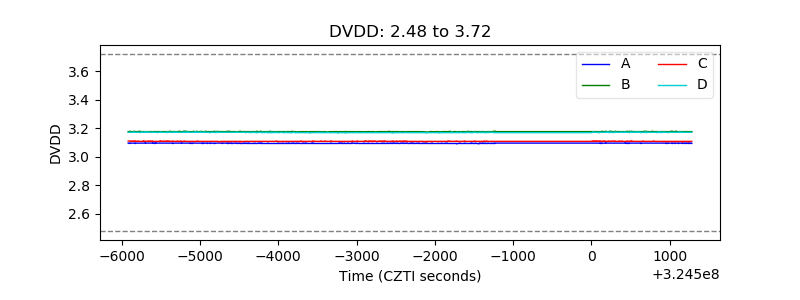 |
| Temperature 1 | 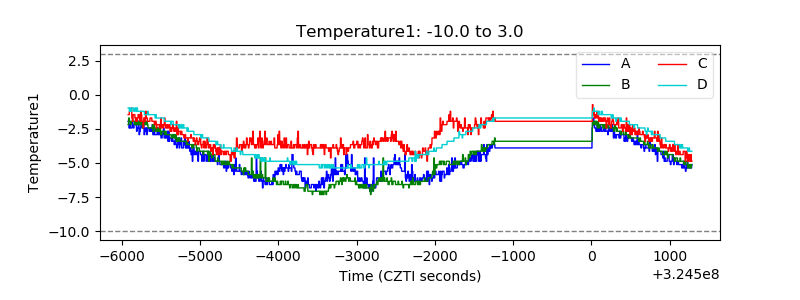 |
| Veto HV Monitor | 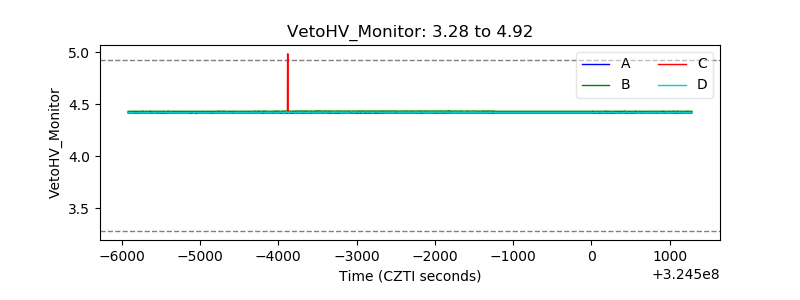 |
| Veto LLD | 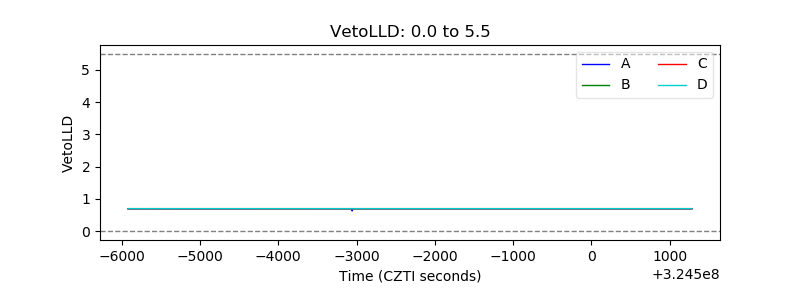 |
| Alpha Counter | 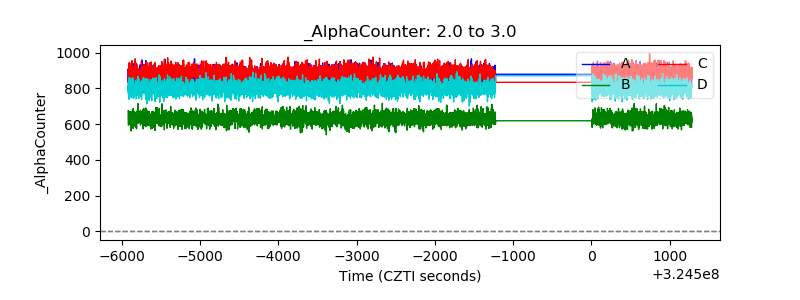 |
| _CPM_Rate | 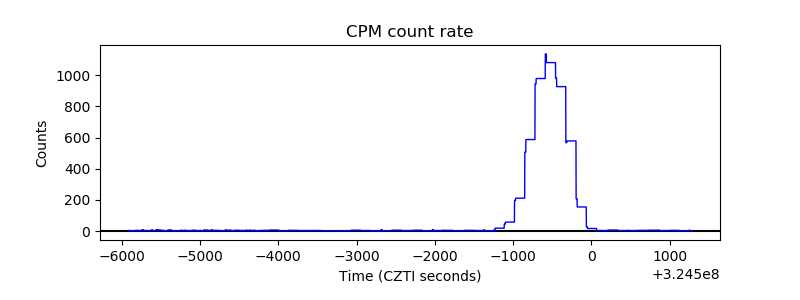 |
| CZT Counter | 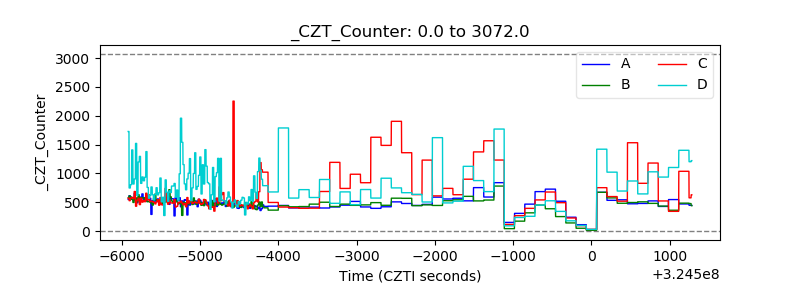 |
| +2.5 Volts monitor |  |
| +5 Volts monitor |  |
| _ROLL_ROT | 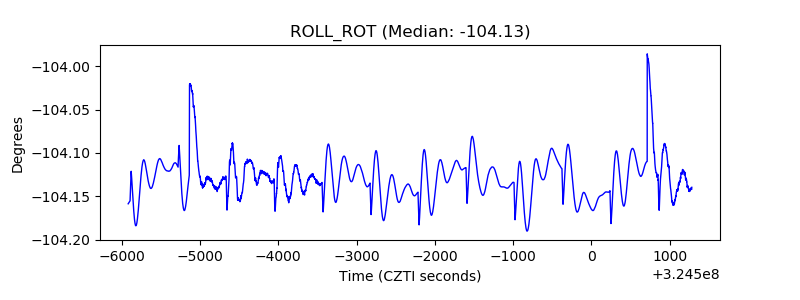 |
| _Roll_DEC | 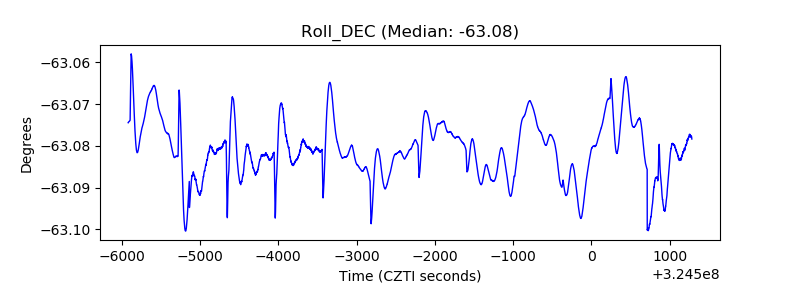 |
| _Roll_RA | 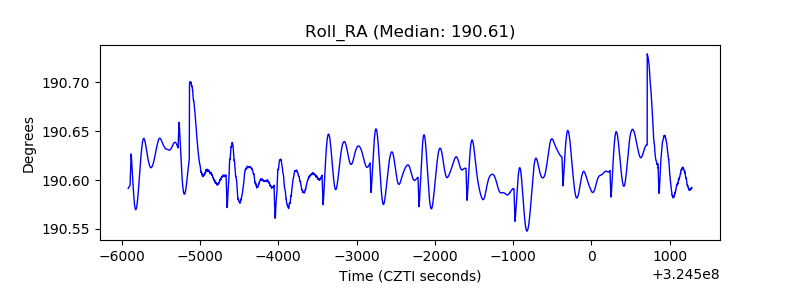 |
| Veto Counter | 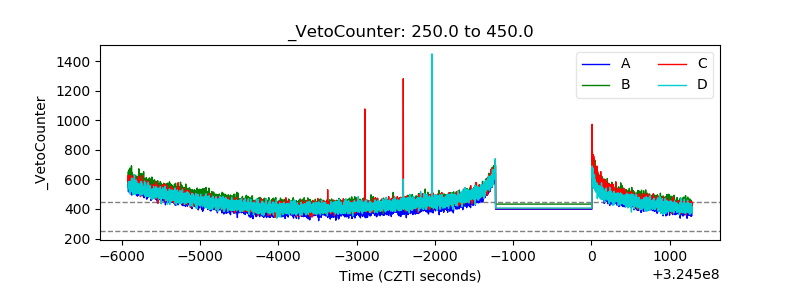 |