| Param | Original file | Final file |
|---|---|---|
| Filename | modeM0/AS1T03_183T01_9000003610_24566cztM0_level2.evt | modeM0/AS1T03_183T01_9000003610_24566cztM0_level2_quad_clean.evt |
| Size (bytes) | 636,955,200 | 119,324,160 |
| Size | 607.4 MB | 113.8 MB |
| Events in quadrant A | 3,136,679 | 826,404 |
| Events in quadrant B | 3,235,718 | 835,906 |
| Events in quadrant C | 4,170,604 | 769,554 |
| Events in quadrant D | 8,296,368 | 716,734 |
| Mode M0 | |||
|---|---|---|---|
| Quadrant | BADHDUFLAG | Total packets | Discarded packets |
| A | 0 | 13675 | 3 |
| B | 0 | 13870 | 2 |
| C | 0 | 17021 | 2 |
| D | 0 | 29347 | 2 |
| Mode SS | |||
|---|---|---|---|
| Quadrant | BADHDUFLAG | Total packets | Discarded packets |
| A | 0 | 136 | 0 |
| B | 0 | 136 | 0 |
| C | 0 | 136 | 0 |
| D | 0 | 136 | 0 |
| Mode M9 | |||
|---|---|---|---|
| Quadrant | BADHDUFLAG | Total packets | Discarded packets |
| A | 0 | 9 | 0 |
| B | 0 | 9 | 0 |
| C | 0 | 9 | 0 |
| D | 0 | 9 | 0 |
| Quadrant | Total seconds | Saturated seconds | Saturation percentage |
|---|---|---|---|
| A | 6670 | 29 | 0.434783% |
| B | 6670 | 46 | 0.689655% |
| C | 6670 | 186 | 2.788606% |
| D | 6670 | 668 | 10.014993% |
Noise dominated data is calculated using 1-second bins in cleaned event files. If a bin has >2000 counts, and if more than 50% of those come from <1% of pixels, then it is considered to be noise-dominated and hence unusable.
| Quadrant | # 1 sec bins | Bins with >0 counts | Bins with >2000 counts | High rate bins dominated by noise | Noise dominated (total time) | Noise dominated (detector-on time) | Marked lightcurve |
|---|---|---|---|---|---|---|---|
| A | 7590 | 6671 | 0 | 0 | 0.00% | 0.00% | 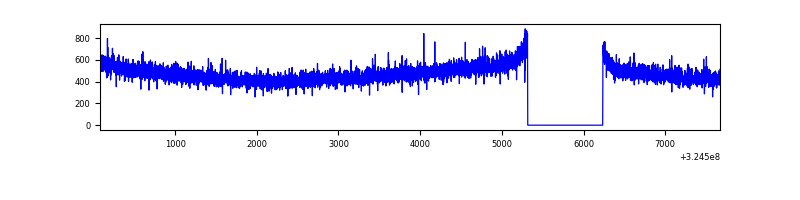 |
| B | 7590 | 6671 | 3 | 3 | 0.04% | 0.04% | 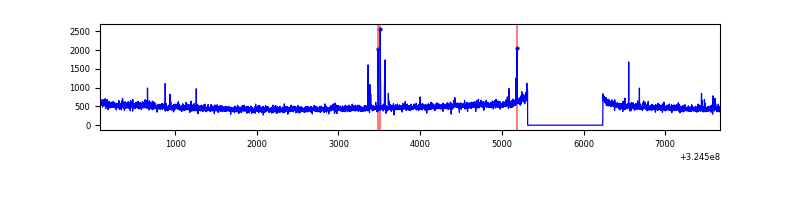 |
| C | 7590 | 6671 | 18 | 18 | 0.24% | 0.27% | 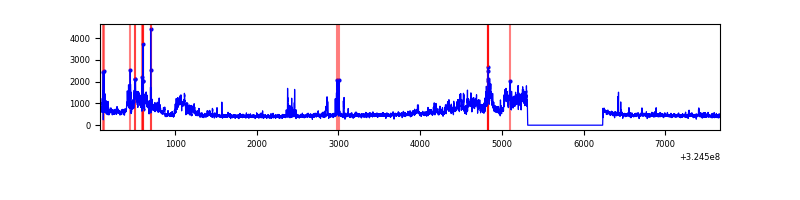 |
| D | 7590 | 6671 | 719 | 719 | 9.47% | 10.78% | 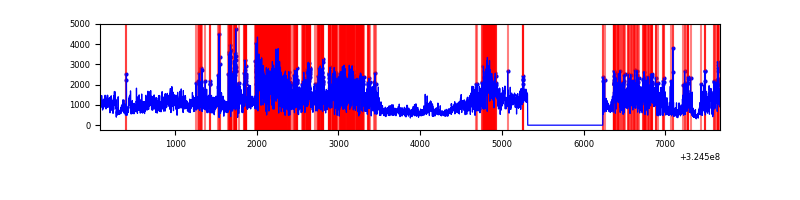 |
Top three noisy pixels from each quadrant. If the there are fewer than three noisy pixels in the level2.evt file, extra rows are filled as -1
| Pixel properties | Quadrant properties | ||||||
|---|---|---|---|---|---|---|---|
| Quadrant | DetID | PixID | Counts | Sigma | Mean | Median | Sigma |
| A | 13 | 254 | 10755 | 61.11 | 813 | 797 | 162.9 |
| A | 3 | 137 | 7282 | 39.8 | 813 | 797 | 162.9 |
| A | 0 | 226 | 7023 | 38.21 | 813 | 797 | 162.9 |
| B | 12 | 17 | 38195 | 243.75 | 811 | 793 | 153.4 |
| B | 12 | 111 | 18186 | 113.35 | 811 | 793 | 153.4 |
| B | 11 | 111 | 15841 | 98.07 | 811 | 793 | 153.4 |
| C | 7 | 247 | 846811 | 4800.12 | 765 | 772 | 176.3 |
| C | 0 | 239 | 124603 | 702.57 | 765 | 772 | 176.3 |
| C | 14 | 238 | 124524 | 702.12 | 765 | 772 | 176.3 |
| D | 8 | 195 | 3215431 | 17528.06 | 755 | 734 | 183.4 |
| D | 1 | 52 | 1613758 | 8794.98 | 755 | 734 | 183.4 |
| D | 12 | 218 | 328220 | 1785.61 | 755 | 734 | 183.4 |
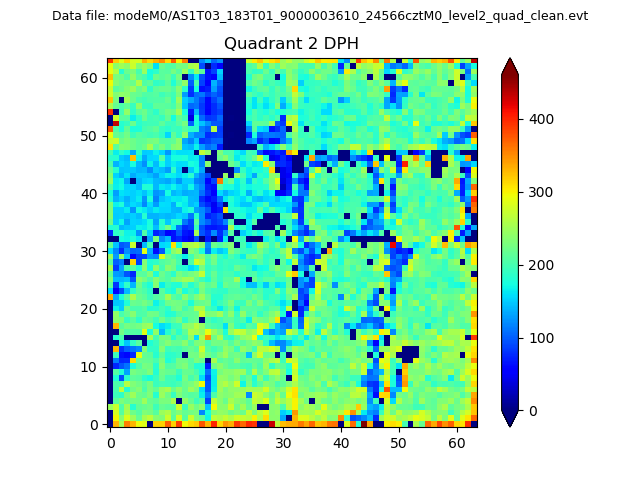
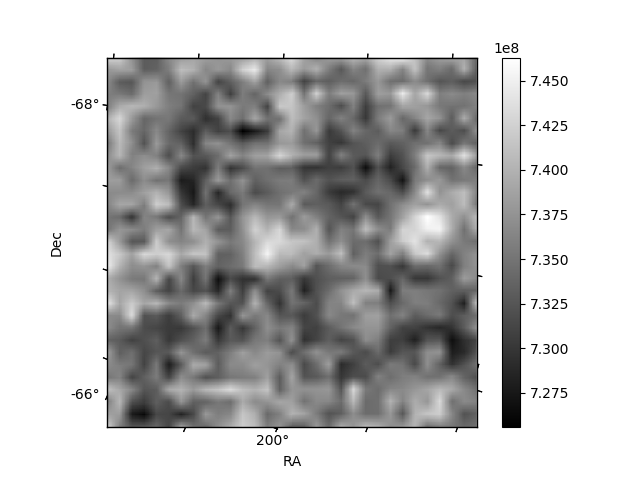
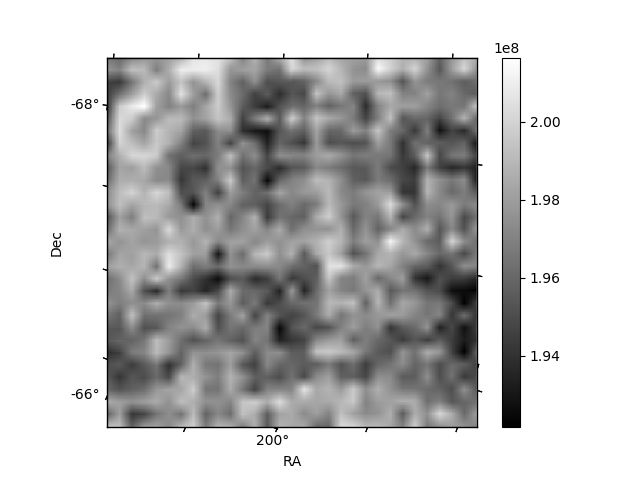
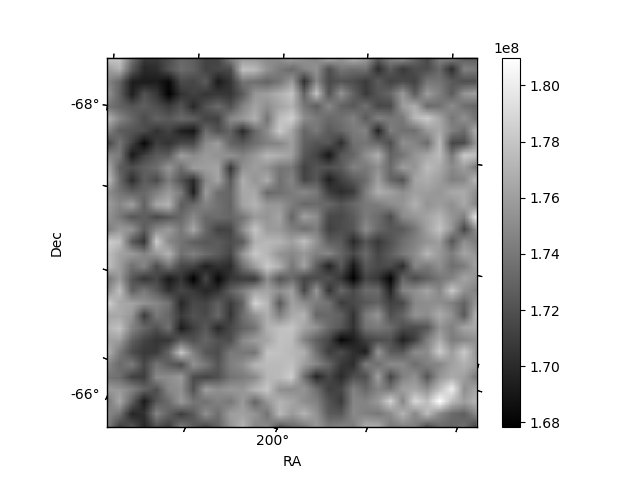
Histogram calculated using DETX and DETY for each event in the final _common_clean file
| Quadrant A | 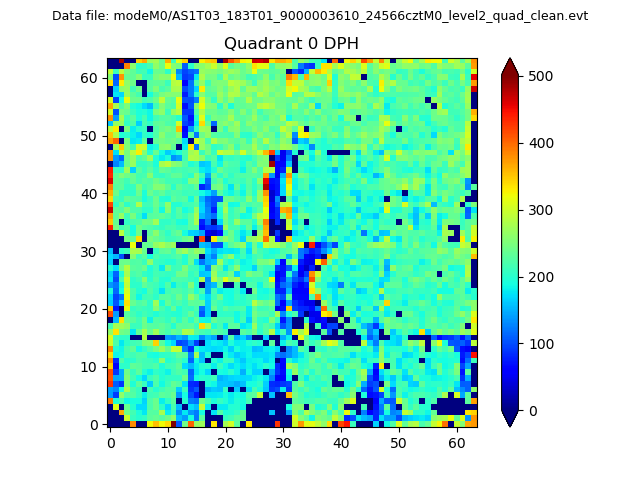 |
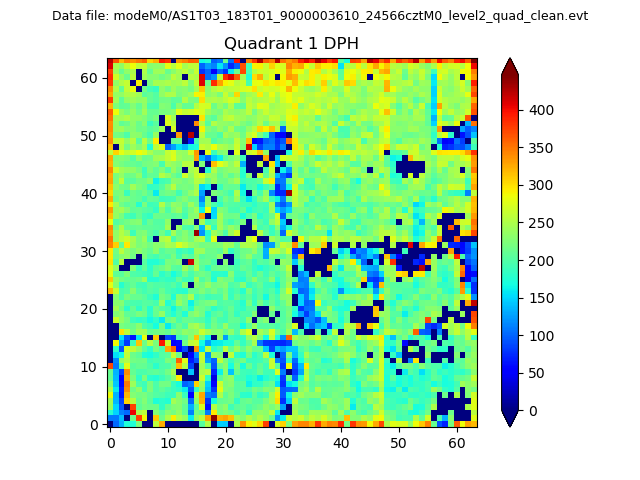 |
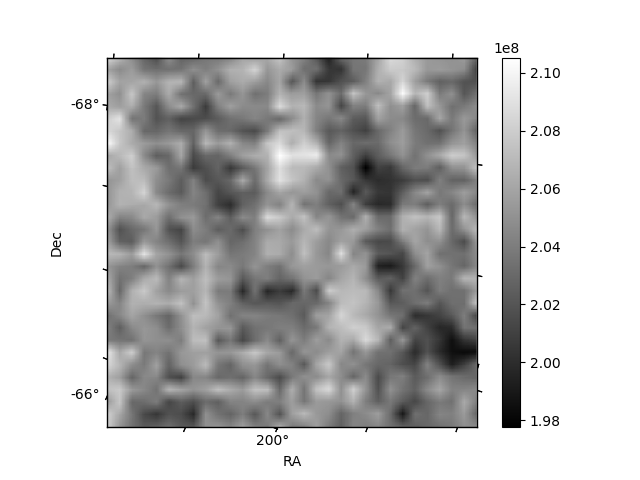
Quadrant B |
|---|---|---|---|
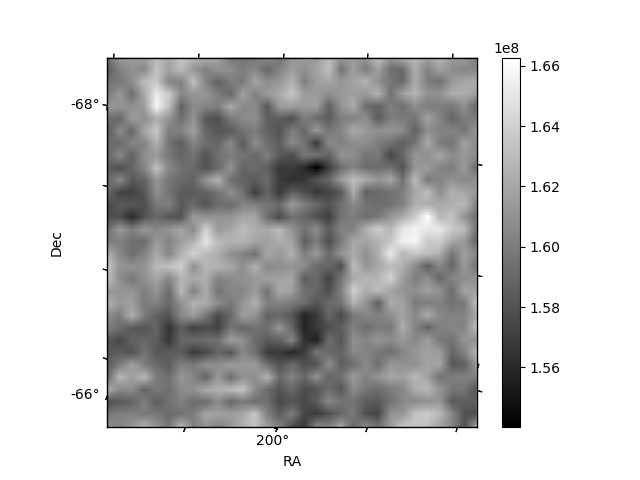
| Quadrant D | 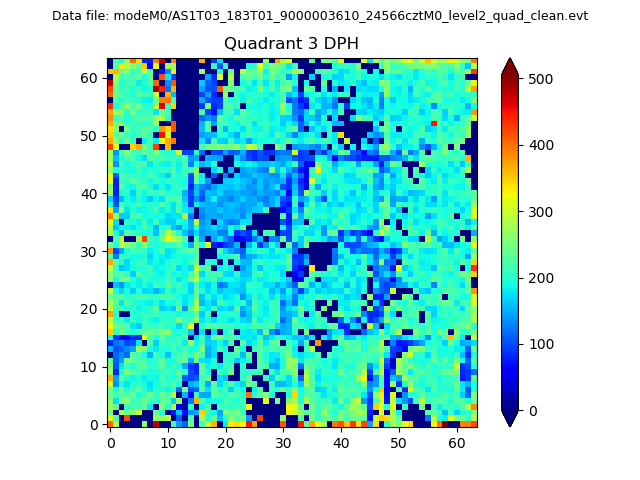 |
 |
Quadrant C |
| Plot type | Count rate plots | Images |
|---|---|---|
| Comparison with Poisson distribution Blue bars denote a histogram of data divided into 1 sec bins. Red curve is a Poisson curve with rate = median count rate of data. |
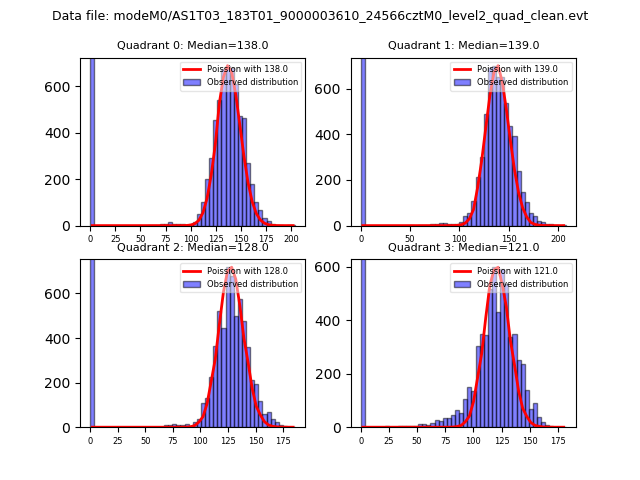 |
 |
| Quadrant-wise count rates Data is divided into 100 sec bins |
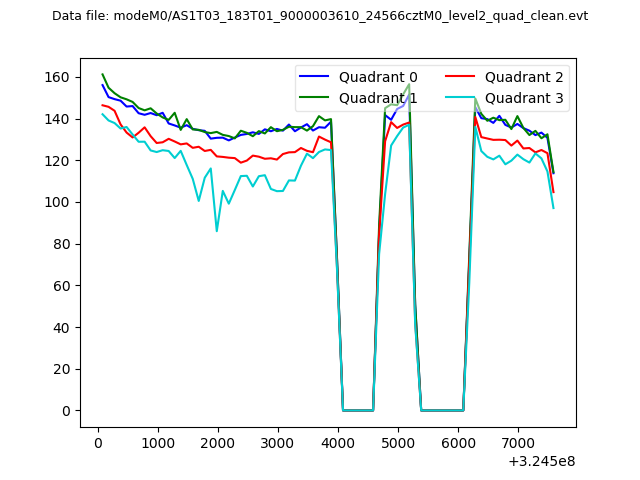 |
|
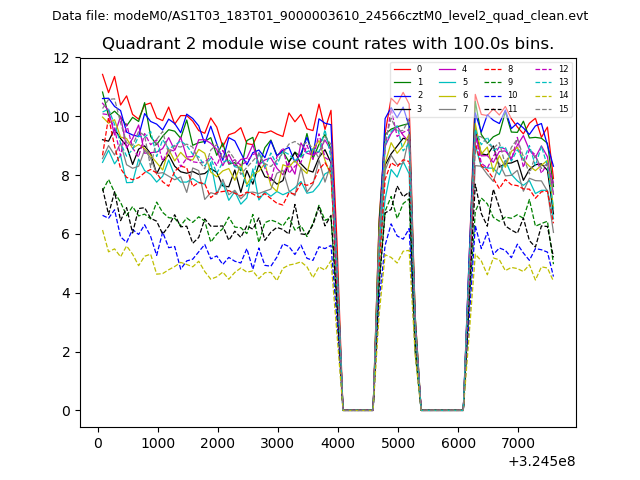
| Module-wise count rates for Quadrant A Data is divided into 100 sec bins |
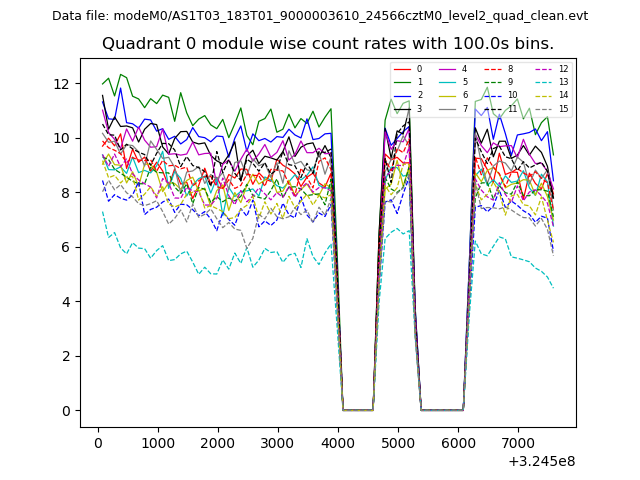 |
 |
| Module-wise count rates for Quadrant B Data is divided into 100 sec bins |
 |
 |
| Module-wise count rates for Quadrant C Data is divided into 100 sec bins |
 |
 |
| Module-wise count rates for Quadrant D Data is divided into 100 sec bins |
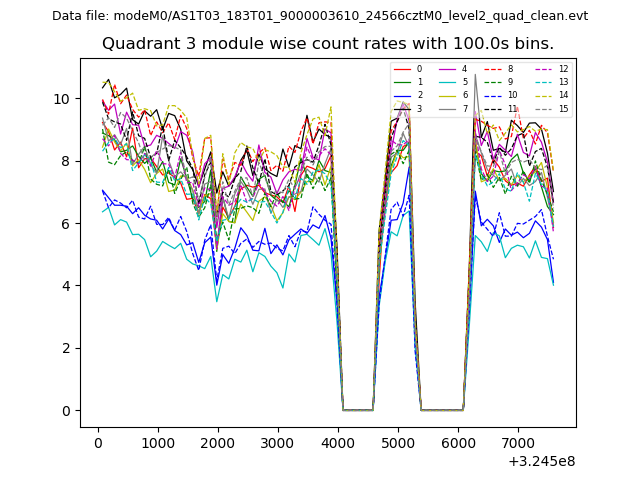 |
 |
| Parameter | Plot |
|---|---|
| CZT HV Monitor | 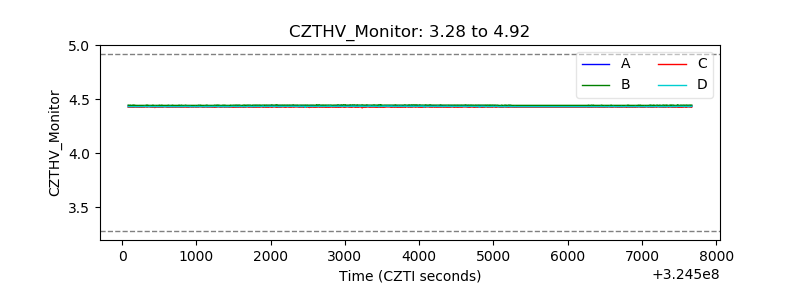 |
| D_VDD | 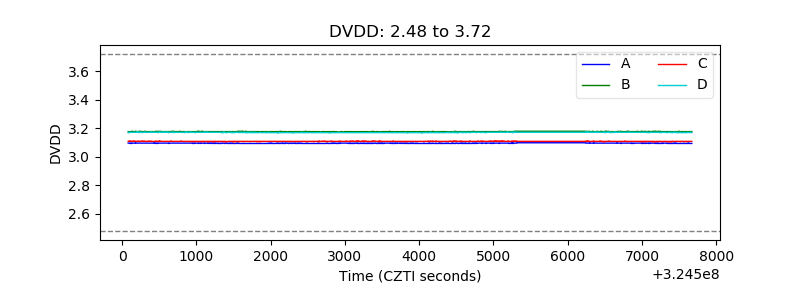 |
| Temperature 1 | 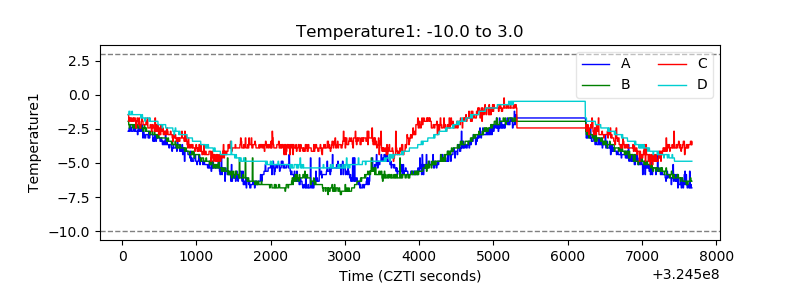 |
| Veto HV Monitor | 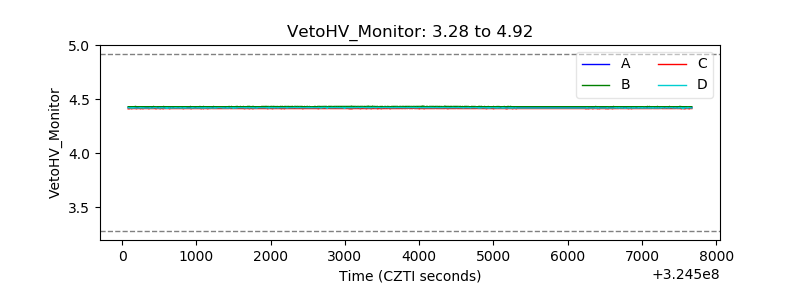 |
| Veto LLD | 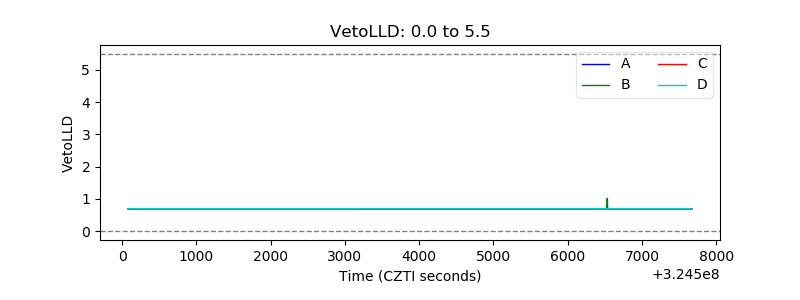 |
| Alpha Counter | 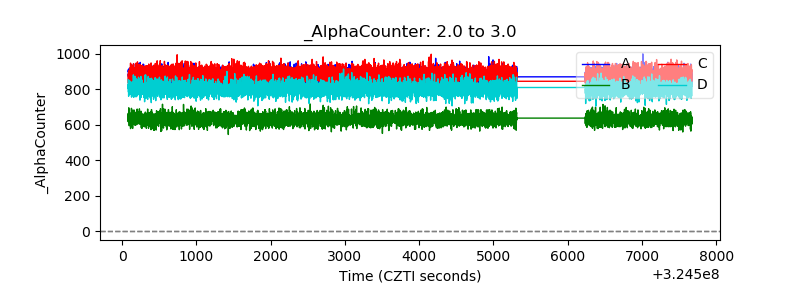 |
| _CPM_Rate | 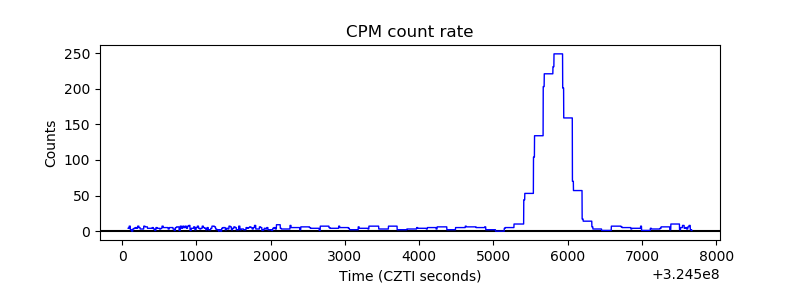 |
| CZT Counter | 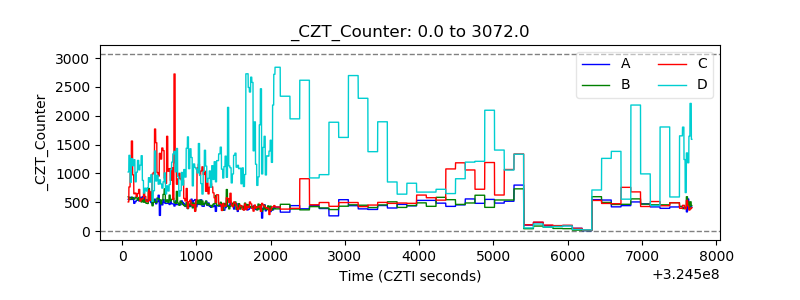 |
| +2.5 Volts monitor |  |
| +5 Volts monitor |  |
| _ROLL_ROT |  |
| _Roll_DEC |  |
| _Roll_RA | 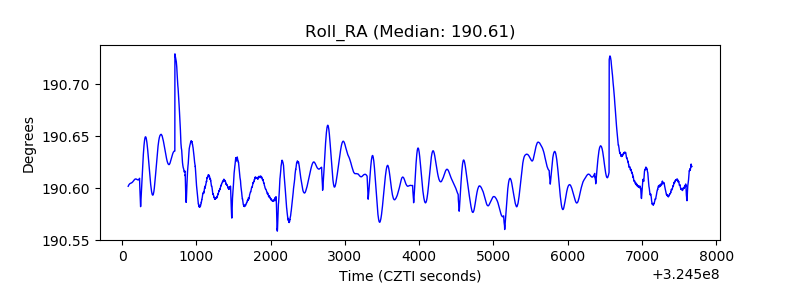 |
| Veto Counter | 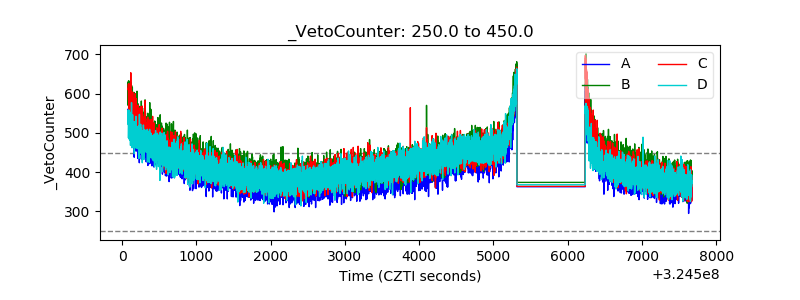 |