| Param | Original file | Final file |
|---|---|---|
| Filename | modeM0/AS1T03_183T01_9000003610_24567cztM0_level2.evt | modeM0/AS1T03_183T01_9000003610_24567cztM0_level2_quad_clean.evt |
| Size (bytes) | 617,120,640 | 131,526,720 |
| Size | 588.5 MB | 125.4 MB |
| Events in quadrant A | 3,429,552 | 904,620 |
| Events in quadrant B | 3,569,262 | 908,722 |
| Events in quadrant C | 3,884,352 | 844,712 |
| Events in quadrant D | 7,301,800 | 806,815 |
| Mode M0 | |||
|---|---|---|---|
| Quadrant | BADHDUFLAG | Total packets | Discarded packets |
| A | 0 | 15197 | 2 |
| B | 0 | 15465 | 2 |
| C | 0 | 16483 | 3 |
| D | 0 | 26985 | 2 |
| Mode SS | |||
|---|---|---|---|
| Quadrant | BADHDUFLAG | Total packets | Discarded packets |
| A | 0 | 150 | 0 |
| B | 0 | 150 | 0 |
| C | 0 | 150 | 0 |
| D | 0 | 150 | 0 |
| Mode M9 | |||
|---|---|---|---|
| Quadrant | BADHDUFLAG | Total packets | Discarded packets |
| A | 0 | 9 | 0 |
| B | 0 | 10 | 0 |
| C | 0 | 10 | 0 |
| D | 0 | 10 | 0 |
| Quadrant | Total seconds | Saturated seconds | Saturation percentage |
|---|---|---|---|
| A | 7458 | 22 | 0.294985% |
| B | 7458 | 54 | 0.724055% |
| C | 7457 | 157 | 2.105404% |
| D | 7457 | 352 | 4.720397% |
Noise dominated data is calculated using 1-second bins in cleaned event files. If a bin has >2000 counts, and if more than 50% of those come from <1% of pixels, then it is considered to be noise-dominated and hence unusable.
| Quadrant | # 1 sec bins | Bins with >0 counts | Bins with >2000 counts | High rate bins dominated by noise | Noise dominated (total time) | Noise dominated (detector-on time) | Marked lightcurve |
|---|---|---|---|---|---|---|---|
| A | 7923 | 7459 | 0 | 0 | 0.00% | 0.00% | 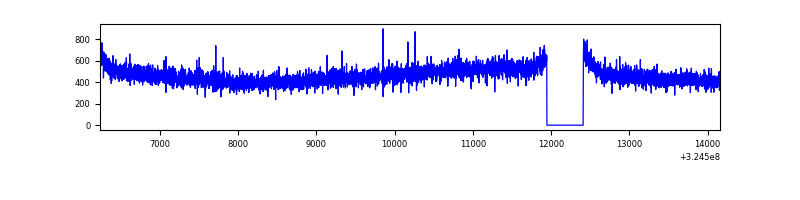 |
| B | 7923 | 7459 | 4 | 4 | 0.05% | 0.05% | 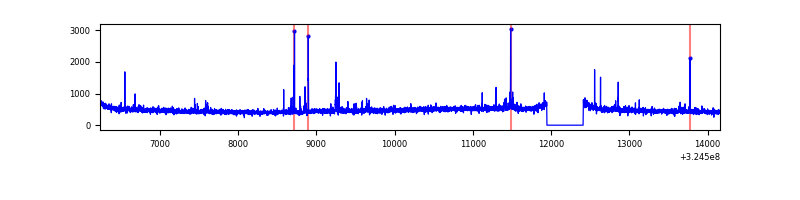 |
| C | 7922 | 7458 | 42 | 42 | 0.53% | 0.56% | 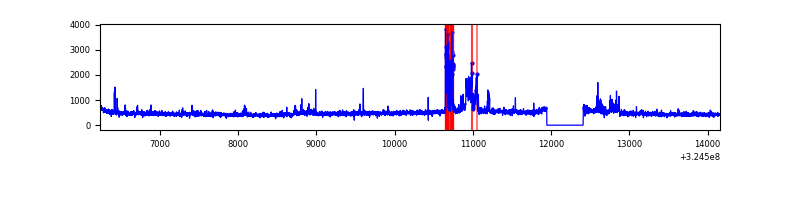 |
| D | 7922 | 7458 | 293 | 293 | 3.70% | 3.93% | 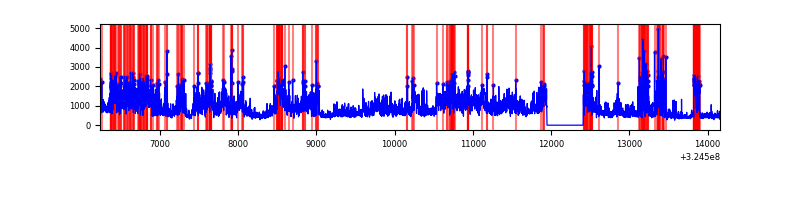 |
Top three noisy pixels from each quadrant. If the there are fewer than three noisy pixels in the level2.evt file, extra rows are filled as -1
| Pixel properties | Quadrant properties | ||||||
|---|---|---|---|---|---|---|---|
| Quadrant | DetID | PixID | Counts | Sigma | Mean | Median | Sigma |
| A | 13 | 254 | 10899 | 56.26 | 889 | 873 | 178.2 |
| A | 3 | 137 | 7996 | 39.97 | 889 | 873 | 178.2 |
| A | 0 | 226 | 7368 | 36.45 | 889 | 873 | 178.2 |
| B | 12 | 17 | 52180 | 303.25 | 888 | 864 | 169.2 |
| B | 12 | 111 | 20243 | 114.52 | 888 | 864 | 169.2 |
| B | 11 | 111 | 17855 | 100.41 | 888 | 864 | 169.2 |
| C | 7 | 247 | 420187 | 2163.91 | 839 | 845 | 193.8 |
| C | 14 | 238 | 135439 | 694.54 | 839 | 845 | 193.8 |
| C | 5 | 112 | 26518 | 132.48 | 839 | 845 | 193.8 |
| D | 8 | 195 | 2915855 | 14317.97 | 838 | 812 | 203.6 |
| D | 12 | 218 | 586378 | 2876.16 | 838 | 812 | 203.6 |
| D | 1 | 255 | 360711 | 1767.73 | 838 | 812 | 203.6 |
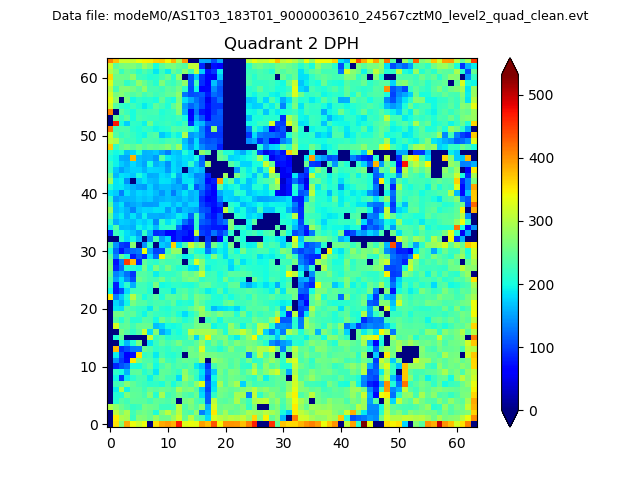
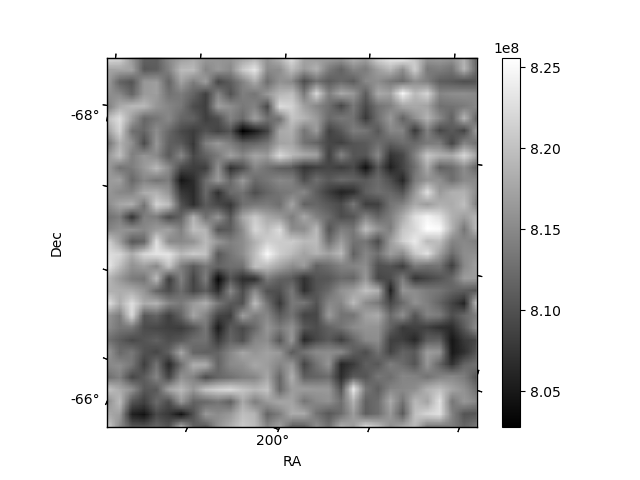
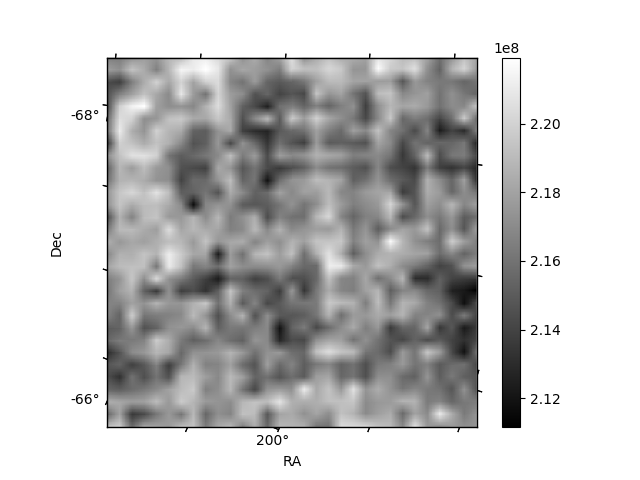
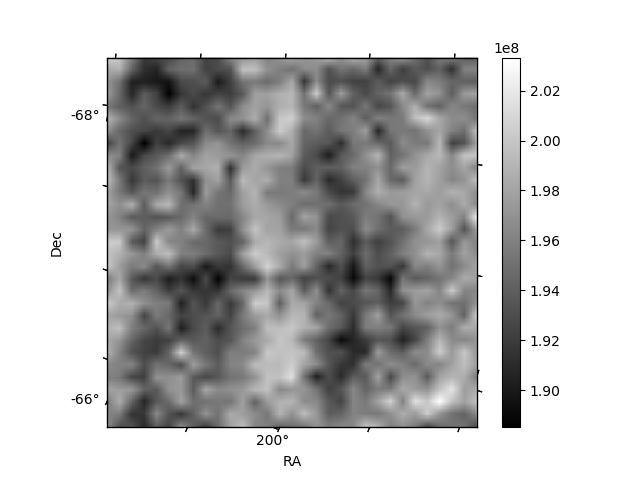
Histogram calculated using DETX and DETY for each event in the final _common_clean file
| Quadrant A | 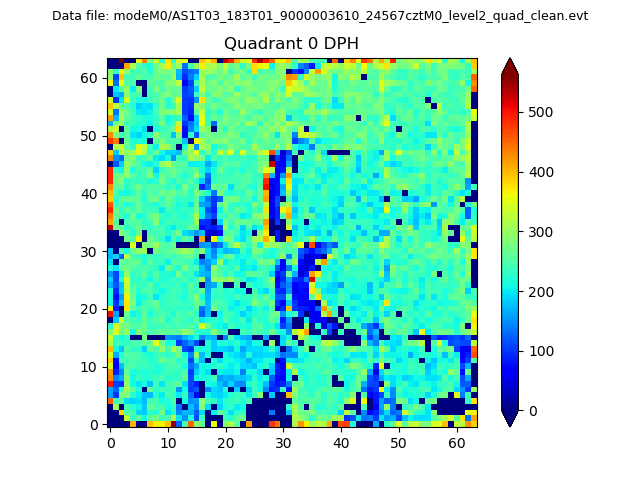 |
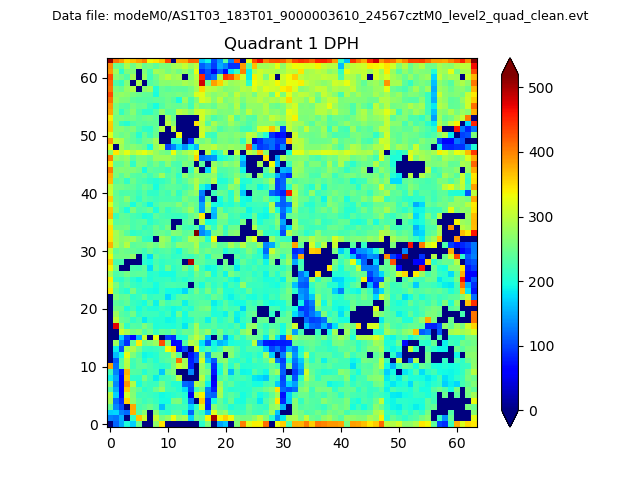 |
Quadrant B |
|---|---|---|---|
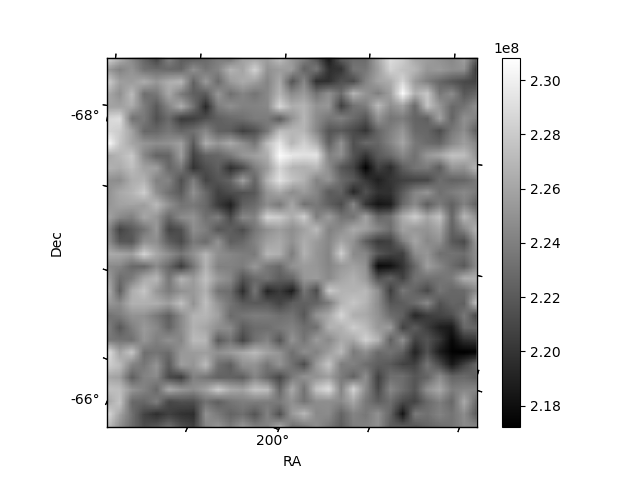
| Quadrant D | 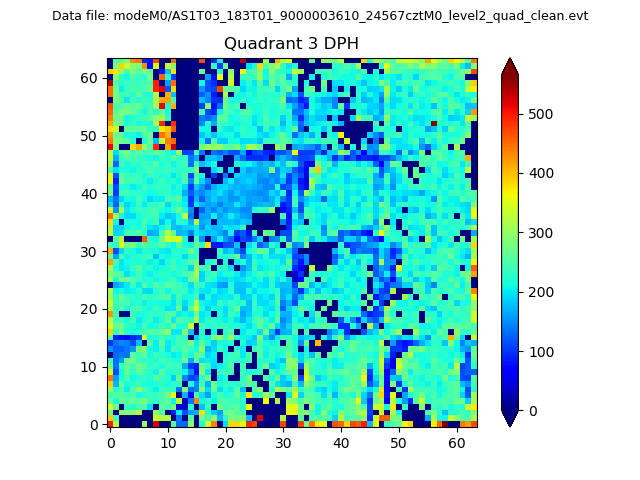 |
 |
Quadrant C |
| Plot type | Count rate plots | Images |
|---|---|---|
| Comparison with Poisson distribution Blue bars denote a histogram of data divided into 1 sec bins. Red curve is a Poisson curve with rate = median count rate of data. |
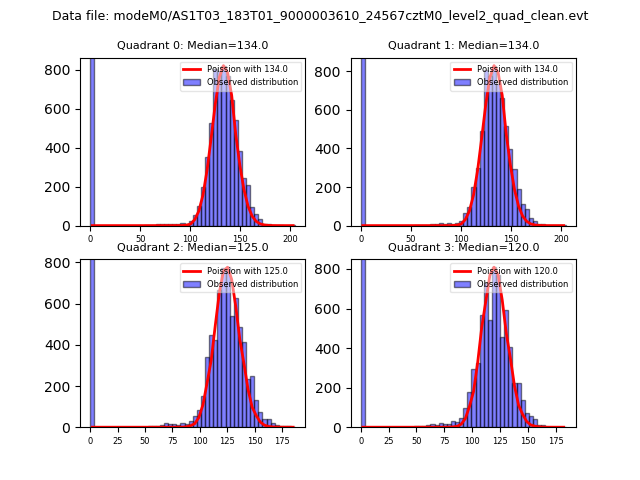 |
 |
| Quadrant-wise count rates Data is divided into 100 sec bins |
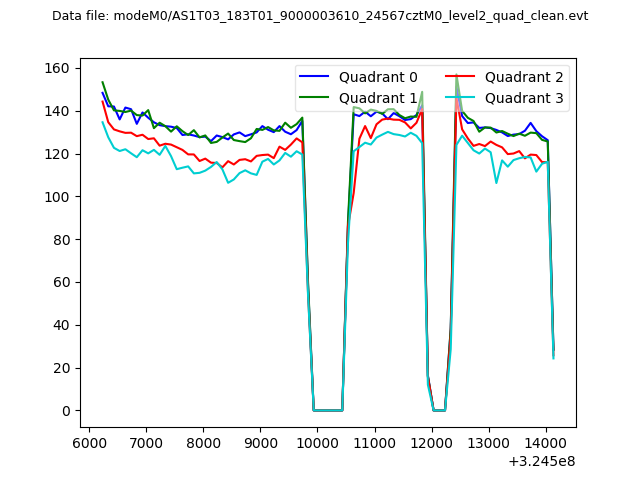 |
|
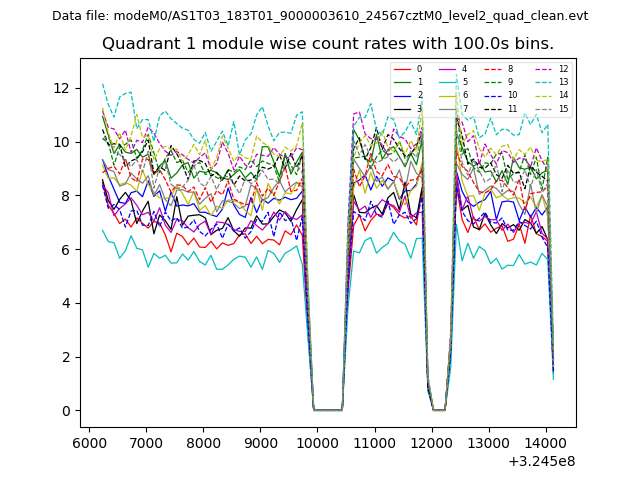
| Module-wise count rates for Quadrant A Data is divided into 100 sec bins |
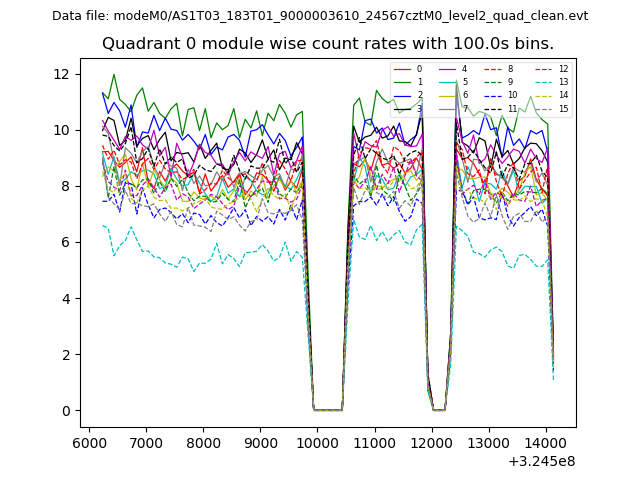 |
 |
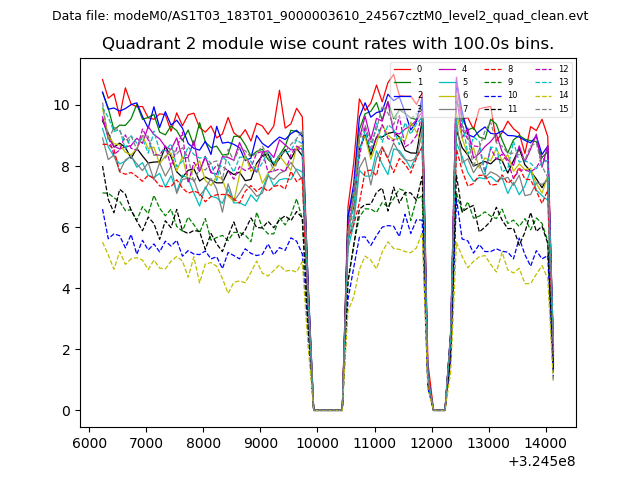
| Module-wise count rates for Quadrant B Data is divided into 100 sec bins |
 |
 |
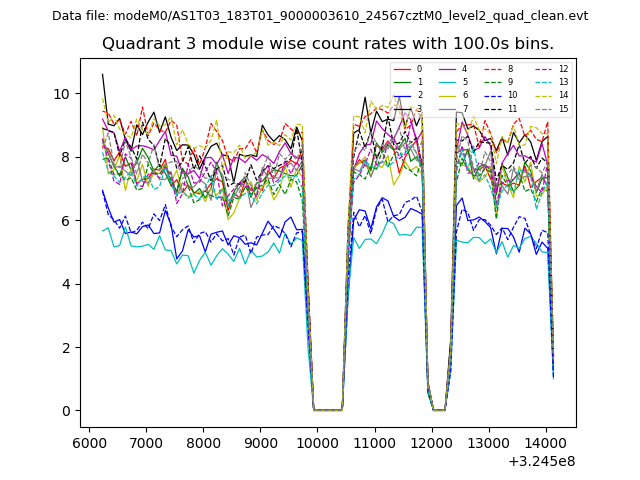
| Module-wise count rates for Quadrant C Data is divided into 100 sec bins |
 |
 |
| Module-wise count rates for Quadrant D Data is divided into 100 sec bins |
 |
 |
| Parameter | Plot |
|---|---|
| CZT HV Monitor | 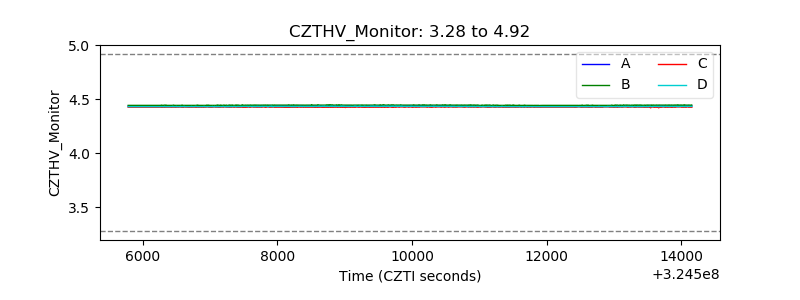 |
| D_VDD | 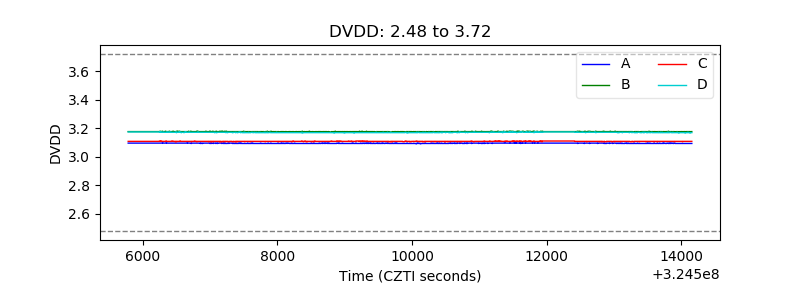 |
| Temperature 1 | 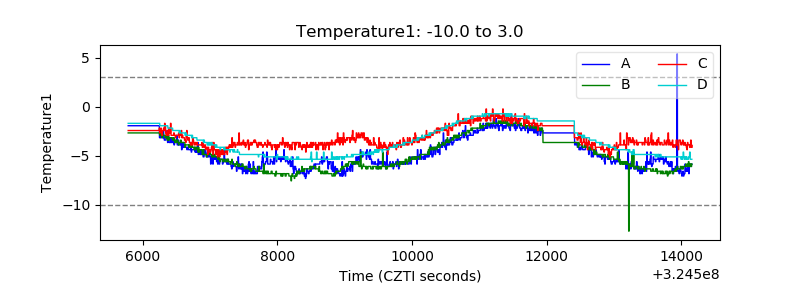 |
| Veto HV Monitor | 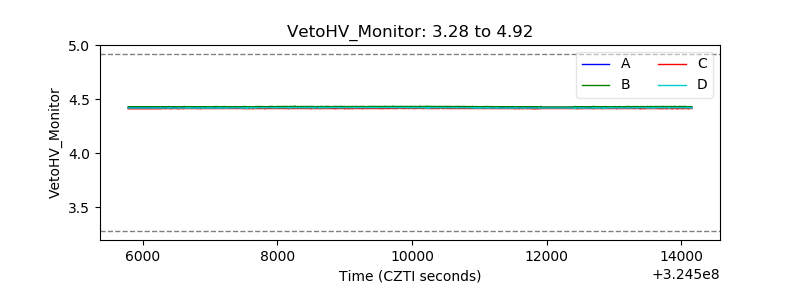 |
| Veto LLD | 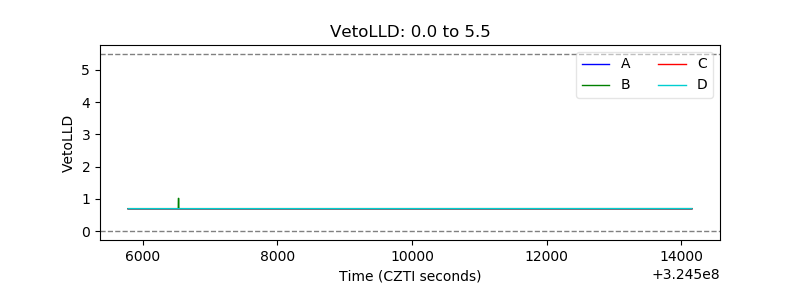 |
| Alpha Counter | 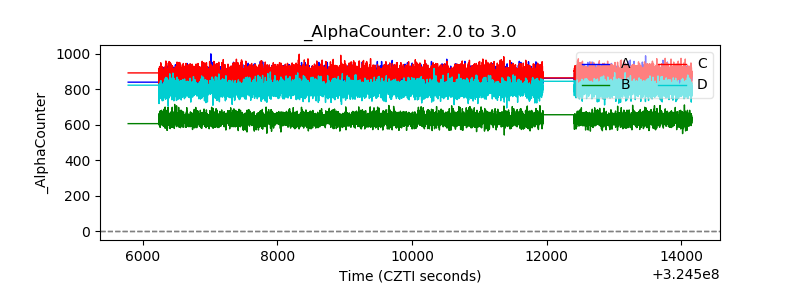 |
| _CPM_Rate | 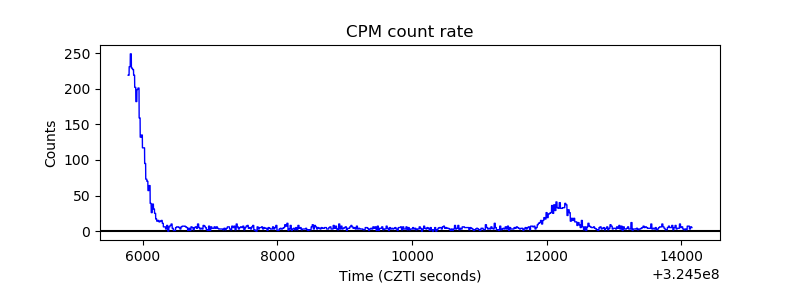 |
| CZT Counter | 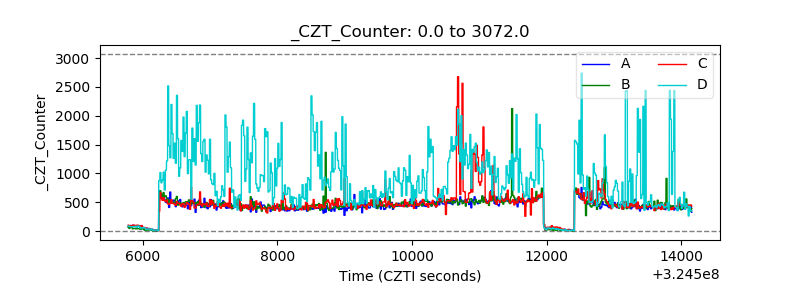 |
| +2.5 Volts monitor |  |
| +5 Volts monitor |  |
| _ROLL_ROT | 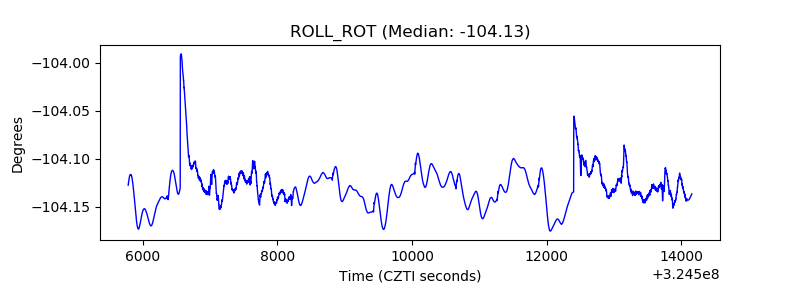 |
| _Roll_DEC | 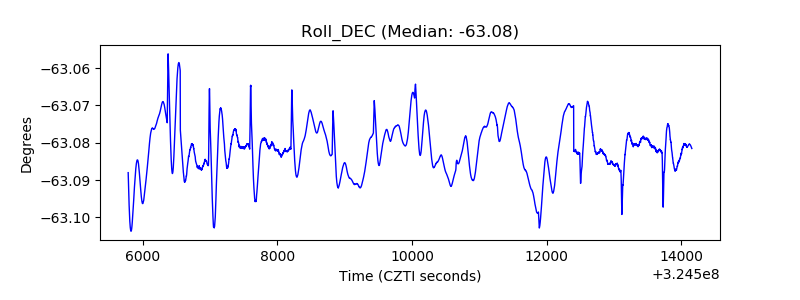 |
| _Roll_RA | 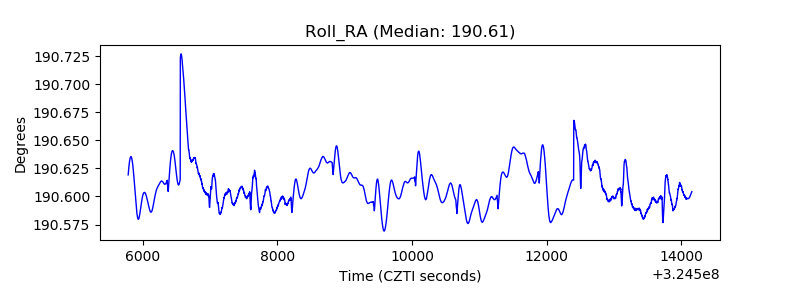 |
| Veto Counter | 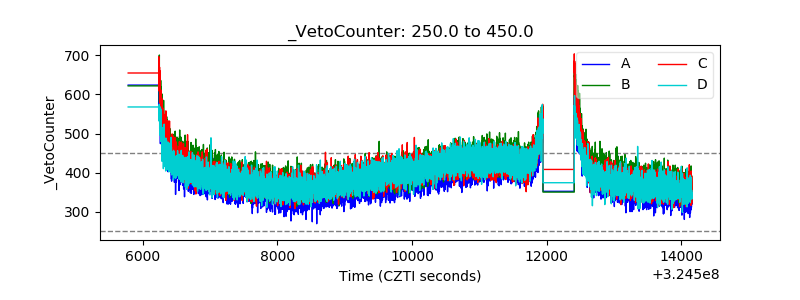 |