| Param | Original file | Final file |
|---|---|---|
| Filename | modeM0/AS1T03_183T01_9000003610_24569cztM0_level2.evt | modeM0/AS1T03_183T01_9000003610_24569cztM0_level2_quad_clean.evt |
| Size (bytes) | 585,406,080 | 130,242,240 |
| Size | 558.3 MB | 124.2 MB |
| Events in quadrant A | 4,672,982 | 865,473 |
| Events in quadrant B | 3,592,940 | 895,101 |
| Events in quadrant C | 3,951,394 | 835,035 |
| Events in quadrant D | 4,995,849 | 819,726 |
| Mode M0 | |||
|---|---|---|---|
| Quadrant | BADHDUFLAG | Total packets | Discarded packets |
| A | 0 | 19080 | 3 |
| B | 0 | 15696 | 2 |
| C | 0 | 16664 | 2 |
| D | 0 | 20075 | 2 |
| Mode SS | |||
|---|---|---|---|
| Quadrant | BADHDUFLAG | Total packets | Discarded packets |
| A | 0 | 156 | 0 |
| B | 0 | 156 | 0 |
| C | 0 | 156 | 0 |
| D | 0 | 156 | 0 |
| Mode M9 | |||
|---|---|---|---|
| Quadrant | BADHDUFLAG | Total packets | Discarded packets |
| A | 0 | 2 | 0 |
| B | 0 | 3 | 0 |
| C | 0 | 3 | 0 |
| D | 0 | 3 | 0 |
| Quadrant | Total seconds | Saturated seconds | Saturation percentage |
|---|---|---|---|
| A | 7608 | 445 | 5.849106% |
| B | 7608 | 114 | 1.498423% |
| C | 7608 | 273 | 3.588328% |
| D | 7608 | 91 | 1.196109% |
Noise dominated data is calculated using 1-second bins in cleaned event files. If a bin has >2000 counts, and if more than 50% of those come from <1% of pixels, then it is considered to be noise-dominated and hence unusable.
| Quadrant | # 1 sec bins | Bins with >0 counts | Bins with >2000 counts | High rate bins dominated by noise | Noise dominated (total time) | Noise dominated (detector-on time) | Marked lightcurve |
|---|---|---|---|---|---|---|---|
| A | 7868 | 7609 | 230 | 230 | 2.92% | 3.02% |  |
| B | 7868 | 7609 | 2 | 2 | 0.03% | 0.03% | 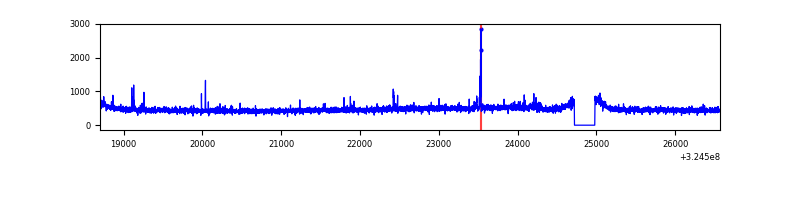 |
| C | 7868 | 7609 | 74 | 74 | 0.94% | 0.97% | 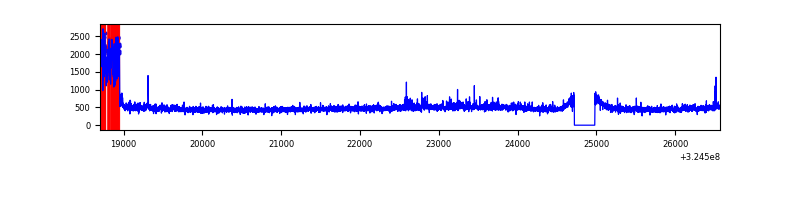 |
| D | 7868 | 7609 | 30 | 30 | 0.38% | 0.39% | 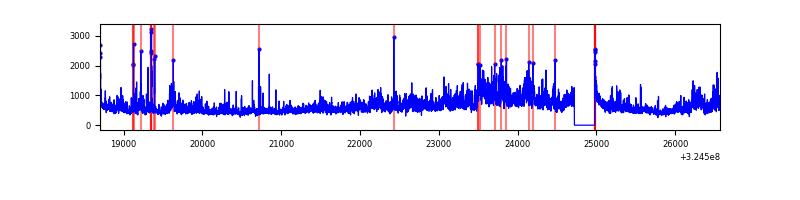 |
Top three noisy pixels from each quadrant. If the there are fewer than three noisy pixels in the level2.evt file, extra rows are filled as -1
| Pixel properties | Quadrant properties | ||||||
|---|---|---|---|---|---|---|---|
| Quadrant | DetID | PixID | Counts | Sigma | Mean | Median | Sigma |
| A | 6 | 16 | 1255766 | 7041.34 | 886 | 866 | 178.2 |
| A | 13 | 254 | 10923 | 56.43 | 886 | 866 | 178.2 |
| A | 3 | 137 | 8165 | 40.96 | 886 | 866 | 178.2 |
| B | 3 | 64 | 40876 | 233.79 | 899 | 875 | 171.1 |
| B | 12 | 111 | 21014 | 117.71 | 899 | 875 | 171.1 |
| B | 11 | 111 | 18635 | 103.8 | 899 | 875 | 171.1 |
| C | 7 | 247 | 423352 | 2125.29 | 855 | 859 | 198.8 |
| C | 14 | 238 | 135065 | 675.1 | 855 | 859 | 198.8 |
| C | 2 | 16 | 29043 | 141.78 | 855 | 859 | 198.8 |
| D | 8 | 195 | 1278700 | 6122.38 | 863 | 837 | 208.7 |
| D | 12 | 218 | 219590 | 1048.07 | 863 | 837 | 208.7 |
| D | 7 | 238 | 154116 | 734.38 | 863 | 837 | 208.7 |
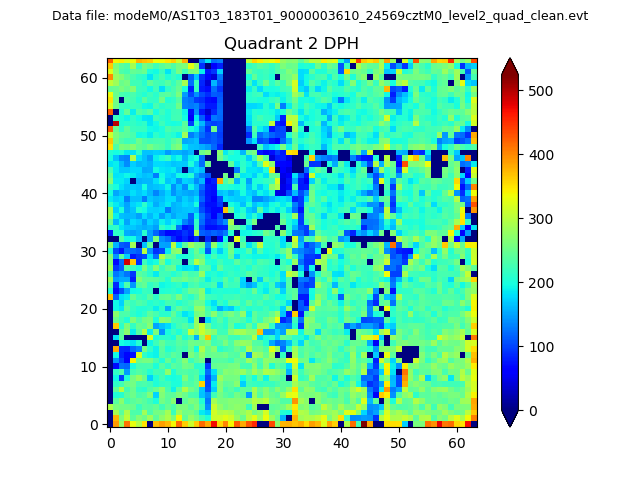
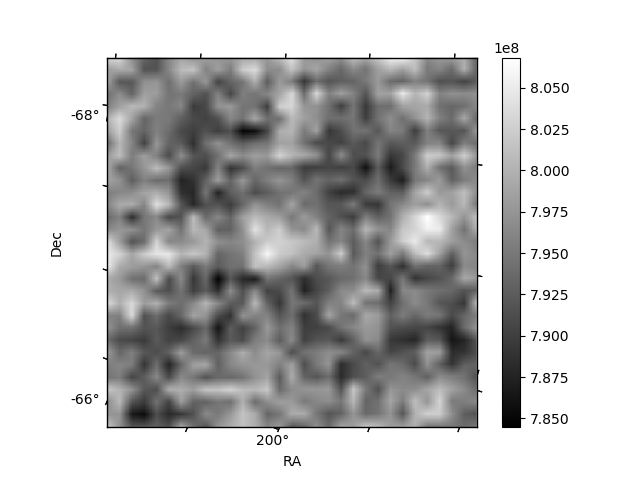
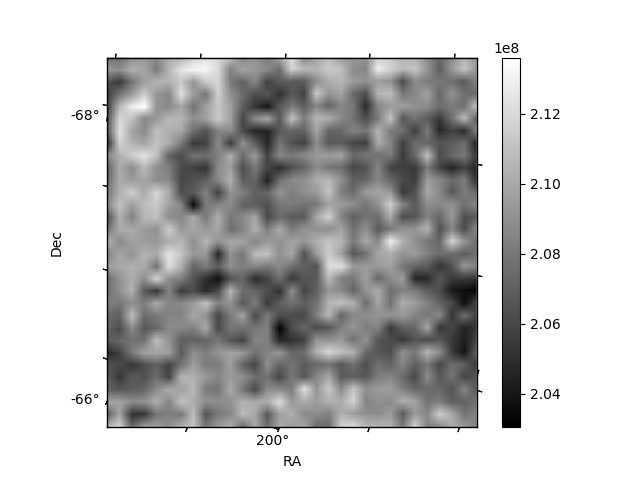
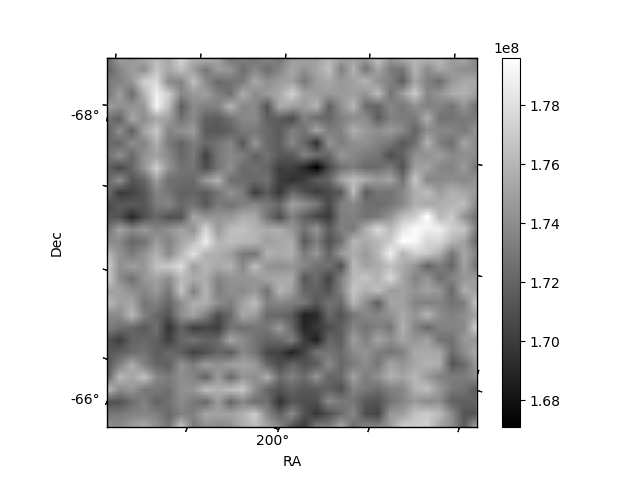
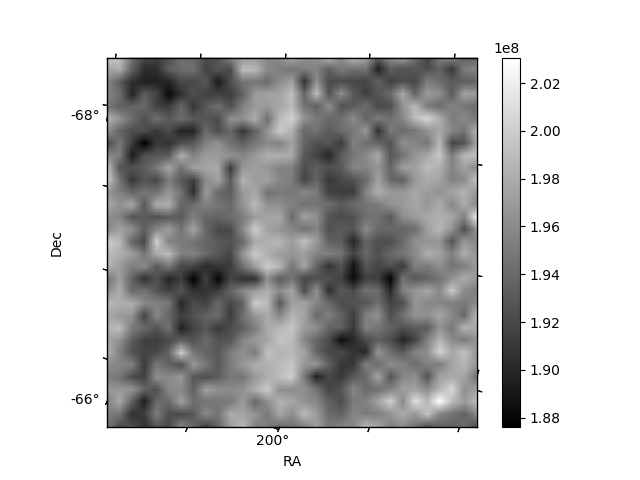
Histogram calculated using DETX and DETY for each event in the final _common_clean file
| Quadrant A |  |
 |
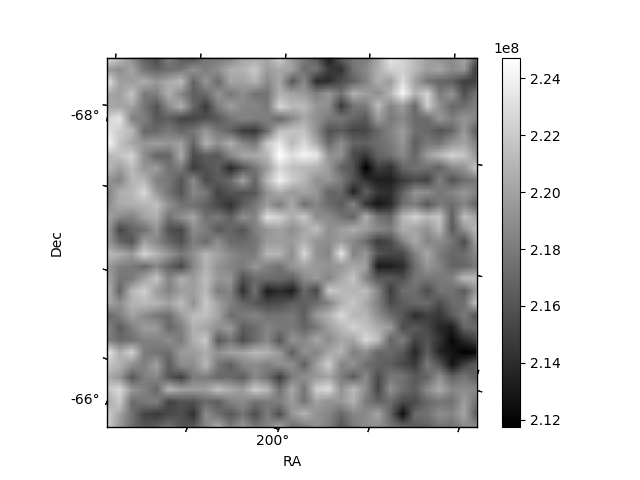
Quadrant B |
|---|---|---|---|
| Quadrant D |  |
 |
Quadrant C |
| Plot type | Count rate plots | Images |
|---|---|---|
| Comparison with Poisson distribution Blue bars denote a histogram of data divided into 1 sec bins. Red curve is a Poisson curve with rate = median count rate of data. |
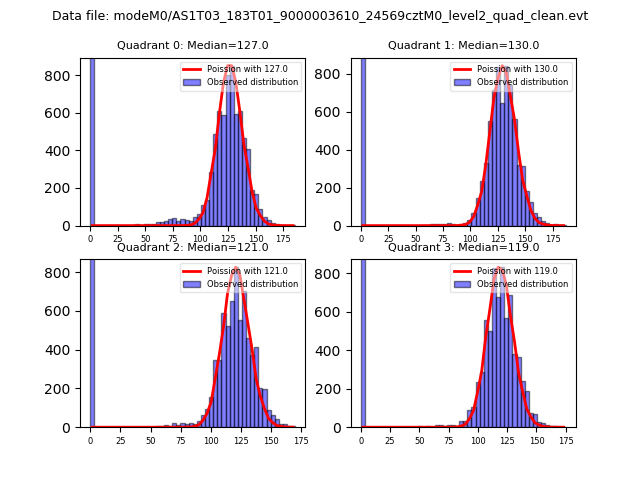 |
 |
| Quadrant-wise count rates Data is divided into 100 sec bins |
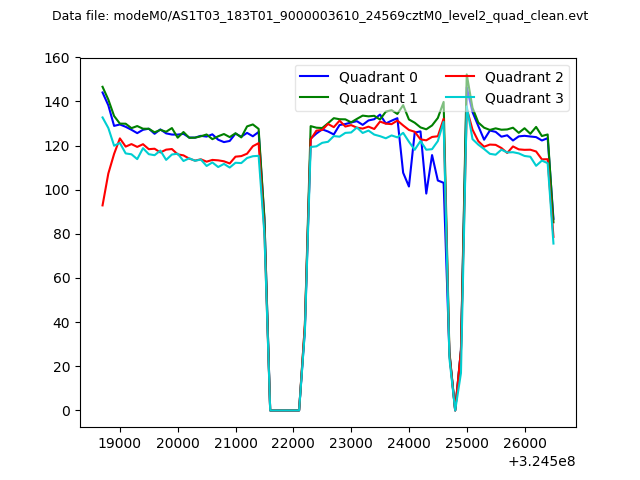 |
|
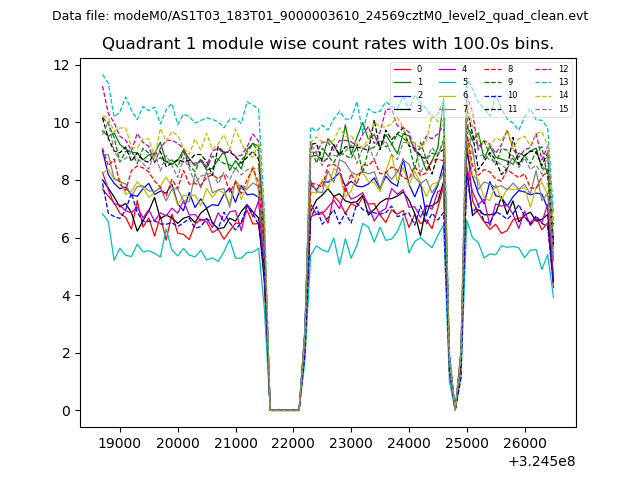
| Module-wise count rates for Quadrant A Data is divided into 100 sec bins |
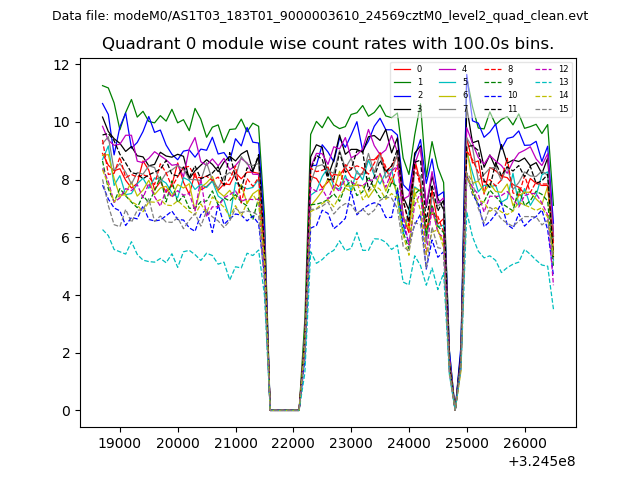 |
 |
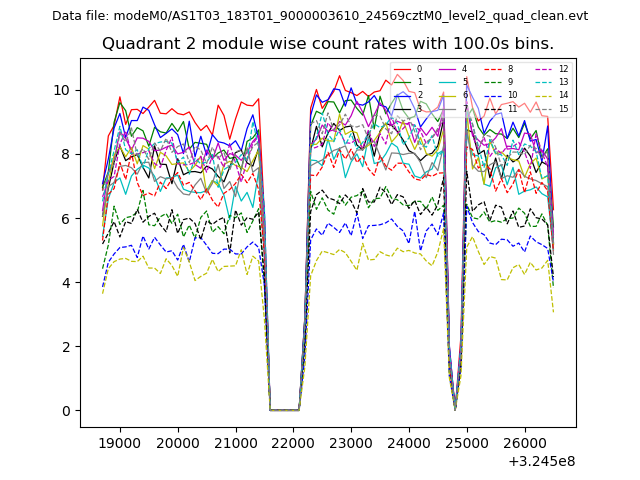
| Module-wise count rates for Quadrant B Data is divided into 100 sec bins |
 |
 |
| Module-wise count rates for Quadrant C Data is divided into 100 sec bins |
 |
 |
| Module-wise count rates for Quadrant D Data is divided into 100 sec bins |
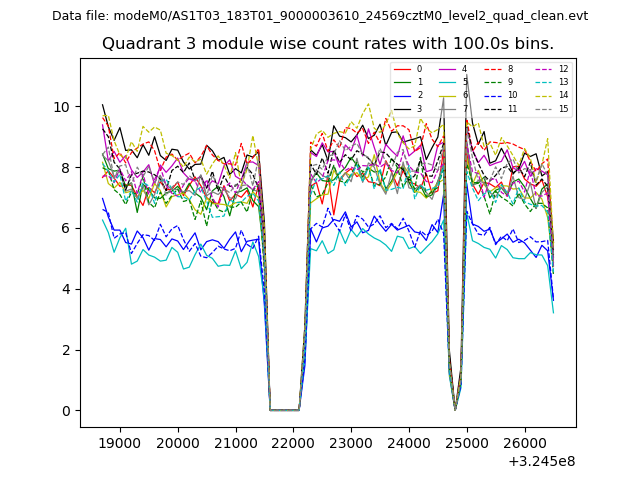 |
 |
| Parameter | Plot |
|---|---|
| CZT HV Monitor | 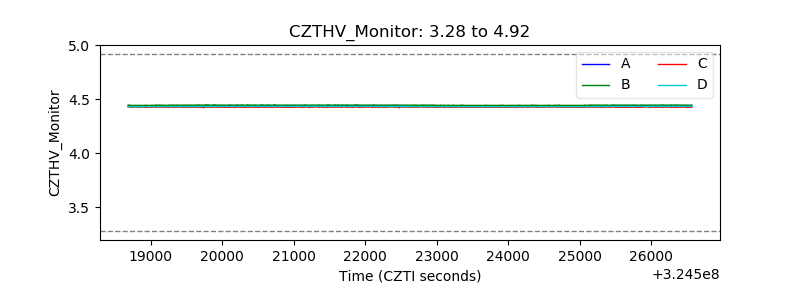 |
| D_VDD |  |
| Temperature 1 | 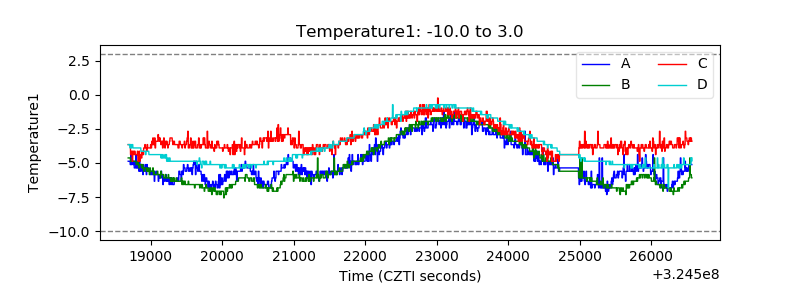 |
| Veto HV Monitor | 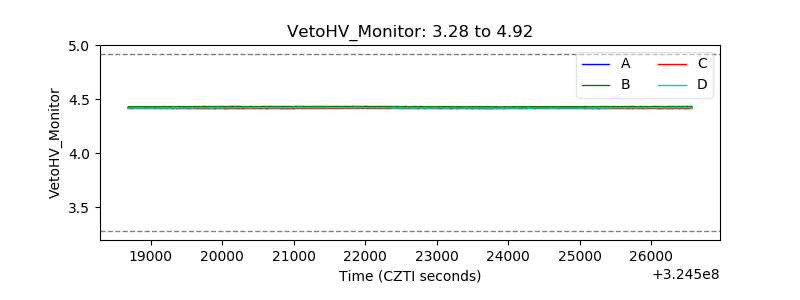 |
| Veto LLD | 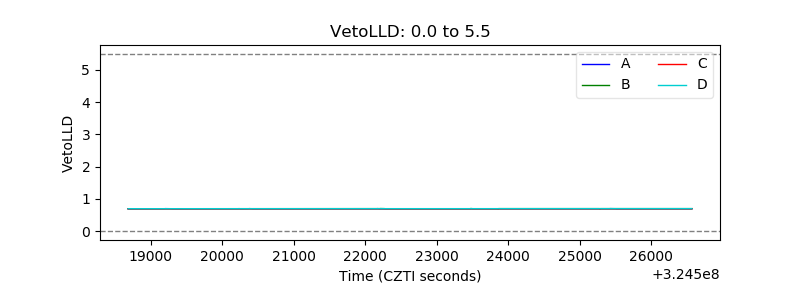 |
| Alpha Counter | 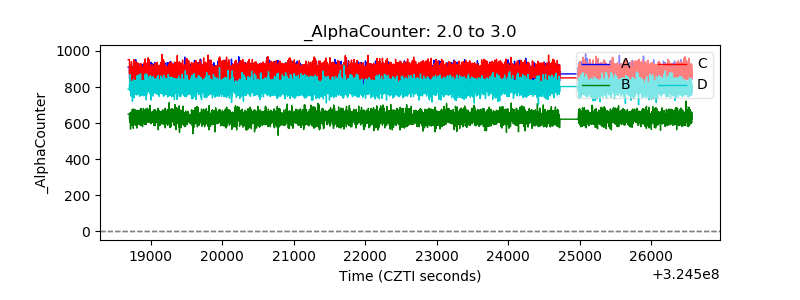 |
| _CPM_Rate | 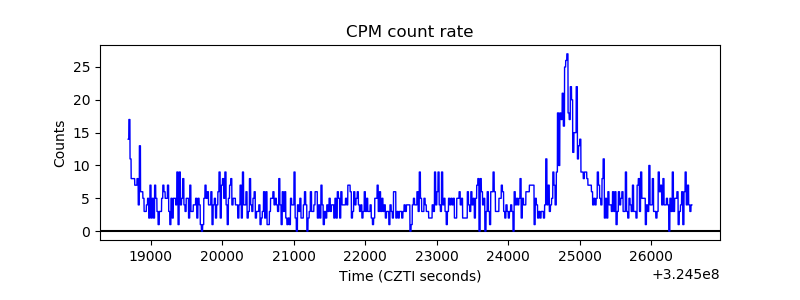 |
| CZT Counter | 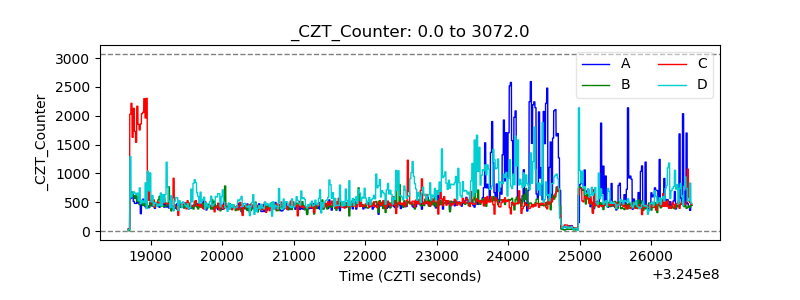 |
| +2.5 Volts monitor |  |
| +5 Volts monitor | 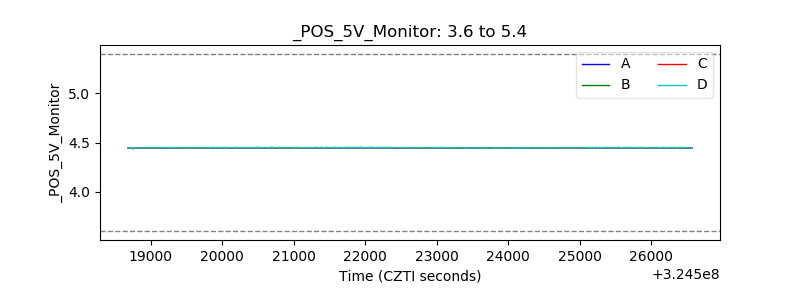 |
| _ROLL_ROT | 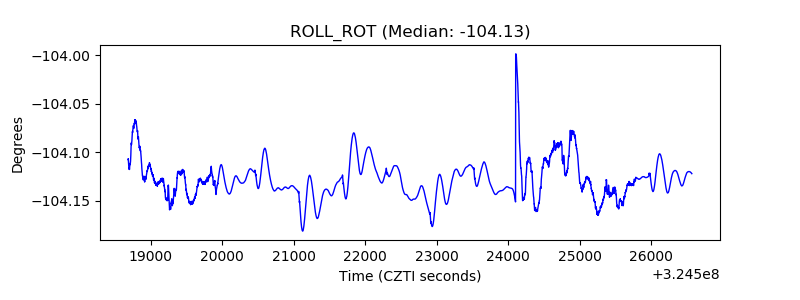 |
| _Roll_DEC | 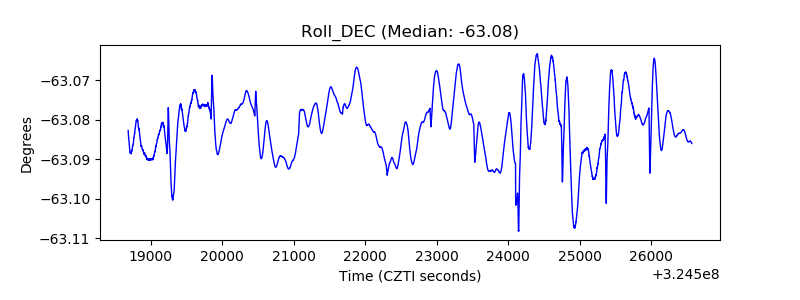 |
| _Roll_RA | 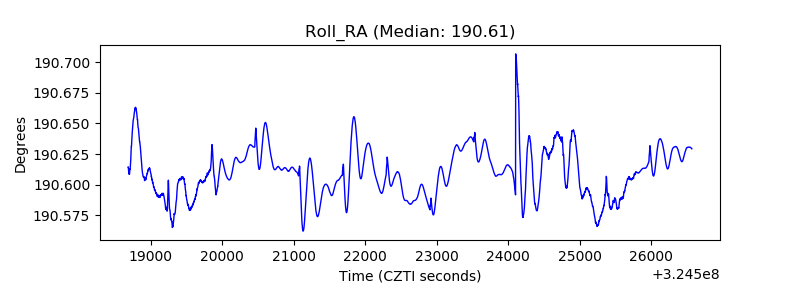 |
| Veto Counter | 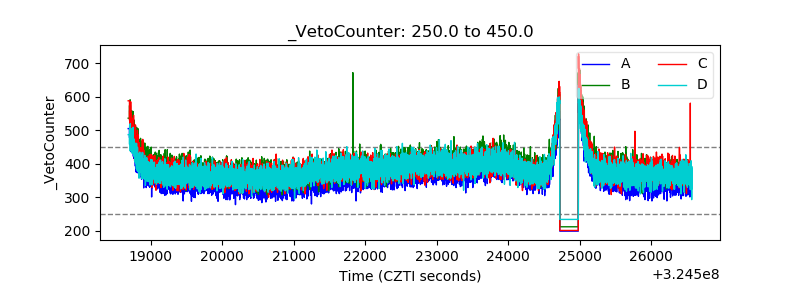 |