| Param | Original file | Final file |
|---|---|---|
| Filename | modeM0/AS1T03_183T01_9000003610_24571cztM0_level2.evt | modeM0/AS1T03_183T01_9000003610_24571cztM0_level2_quad_clean.evt |
| Size (bytes) | 642,735,360 | 138,574,080 |
| Size | 613.0 MB | 132.2 MB |
| Events in quadrant A | 4,805,553 | 925,147 |
| Events in quadrant B | 3,892,098 | 948,654 |
| Events in quadrant C | 4,056,141 | 891,444 |
| Events in quadrant D | 6,154,882 | 860,708 |
| Mode M0 | |||
|---|---|---|---|
| Quadrant | BADHDUFLAG | Total packets | Discarded packets |
| A | 0 | 19749 | 2 |
| B | 0 | 16966 | 2 |
| C | 0 | 17143 | 2 |
| D | 0 | 23860 | 2 |
| Mode SS | |||
|---|---|---|---|
| Quadrant | BADHDUFLAG | Total packets | Discarded packets |
| A | 0 | 170 | 0 |
| B | 0 | 170 | 0 |
| C | 0 | 170 | 0 |
| D | 0 | 170 | 0 |
| Mode M9 | |||
|---|---|---|---|
| Quadrant | BADHDUFLAG | Total packets | Discarded packets |
| A | 0 | 7 | 0 |
| B | 0 | 7 | 0 |
| C | 0 | 7 | 0 |
| D | 0 | 7 | 0 |
| Quadrant | Total seconds | Saturated seconds | Saturation percentage |
|---|---|---|---|
| A | 8211 | 287 | 3.495311% |
| B | 8211 | 144 | 1.753745% |
| C | 8211 | 166 | 2.021678% |
| D | 8211 | 337 | 4.104250% |
Noise dominated data is calculated using 1-second bins in cleaned event files. If a bin has >2000 counts, and if more than 50% of those come from <1% of pixels, then it is considered to be noise-dominated and hence unusable.
| Quadrant | # 1 sec bins | Bins with >0 counts | Bins with >2000 counts | High rate bins dominated by noise | Noise dominated (total time) | Noise dominated (detector-on time) | Marked lightcurve |
|---|---|---|---|---|---|---|---|
| A | 8951 | 8213 | 106 | 106 | 1.18% | 1.29% | 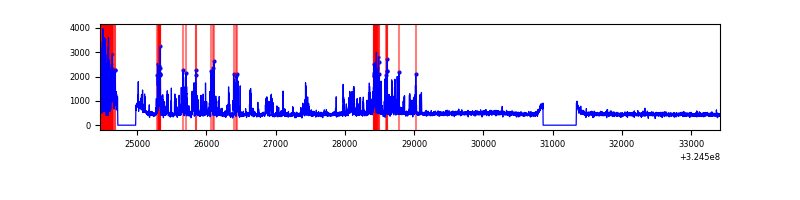 |
| B | 8951 | 8213 | 2 | 2 | 0.02% | 0.02% | 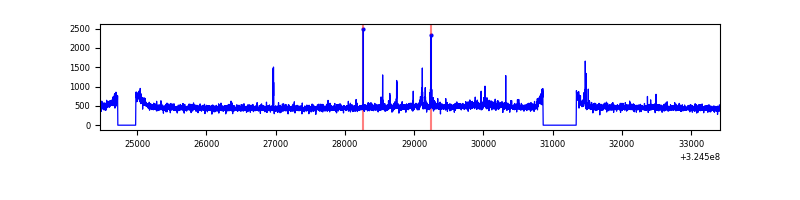 |
| C | 8951 | 8213 | 0 | 0 | 0.00% | 0.00% |  |
| D | 8951 | 8213 | 240 | 240 | 2.68% | 2.92% | 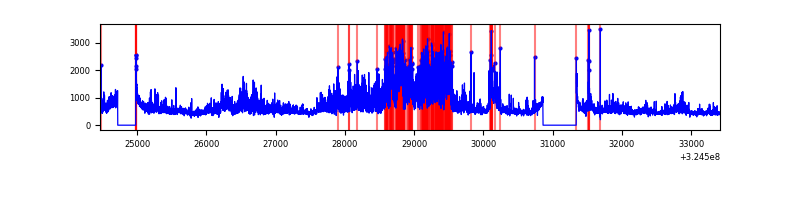 |
Top three noisy pixels from each quadrant. If the there are fewer than three noisy pixels in the level2.evt file, extra rows are filled as -1
| Pixel properties | Quadrant properties | ||||||
|---|---|---|---|---|---|---|---|
| Quadrant | DetID | PixID | Counts | Sigma | Mean | Median | Sigma |
| A | 6 | 16 | 1067661 | 5458.01 | 968 | 946 | 195.4 |
| A | 13 | 254 | 12251 | 57.84 | 968 | 946 | 195.4 |
| A | 3 | 137 | 8685 | 39.6 | 968 | 946 | 195.4 |
| B | 3 | 64 | 32263 | 169.6 | 974 | 948 | 184.6 |
| B | 0 | 190 | 27426 | 143.4 | 974 | 948 | 184.6 |
| B | 12 | 111 | 22820 | 118.45 | 974 | 948 | 184.6 |
| C | 14 | 238 | 147080 | 669.35 | 937 | 941 | 218.3 |
| C | 7 | 247 | 103237 | 468.54 | 937 | 941 | 218.3 |
| C | 2 | 16 | 97043 | 440.17 | 937 | 941 | 218.3 |
| D | 8 | 195 | 2043534 | 9071.25 | 938 | 910 | 225.2 |
| D | 12 | 218 | 221967 | 981.71 | 938 | 910 | 225.2 |
| D | 7 | 238 | 151902 | 670.55 | 938 | 910 | 225.2 |
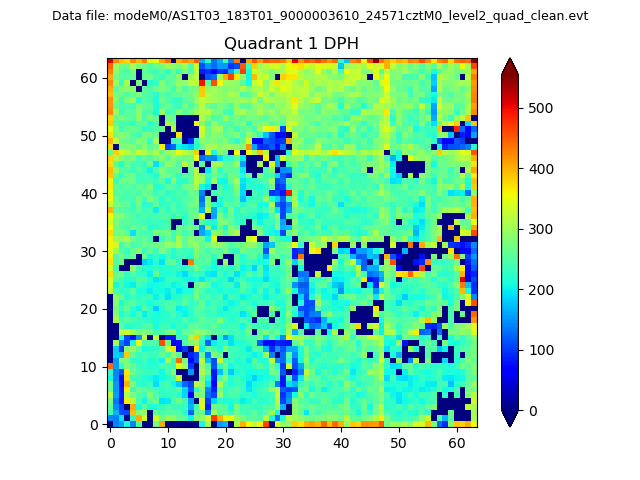
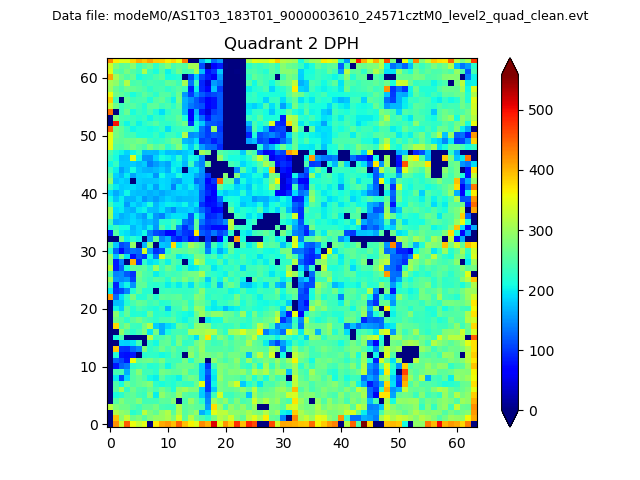
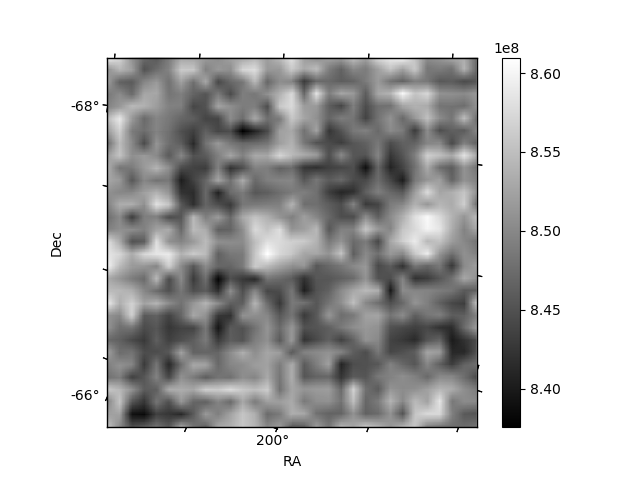
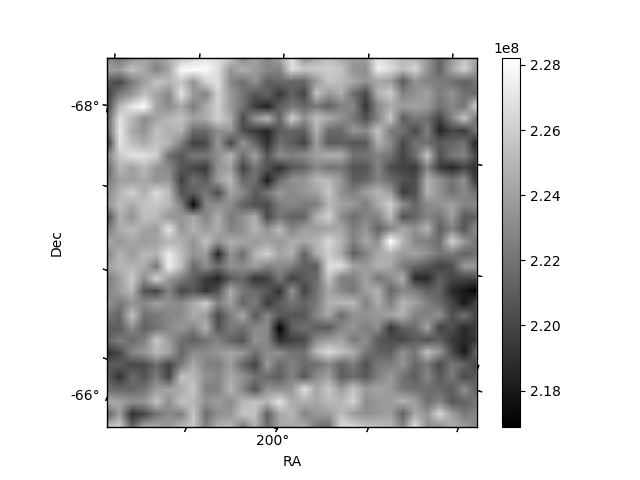
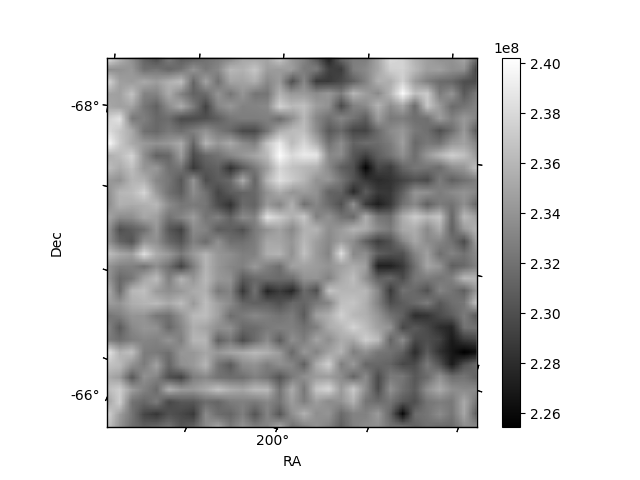
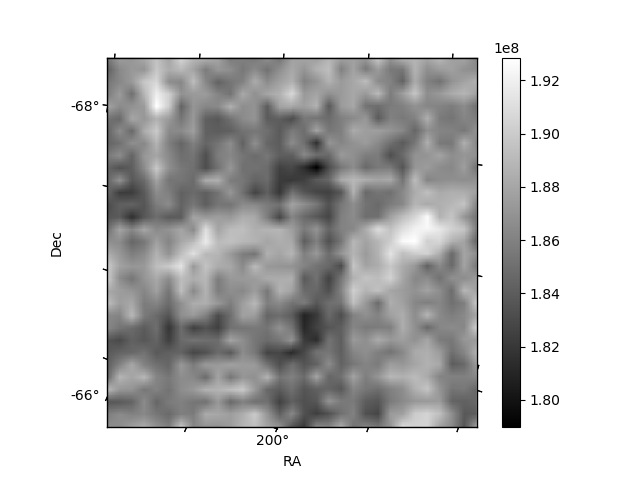
Histogram calculated using DETX and DETY for each event in the final _common_clean file
| Quadrant A | 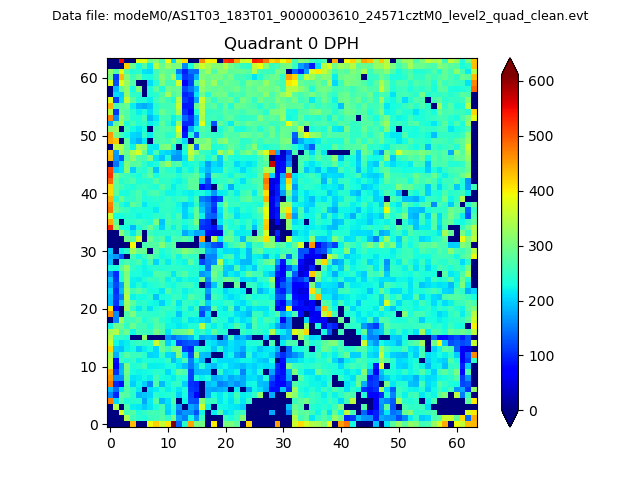 |
 |
Quadrant B |
|---|---|---|---|
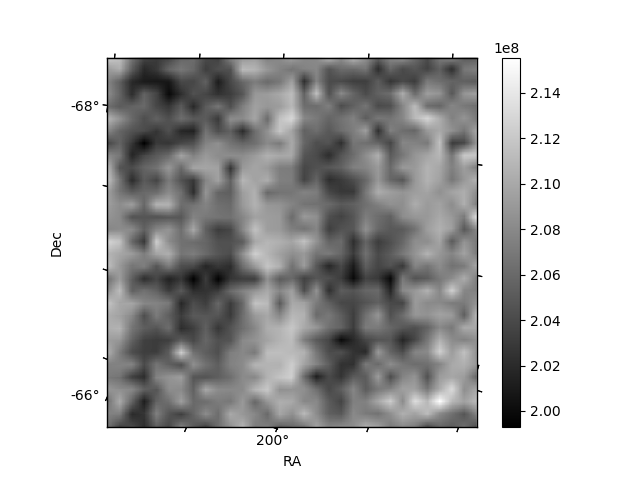
| Quadrant D | 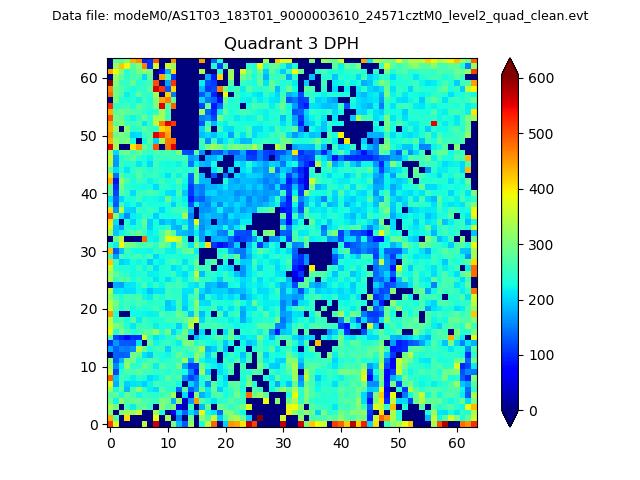 |
 |
Quadrant C |
| Plot type | Count rate plots | Images |
|---|---|---|
| Comparison with Poisson distribution Blue bars denote a histogram of data divided into 1 sec bins. Red curve is a Poisson curve with rate = median count rate of data. |
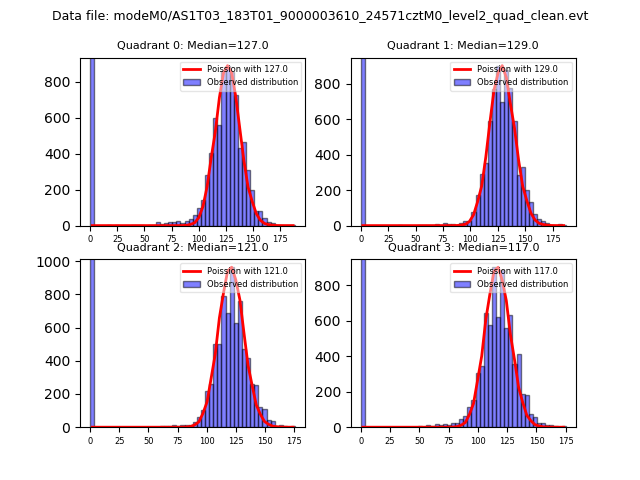 |
 |
| Quadrant-wise count rates Data is divided into 100 sec bins |
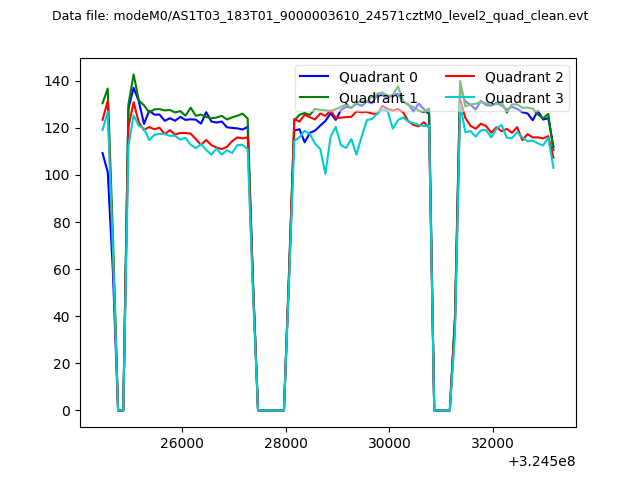 |
|
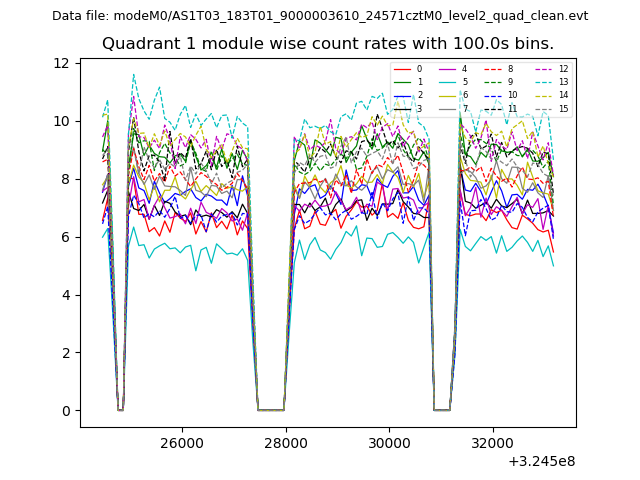
| Module-wise count rates for Quadrant A Data is divided into 100 sec bins |
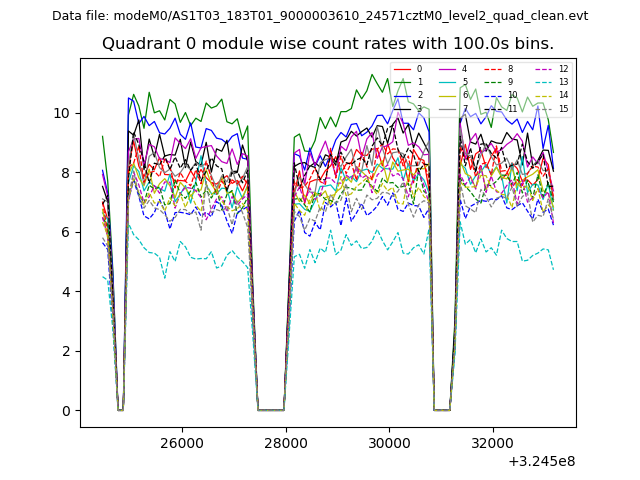 |
 |
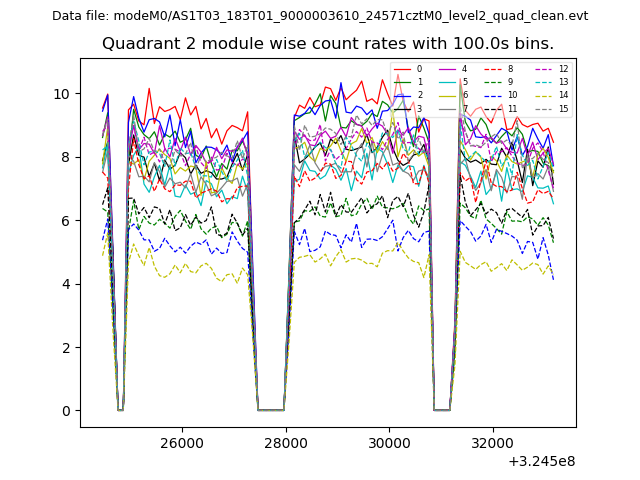
| Module-wise count rates for Quadrant B Data is divided into 100 sec bins |
 |
 |
| Module-wise count rates for Quadrant C Data is divided into 100 sec bins |
 |
 |
| Module-wise count rates for Quadrant D Data is divided into 100 sec bins |
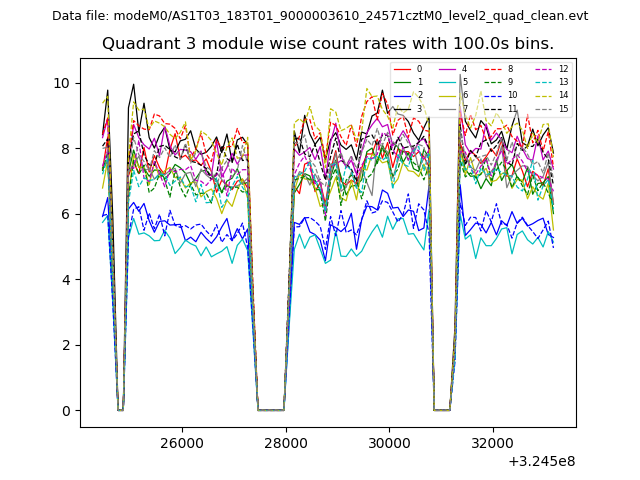 |
 |
| Parameter | Plot |
|---|---|
| CZT HV Monitor | 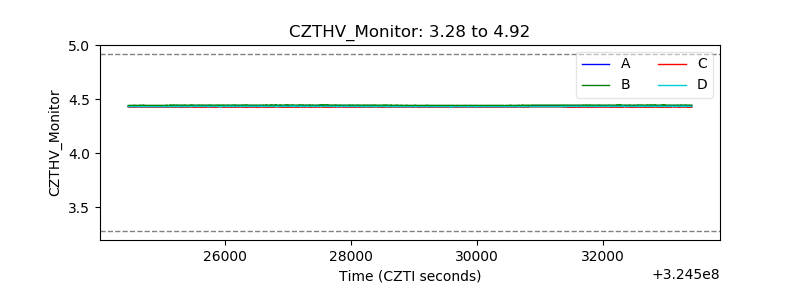 |
| D_VDD |  |
| Temperature 1 | 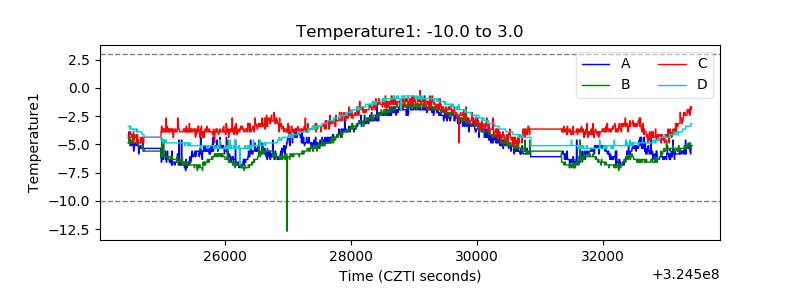 |
| Veto HV Monitor | 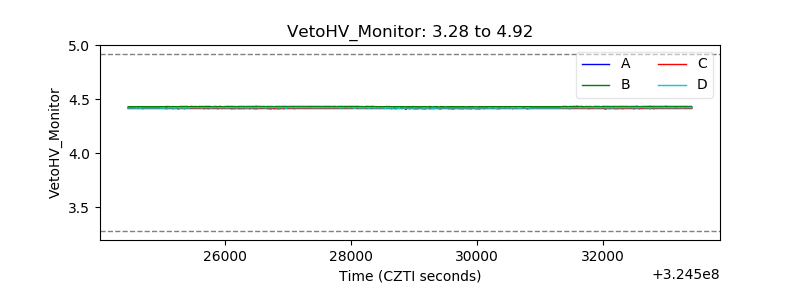 |
| Veto LLD | 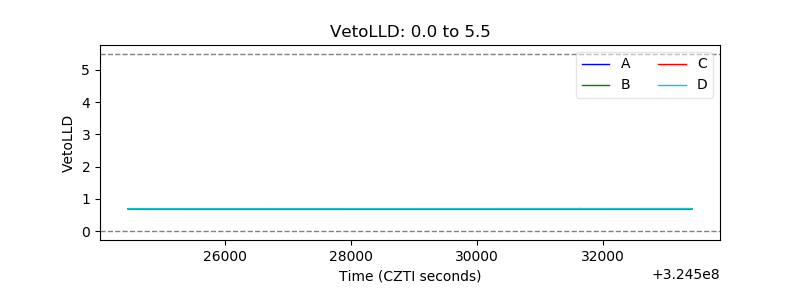 |
| Alpha Counter | 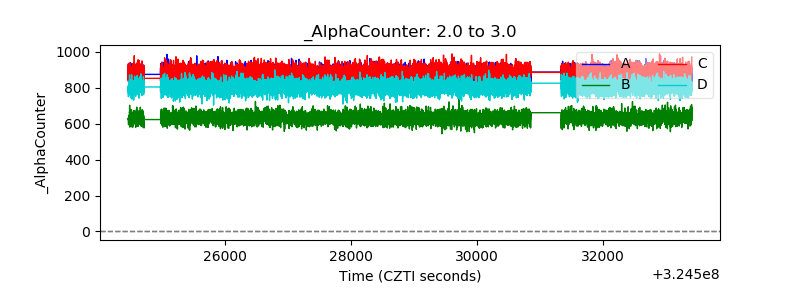 |
| _CPM_Rate | 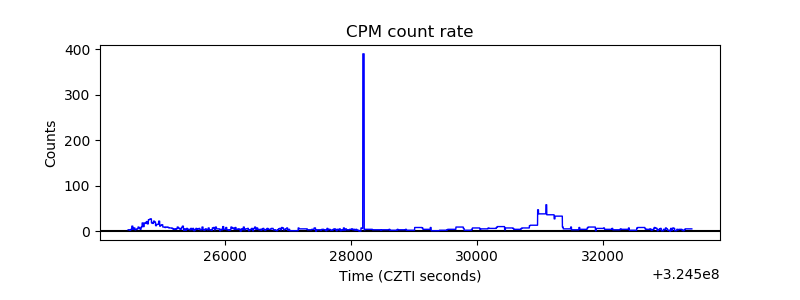 |
| CZT Counter |  |
| +2.5 Volts monitor |  |
| +5 Volts monitor |  |
| _ROLL_ROT | 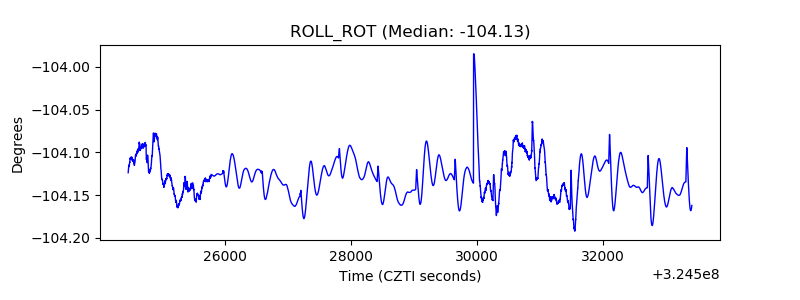 |
| _Roll_DEC | 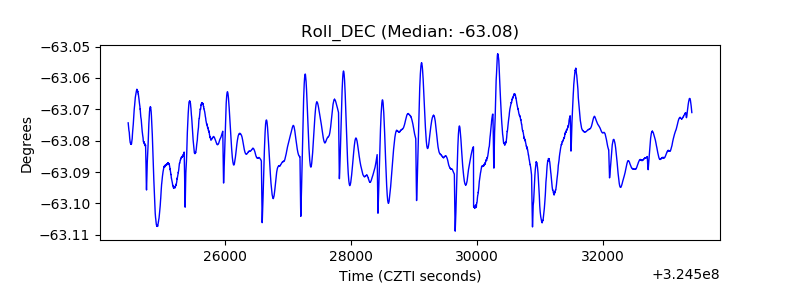 |
| _Roll_RA | 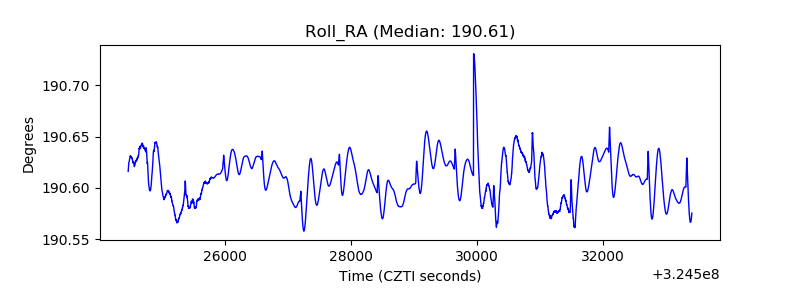 |
| Veto Counter | 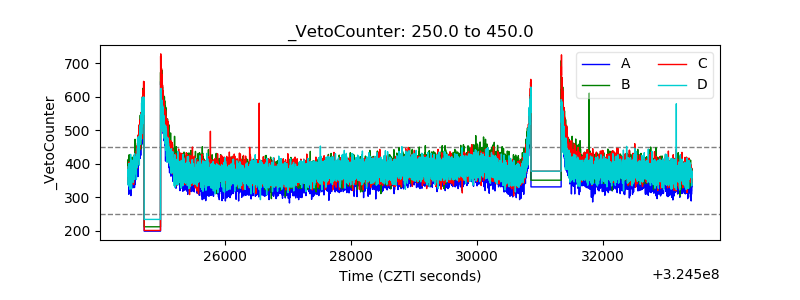 |