| Param | Original file | Final file |
|---|---|---|
| Filename | modeM0/AS1T03_183T01_9000003610_24572cztM0_level2.evt | modeM0/AS1T03_183T01_9000003610_24572cztM0_level2_quad_clean.evt |
| Size (bytes) | 812,715,840 | 179,026,560 |
| Size | 775.1 MB | 170.7 MB |
| Events in quadrant A | 5,162,201 | 1,189,917 |
| Events in quadrant B | 5,354,284 | 1,206,295 |
| Events in quadrant C | 5,409,063 | 1,146,776 |
| Events in quadrant D | 7,935,110 | 1,109,719 |
| Mode M0 | |||
|---|---|---|---|
| Quadrant | BADHDUFLAG | Total packets | Discarded packets |
| A | 0 | 22585 | 1 |
| B | 0 | 22946 | 1 |
| C | 0 | 22915 | 1 |
| D | 0 | 31115 | 1 |
| Mode SS | |||
|---|---|---|---|
| Quadrant | BADHDUFLAG | Total packets | Discarded packets |
| A | 0 | 226 | 0 |
| B | 0 | 226 | 0 |
| C | 0 | 226 | 0 |
| D | 0 | 226 | 0 |
| Mode M9 | |||
|---|---|---|---|
| Quadrant | BADHDUFLAG | Total packets | Discarded packets |
| A | 0 | 15 | 0 |
| B | 0 | 15 | 0 |
| C | 0 | 15 | 0 |
| D | 0 | 15 | 0 |
| Quadrant | Total seconds | Saturated seconds | Saturation percentage |
|---|---|---|---|
| A | 11118 | 106 | 0.953409% |
| B | 11119 | 135 | 1.214138% |
| C | 11119 | 174 | 1.564889% |
| D | 11119 | 273 | 2.455257% |
Noise dominated data is calculated using 1-second bins in cleaned event files. If a bin has >2000 counts, and if more than 50% of those come from <1% of pixels, then it is considered to be noise-dominated and hence unusable.
| Quadrant | # 1 sec bins | Bins with >0 counts | Bins with >2000 counts | High rate bins dominated by noise | Noise dominated (total time) | Noise dominated (detector-on time) | Marked lightcurve |
|---|---|---|---|---|---|---|---|
| A | 12589 | 11119 | 1 | 1 | 0.01% | 0.01% | 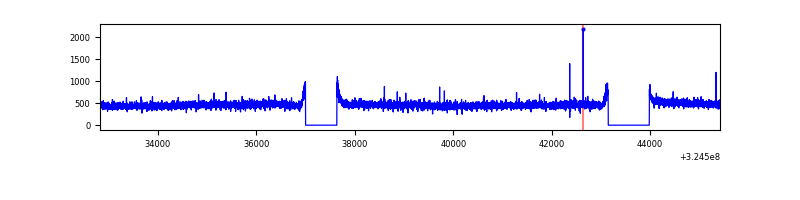 |
| B | 12590 | 11120 | 7 | 7 | 0.06% | 0.06% | 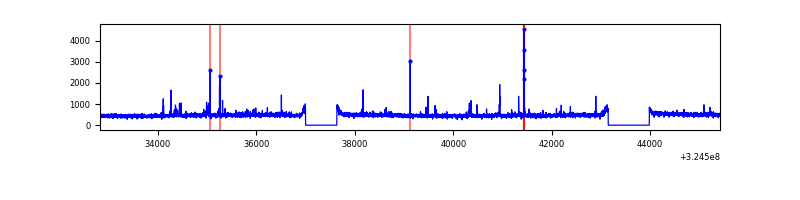 |
| C | 12590 | 11119 | 9 | 9 | 0.07% | 0.08% |  |
| D | 12590 | 11120 | 187 | 187 | 1.49% | 1.68% | 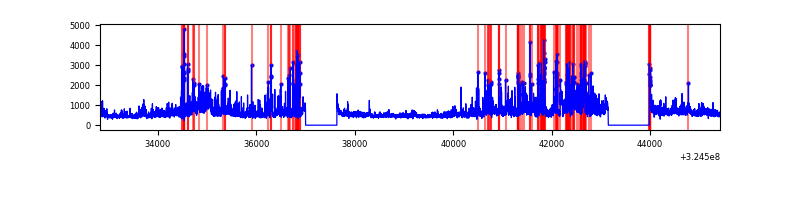 |
Top three noisy pixels from each quadrant. If the there are fewer than three noisy pixels in the level2.evt file, extra rows are filled as -1
| Pixel properties | Quadrant properties | ||||||
|---|---|---|---|---|---|---|---|
| Quadrant | DetID | PixID | Counts | Sigma | Mean | Median | Sigma |
| A | 13 | 254 | 17855 | 61.64 | 1337 | 1308 | 268.5 |
| A | 3 | 137 | 12057 | 40.04 | 1337 | 1308 | 268.5 |
| A | 0 | 226 | 11293 | 37.19 | 1337 | 1308 | 268.5 |
| B | 3 | 64 | 105389 | 411.08 | 1327 | 1289 | 253.2 |
| B | 12 | 111 | 30884 | 116.87 | 1327 | 1289 | 253.2 |
| B | 0 | 190 | 30156 | 113.99 | 1327 | 1289 | 253.2 |
| C | 14 | 238 | 201693 | 669.06 | 1281 | 1285 | 299.5 |
| C | 7 | 247 | 109262 | 360.48 | 1281 | 1285 | 299.5 |
| C | 2 | 16 | 75340 | 247.23 | 1281 | 1285 | 299.5 |
| D | 12 | 218 | 1182595 | 3785.99 | 1289 | 1249 | 312.0 |
| D | 8 | 195 | 1056836 | 3382.95 | 1289 | 1249 | 312.0 |
| D | 1 | 52 | 492335 | 1573.84 | 1289 | 1249 | 312.0 |
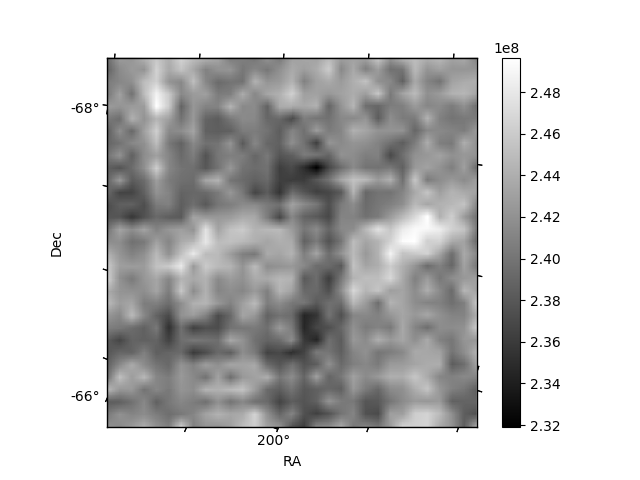
Histogram calculated using DETX and DETY for each event in the final _common_clean file
| Quadrant A |  |
 |
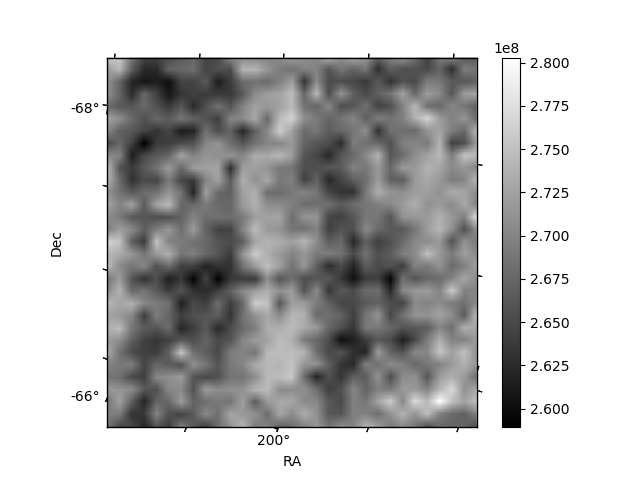
Quadrant B |
|---|---|---|---|
| Quadrant D | 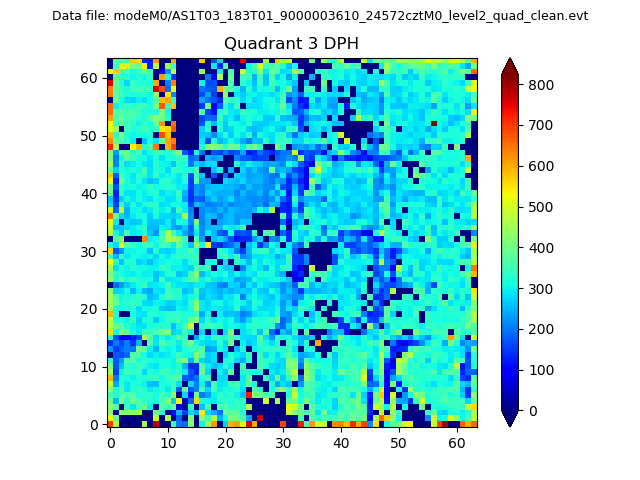 |
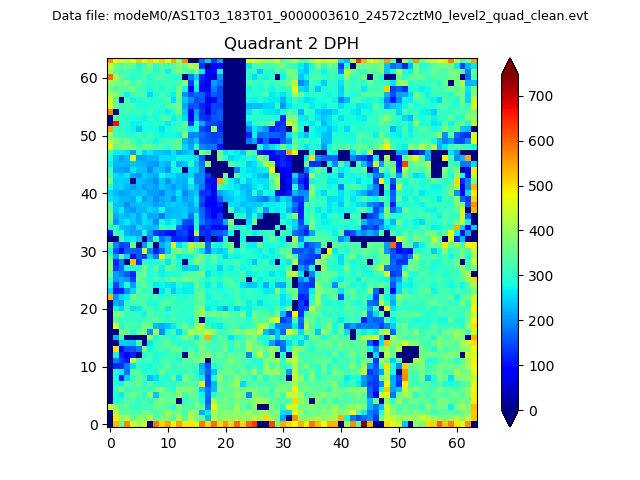 |
Quadrant C |
| Plot type | Count rate plots | Images |
|---|---|---|
| Comparison with Poisson distribution Blue bars denote a histogram of data divided into 1 sec bins. Red curve is a Poisson curve with rate = median count rate of data. |
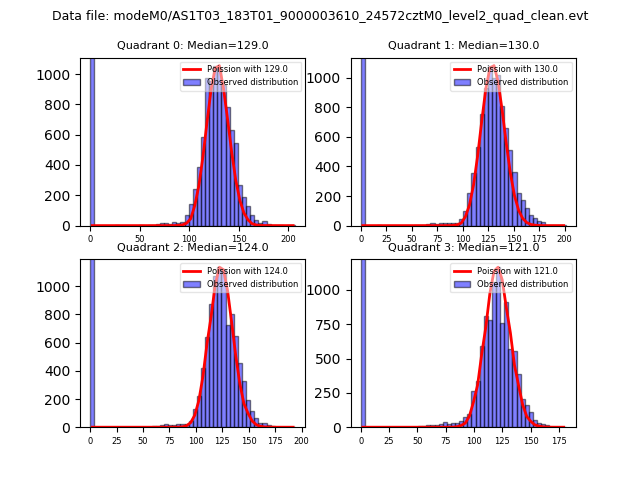 |
 |
| Quadrant-wise count rates Data is divided into 100 sec bins |
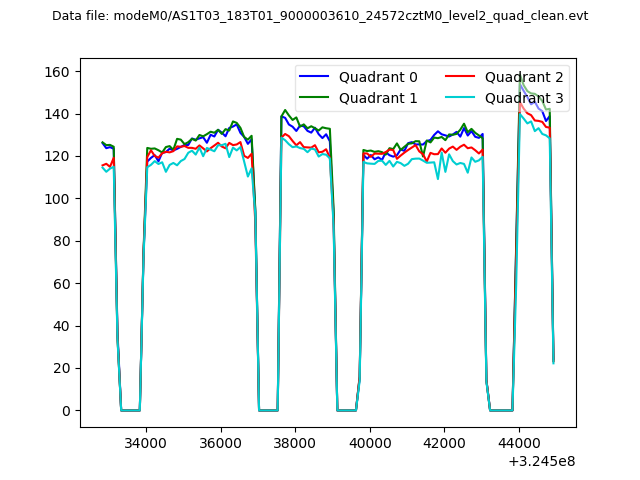 |
|
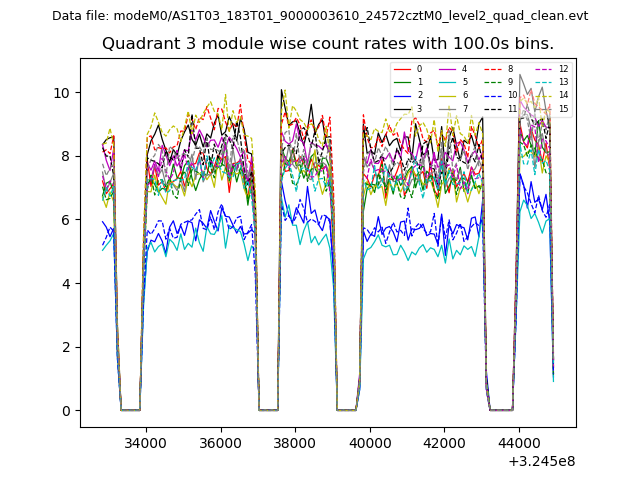
| Module-wise count rates for Quadrant A Data is divided into 100 sec bins |
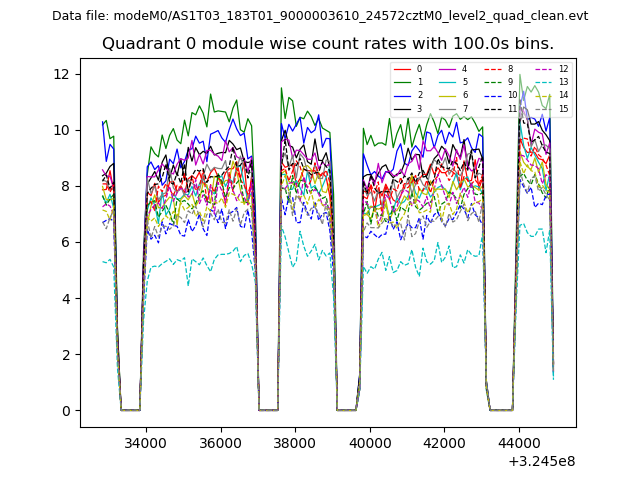 |
 |
| Module-wise count rates for Quadrant B Data is divided into 100 sec bins |
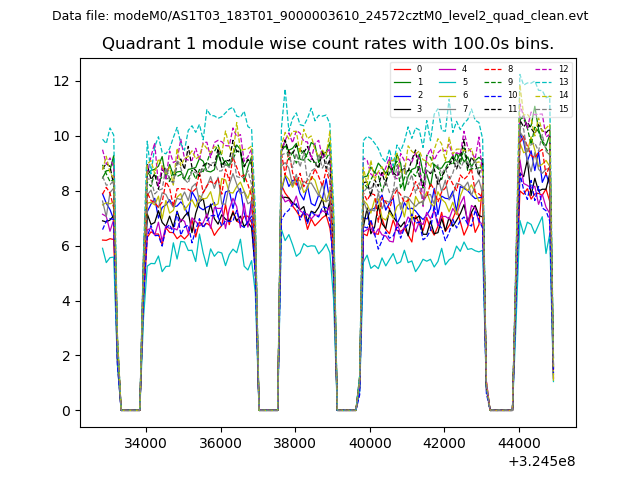 |
 |
| Module-wise count rates for Quadrant C Data is divided into 100 sec bins |
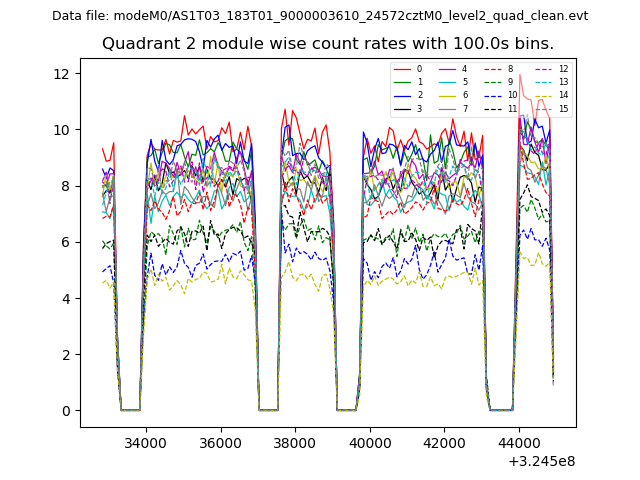 |
 |
| Module-wise count rates for Quadrant D Data is divided into 100 sec bins |
 |
 |
| Parameter | Plot |
|---|---|
| CZT HV Monitor | 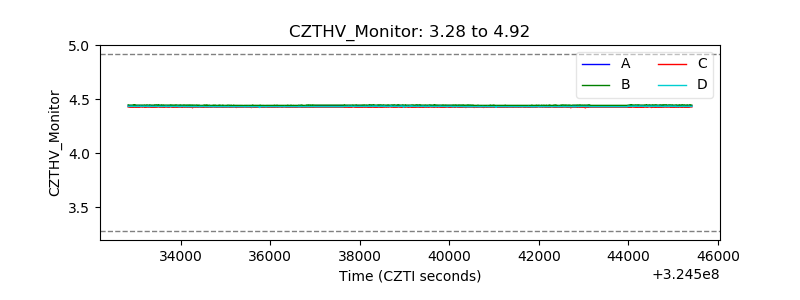 |
| D_VDD | 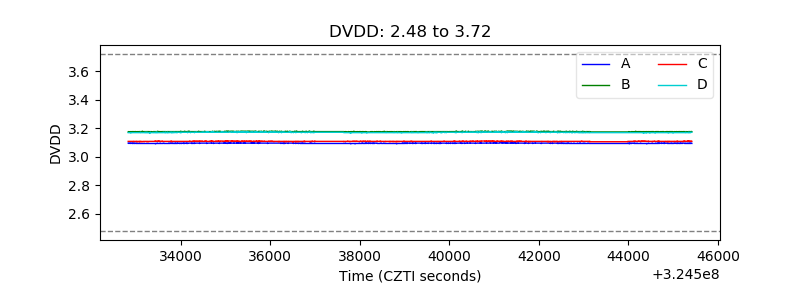 |
| Temperature 1 | 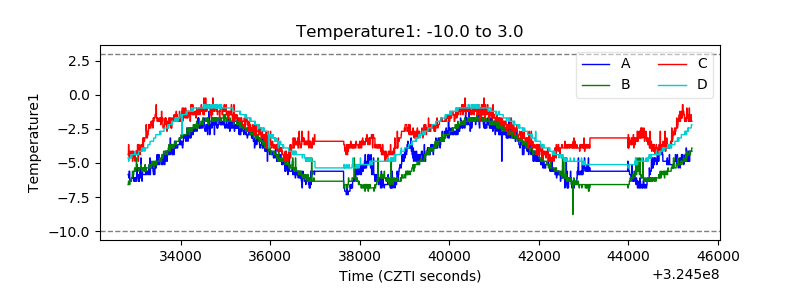 |
| Veto HV Monitor | 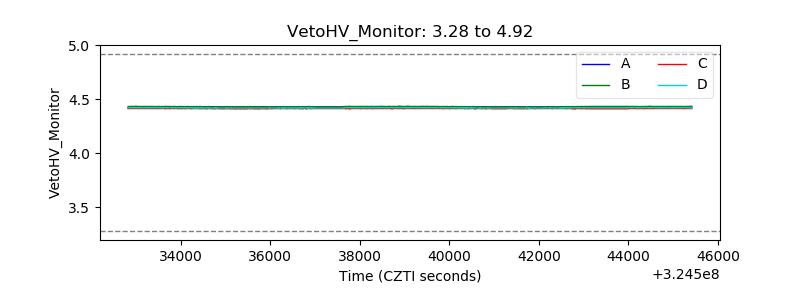 |
| Veto LLD | 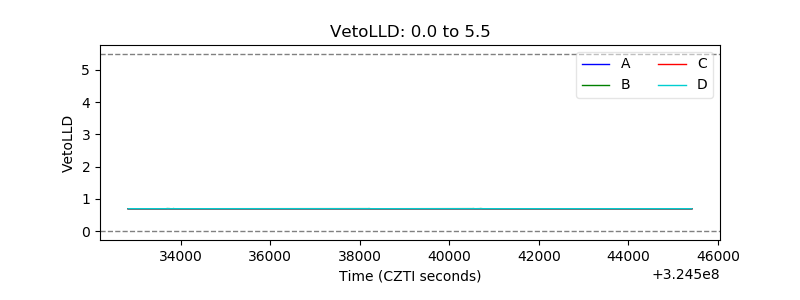 |
| Alpha Counter | 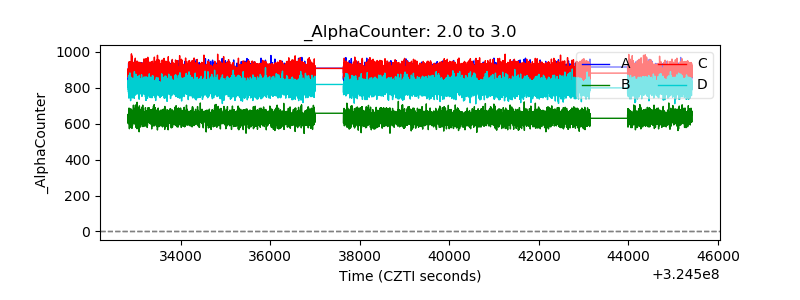 |
| _CPM_Rate | 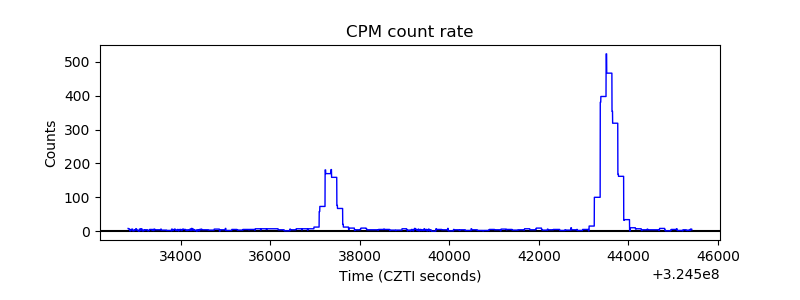 |
| CZT Counter | 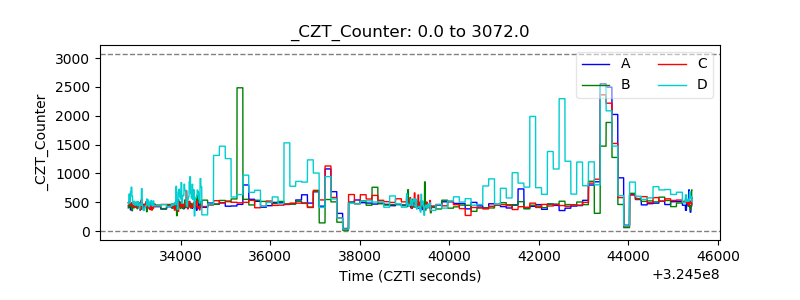 |
| +2.5 Volts monitor |  |
| +5 Volts monitor |  |
| _ROLL_ROT |  |
| _Roll_DEC | 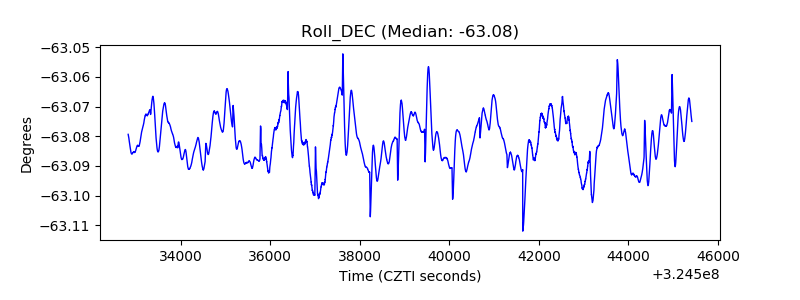 |
| _Roll_RA | 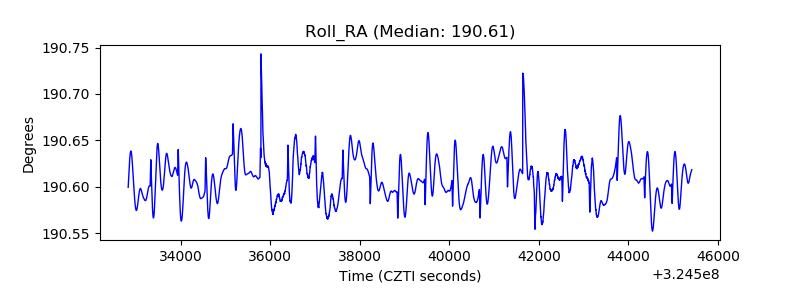 |
| Veto Counter | 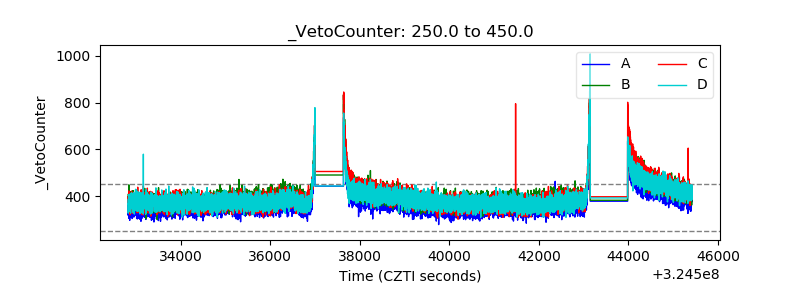 |