| Param | Original file | Final file |
|---|---|---|
| Filename | modeM0/AS1T03_183T01_9000003610_24573cztM0_level2.evt | modeM0/AS1T03_183T01_9000003610_24573cztM0_level2_quad_clean.evt |
| Size (bytes) | 445,720,320 | 92,715,840 |
| Size | 425.1 MB | 88.4 MB |
| Events in quadrant A | 2,872,605 | 609,349 |
| Events in quadrant B | 3,011,736 | 616,432 |
| Events in quadrant C | 3,041,217 | 588,969 |
| Events in quadrant D | 4,164,702 | 573,057 |
| Mode M0 | |||
|---|---|---|---|
| Quadrant | BADHDUFLAG | Total packets | Discarded packets |
| A | 0 | 12416 | 0 |
| B | 0 | 12760 | 0 |
| C | 0 | 12964 | 0 |
| D | 0 | 16531 | 0 |
| Mode SS | |||
|---|---|---|---|
| Quadrant | BADHDUFLAG | Total packets | Discarded packets |
| A | 0 | 122 | 0 |
| B | 0 | 122 | 0 |
| C | 0 | 122 | 0 |
| D | 0 | 122 | 0 |
| Mode M9 | |||
|---|---|---|---|
| Quadrant | BADHDUFLAG | Total packets | Discarded packets |
| A | 0 | 10 | 0 |
| B | 0 | 10 | 0 |
| C | 0 | 10 | 0 |
| D | 0 | 10 | 0 |
| Quadrant | Total seconds | Saturated seconds | Saturation percentage |
|---|---|---|---|
| A | 6014 | 51 | 0.848021% |
| B | 6014 | 77 | 1.280346% |
| C | 6014 | 98 | 1.629531% |
| D | 6014 | 106 | 1.762554% |
Noise dominated data is calculated using 1-second bins in cleaned event files. If a bin has >2000 counts, and if more than 50% of those come from <1% of pixels, then it is considered to be noise-dominated and hence unusable.
| Quadrant | # 1 sec bins | Bins with >0 counts | Bins with >2000 counts | High rate bins dominated by noise | Noise dominated (total time) | Noise dominated (detector-on time) | Marked lightcurve |
|---|---|---|---|---|---|---|---|
| A | 7004 | 6015 | 0 | 0 | 0.00% | 0.00% | 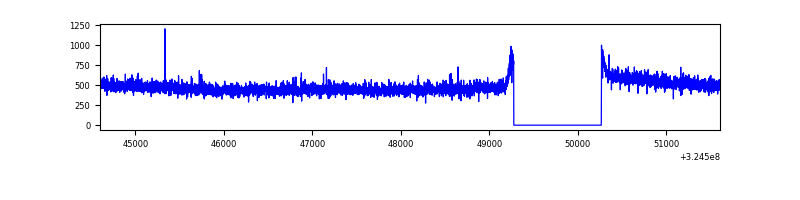 |
| B | 7004 | 6014 | 12 | 12 | 0.17% | 0.20% | 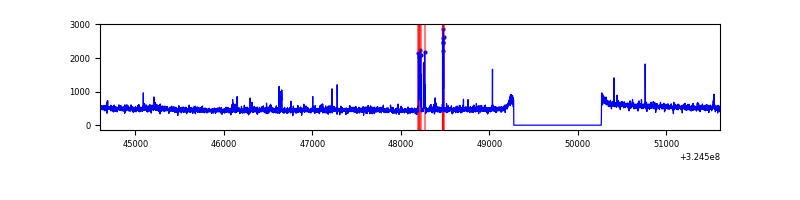 |
| C | 7004 | 6014 | 2 | 2 | 0.03% | 0.03% | 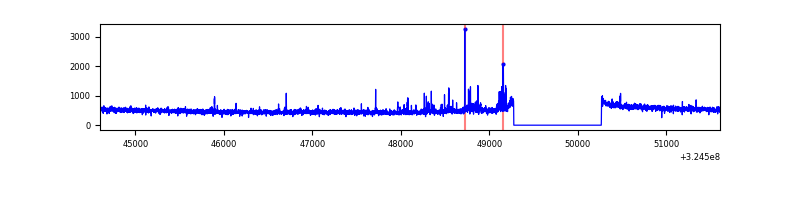 |
| D | 7004 | 6014 | 65 | 65 | 0.93% | 1.08% | 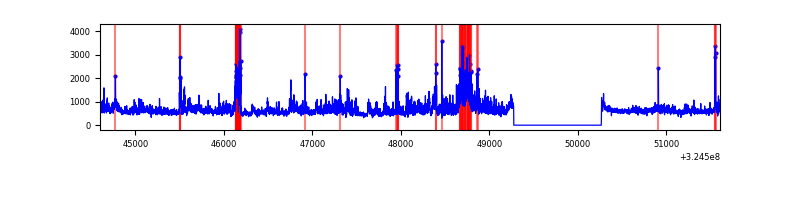 |
Top three noisy pixels from each quadrant. If the there are fewer than three noisy pixels in the level2.evt file, extra rows are filled as -1
| Pixel properties | Quadrant properties | ||||||
|---|---|---|---|---|---|---|---|
| Quadrant | DetID | PixID | Counts | Sigma | Mean | Median | Sigma |
| A | 13 | 254 | 9109 | 56.05 | 745 | 729 | 149.5 |
| A | 3 | 137 | 6611 | 39.34 | 745 | 729 | 149.5 |
| A | 0 | 226 | 6274 | 37.09 | 745 | 729 | 149.5 |
| B | 3 | 64 | 86881 | 614.98 | 737 | 720 | 140.1 |
| B | 12 | 111 | 16588 | 113.26 | 737 | 720 | 140.1 |
| B | 7 | 202 | 15903 | 108.37 | 737 | 720 | 140.1 |
| C | 14 | 238 | 114799 | 691.15 | 711 | 716 | 165.1 |
| C | 10 | 9 | 76901 | 461.55 | 711 | 716 | 165.1 |
| C | 7 | 247 | 31197 | 184.66 | 711 | 716 | 165.1 |
| D | 8 | 195 | 838815 | 4794.36 | 723 | 701 | 174.8 |
| D | 1 | 255 | 243133 | 1386.81 | 723 | 701 | 174.8 |
| D | 12 | 218 | 220095 | 1255.02 | 723 | 701 | 174.8 |
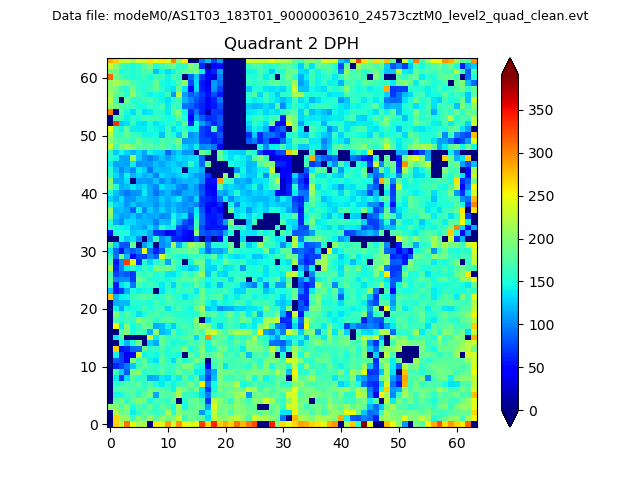
Histogram calculated using DETX and DETY for each event in the final _common_clean file
| Quadrant A |  |
 |
Quadrant B |
|---|---|---|---|
| Quadrant D |  |
 |
Quadrant C |
| Plot type | Count rate plots | Images |
|---|---|---|
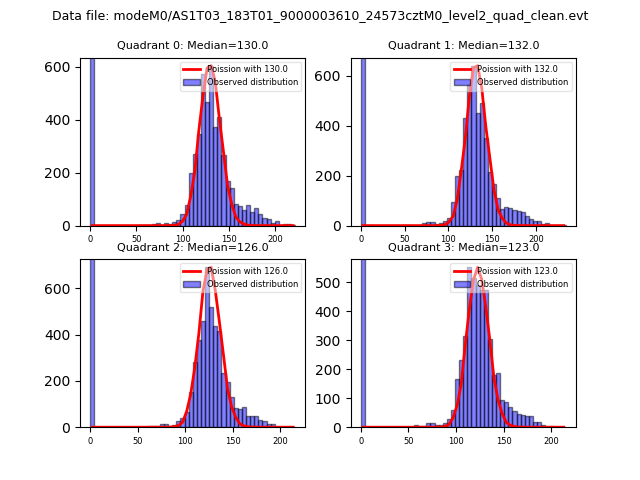
| Comparison with Poisson distribution Blue bars denote a histogram of data divided into 1 sec bins. Red curve is a Poisson curve with rate = median count rate of data. |
 |
 |
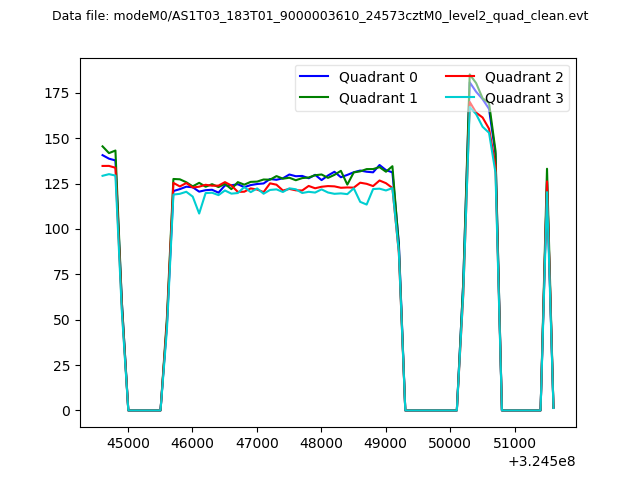
| Quadrant-wise count rates Data is divided into 100 sec bins |
 |
|
| Module-wise count rates for Quadrant A Data is divided into 100 sec bins |
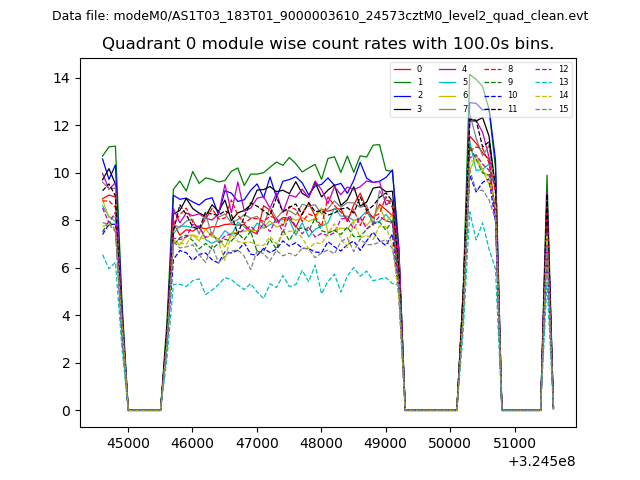 |
 |
| Module-wise count rates for Quadrant B Data is divided into 100 sec bins |
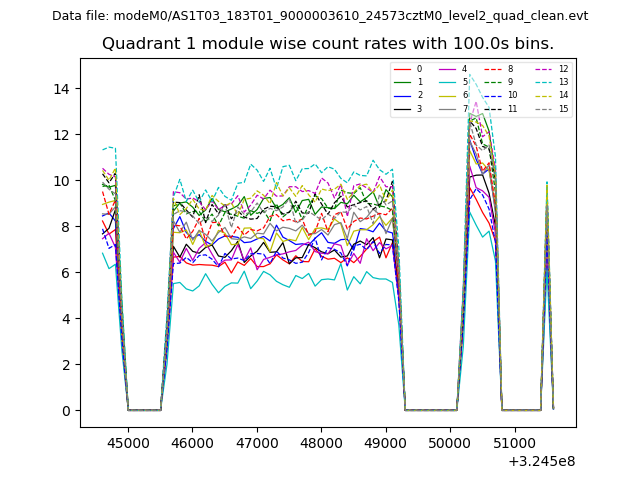 |
 |
| Module-wise count rates for Quadrant C Data is divided into 100 sec bins |
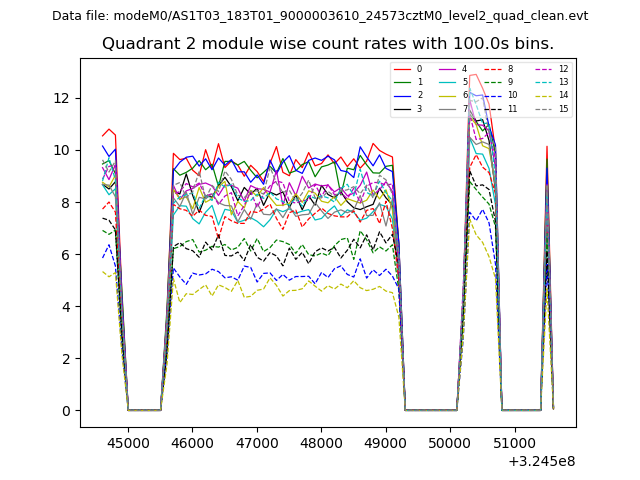 |
 |
| Module-wise count rates for Quadrant D Data is divided into 100 sec bins |
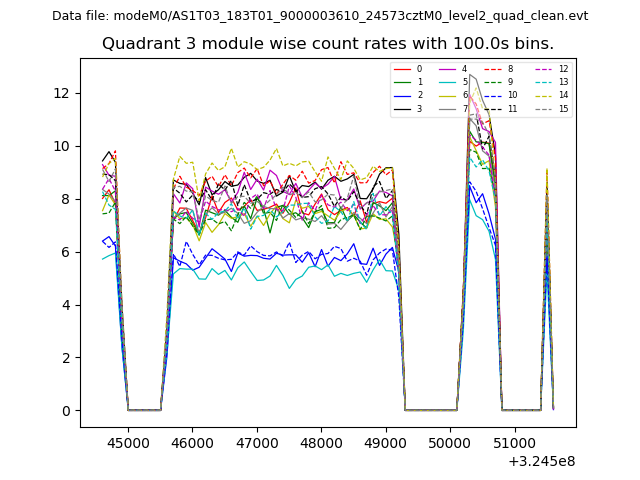 |
 |
| Parameter | Plot |
|---|---|
| CZT HV Monitor | 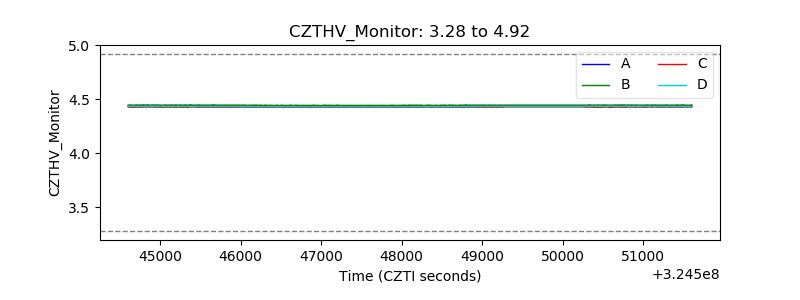 |
| D_VDD | 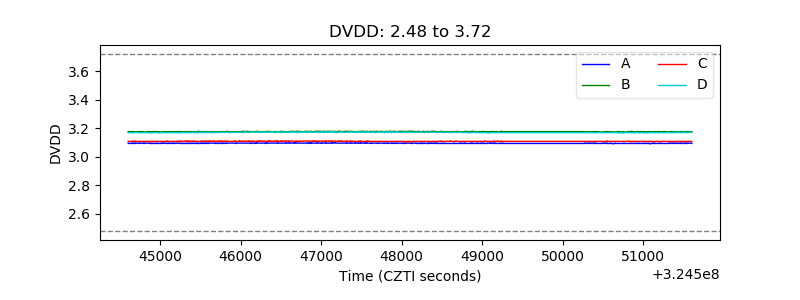 |
| Temperature 1 | 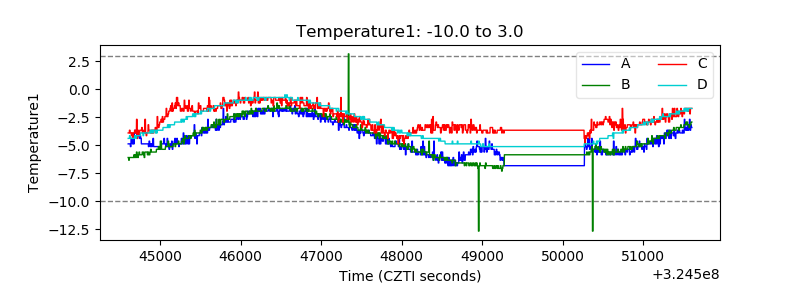 |
| Veto HV Monitor | 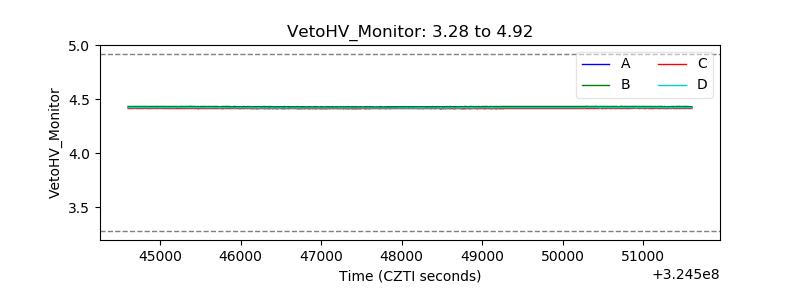 |
| Veto LLD | 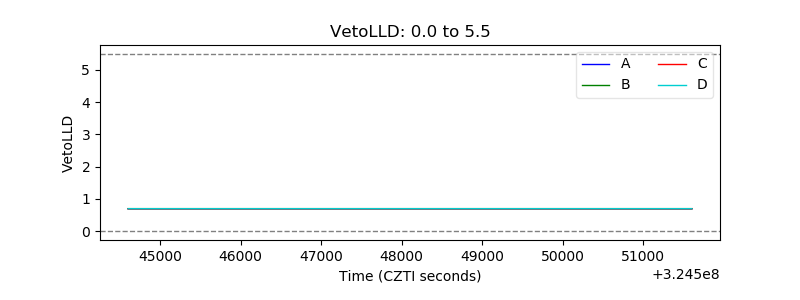 |
| Alpha Counter | 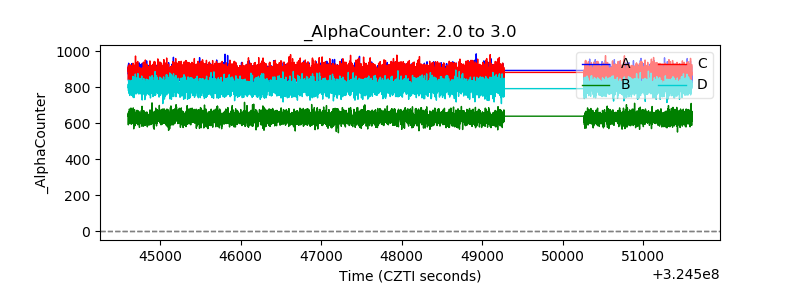 |
| _CPM_Rate | 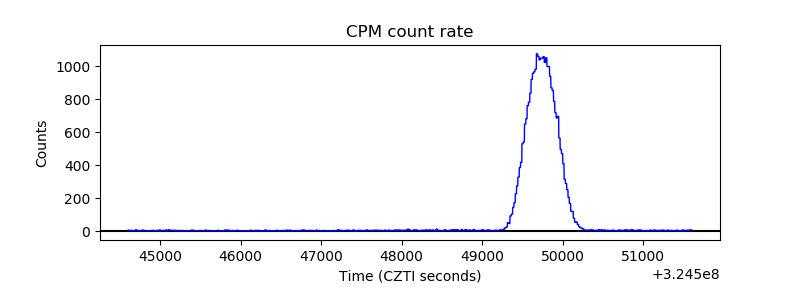 |
| CZT Counter | 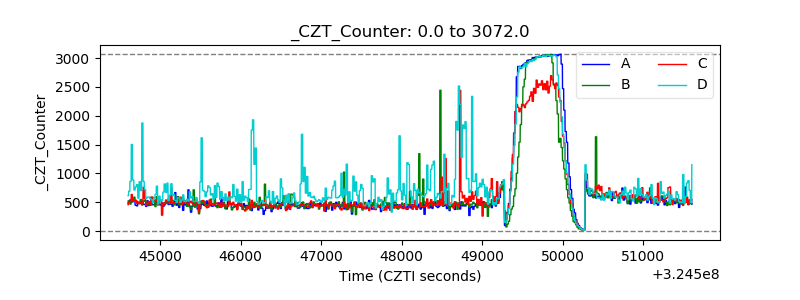 |
| +2.5 Volts monitor |  |
| +5 Volts monitor |  |
| _ROLL_ROT | 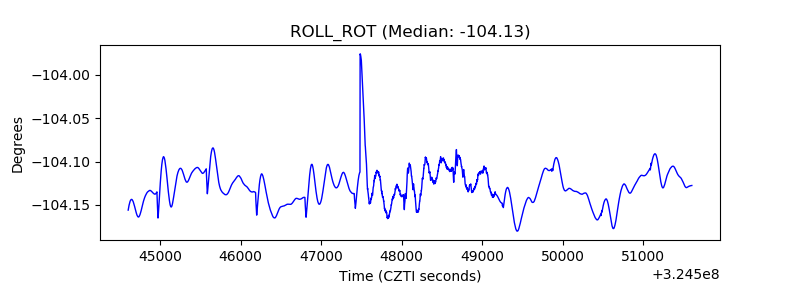 |
| _Roll_DEC | 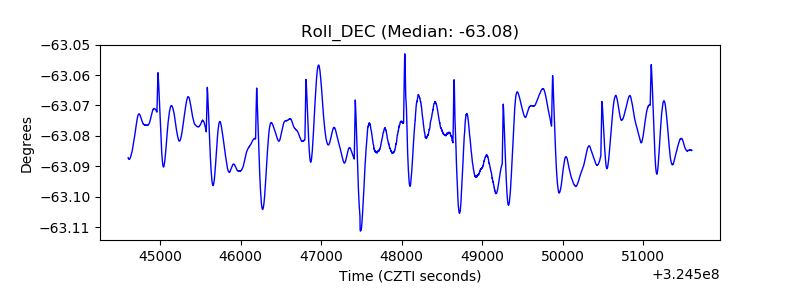 |
| _Roll_RA | 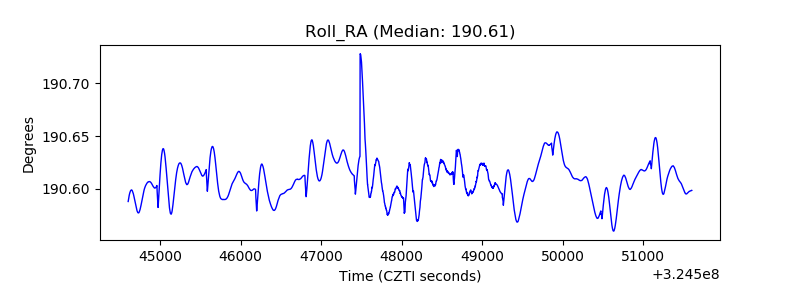 |
| Veto Counter | 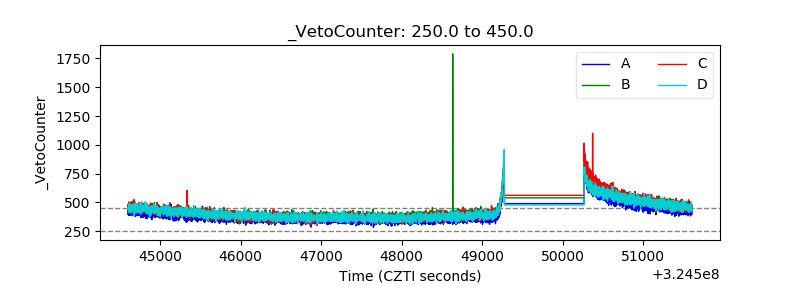 |