| Param | Original file | Final file |
|---|---|---|
| Filename | modeM0/AS1T03_183T01_9000003610_24575cztM0_level2.evt | modeM0/AS1T03_183T01_9000003610_24575cztM0_level2_quad_clean.evt |
| Size (bytes) | 481,089,600 | 100,350,720 |
| Size | 458.8 MB | 95.7 MB |
| Events in quadrant A | 3,134,648 | 666,054 |
| Events in quadrant B | 3,230,505 | 674,038 |
| Events in quadrant C | 3,500,099 | 637,933 |
| Events in quadrant D | 4,281,201 | 625,738 |
| Mode M0 | |||
|---|---|---|---|
| Quadrant | BADHDUFLAG | Total packets | Discarded packets |
| A | 0 | 13415 | 1 |
| B | 0 | 13620 | 1 |
| C | 0 | 14359 | 1 |
| D | 0 | 17258 | 1 |
| Mode SS | |||
|---|---|---|---|
| Quadrant | BADHDUFLAG | Total packets | Discarded packets |
| A | 0 | 126 | 0 |
| B | 0 | 126 | 0 |
| C | 0 | 126 | 0 |
| D | 0 | 126 | 0 |
| Mode M9 | |||
|---|---|---|---|
| Quadrant | BADHDUFLAG | Total packets | Discarded packets |
| A | 0 | 11 | 0 |
| B | 0 | 11 | 0 |
| C | 0 | 11 | 0 |
| D | 0 | 11 | 0 |
| Quadrant | Total seconds | Saturated seconds | Saturation percentage |
|---|---|---|---|
| A | 6242 | 78 | 1.249599% |
| B | 6243 | 93 | 1.489668% |
| C | 6243 | 148 | 2.370655% |
| D | 6243 | 84 | 1.345507% |
Noise dominated data is calculated using 1-second bins in cleaned event files. If a bin has >2000 counts, and if more than 50% of those come from <1% of pixels, then it is considered to be noise-dominated and hence unusable.
| Quadrant | # 1 sec bins | Bins with >0 counts | Bins with >2000 counts | High rate bins dominated by noise | Noise dominated (total time) | Noise dominated (detector-on time) | Marked lightcurve |
|---|---|---|---|---|---|---|---|
| A | 7357 | 6242 | 0 | 0 | 0.00% | 0.00% | 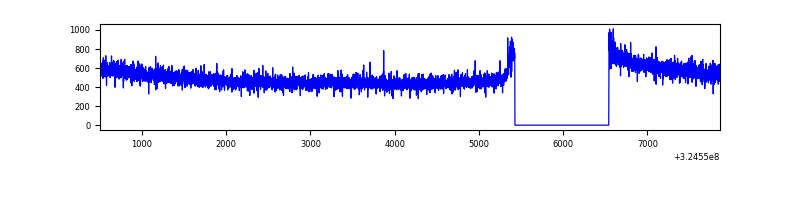 |
| B | 7358 | 6243 | 16 | 16 | 0.22% | 0.26% | 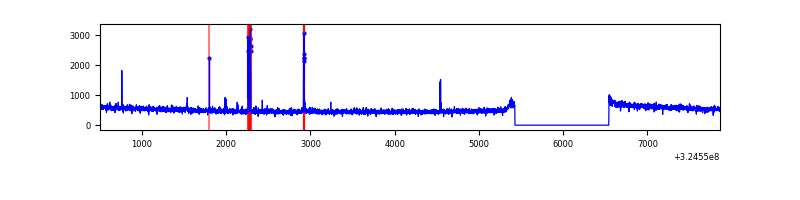 |
| C | 7358 | 6243 | 25 | 25 | 0.34% | 0.40% | 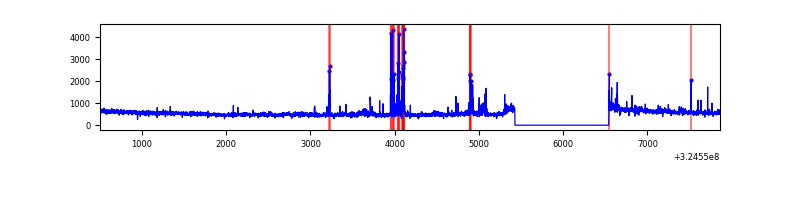 |
| D | 7358 | 6243 | 14 | 14 | 0.19% | 0.22% | 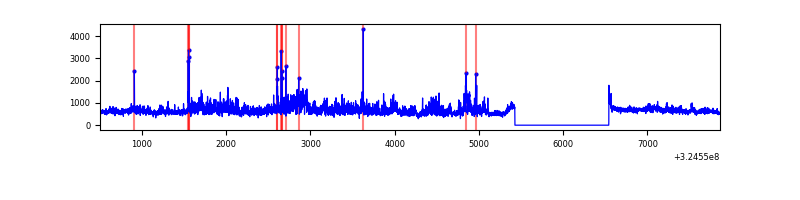 |
Top three noisy pixels from each quadrant. If the there are fewer than three noisy pixels in the level2.evt file, extra rows are filled as -1
| Pixel properties | Quadrant properties | ||||||
|---|---|---|---|---|---|---|---|
| Quadrant | DetID | PixID | Counts | Sigma | Mean | Median | Sigma |
| A | 13 | 254 | 9860 | 56.21 | 813 | 795 | 161.3 |
| A | 0 | 226 | 7149 | 39.4 | 813 | 795 | 161.3 |
| A | 3 | 137 | 7011 | 38.54 | 813 | 795 | 161.3 |
| B | 3 | 64 | 66601 | 439.23 | 801 | 780 | 149.9 |
| B | 12 | 111 | 17703 | 112.93 | 801 | 780 | 149.9 |
| B | 11 | 111 | 15710 | 99.63 | 801 | 780 | 149.9 |
| C | 10 | 9 | 209577 | 1182.8 | 771 | 776 | 176.5 |
| C | 14 | 238 | 126965 | 714.83 | 771 | 776 | 176.5 |
| C | 7 | 247 | 79253 | 444.55 | 771 | 776 | 176.5 |
| D | 8 | 195 | 950036 | 5106.52 | 786 | 764 | 185.9 |
| D | 12 | 218 | 217750 | 1167.26 | 786 | 764 | 185.9 |
| D | 7 | 238 | 61766 | 328.15 | 786 | 764 | 185.9 |
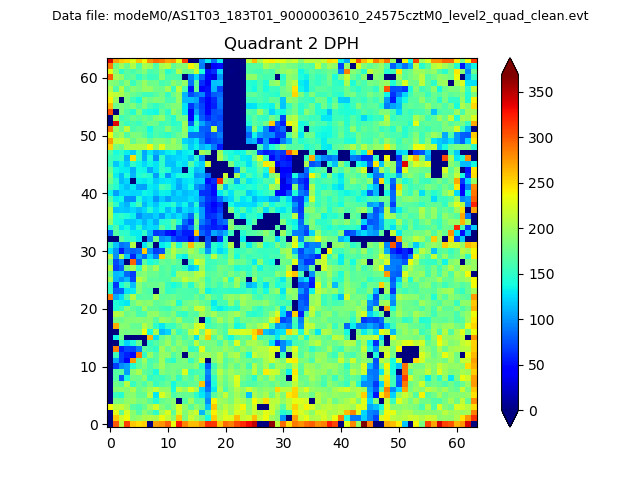
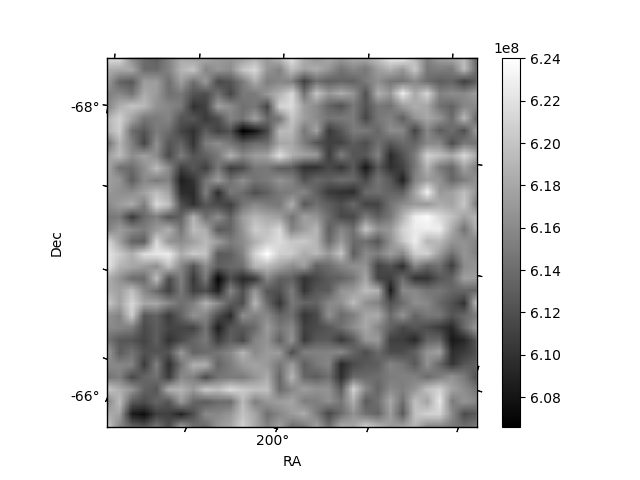
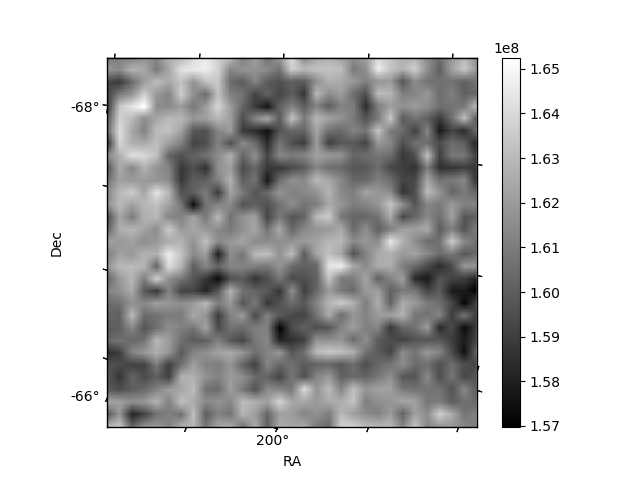
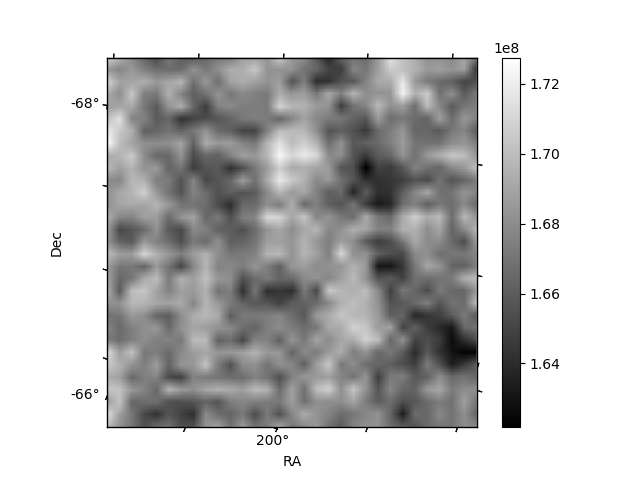
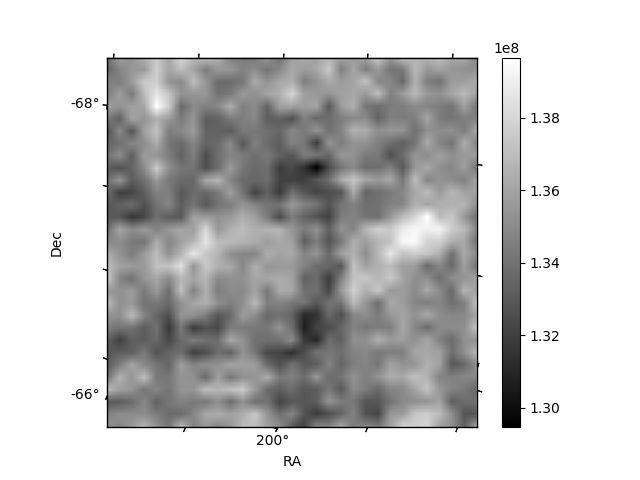
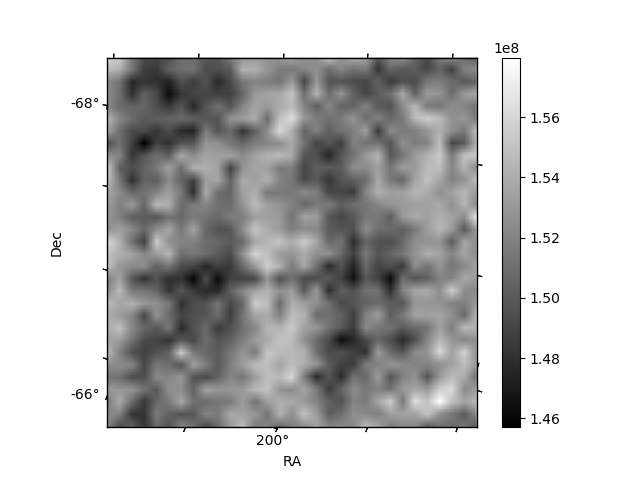
Histogram calculated using DETX and DETY for each event in the final _common_clean file
| Quadrant A | 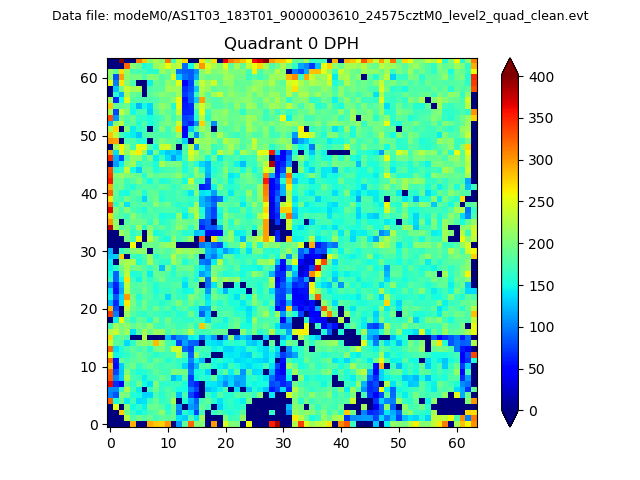 |
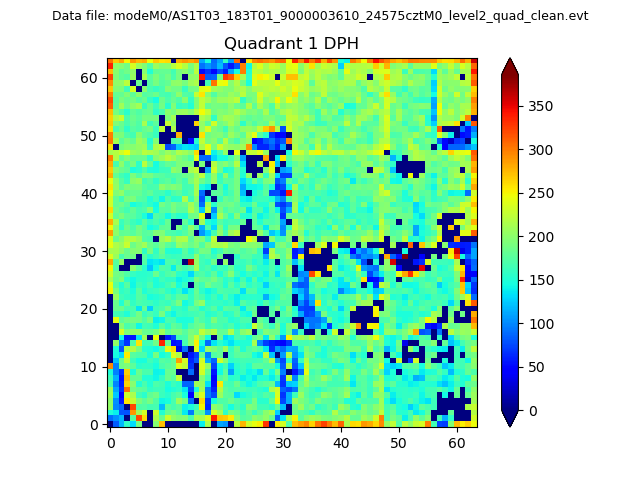 |
Quadrant B |
|---|---|---|---|
| Quadrant D | 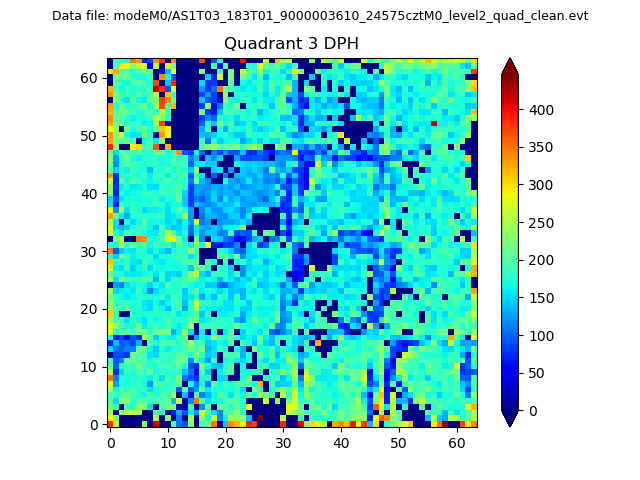 |
 |
Quadrant C |
| Plot type | Count rate plots | Images |
|---|---|---|
| Comparison with Poisson distribution Blue bars denote a histogram of data divided into 1 sec bins. Red curve is a Poisson curve with rate = median count rate of data. |
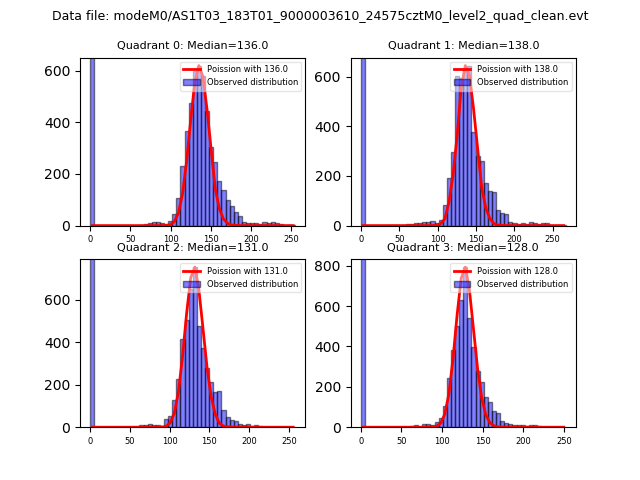 |
 |
| Quadrant-wise count rates Data is divided into 100 sec bins |
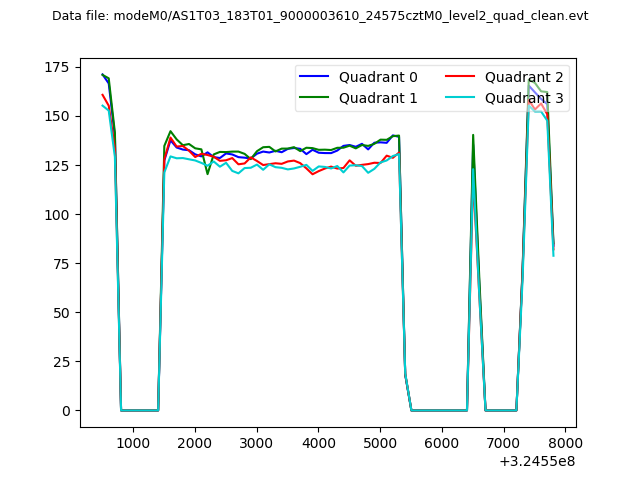 |
|
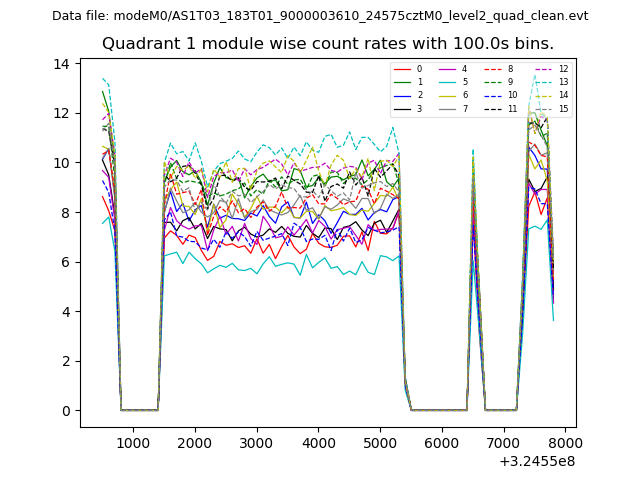
| Module-wise count rates for Quadrant A Data is divided into 100 sec bins |
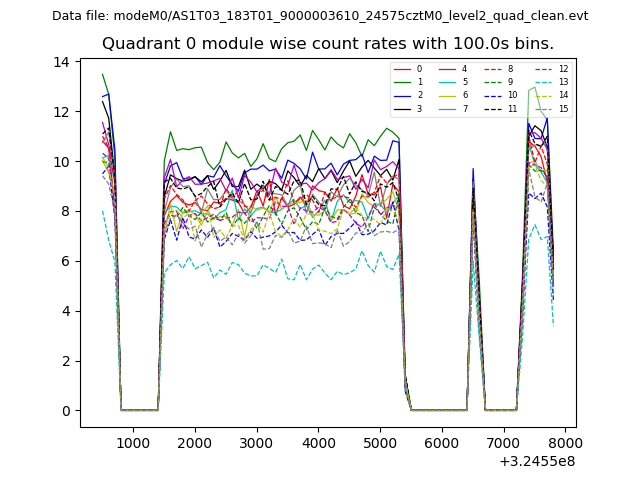 |
 |
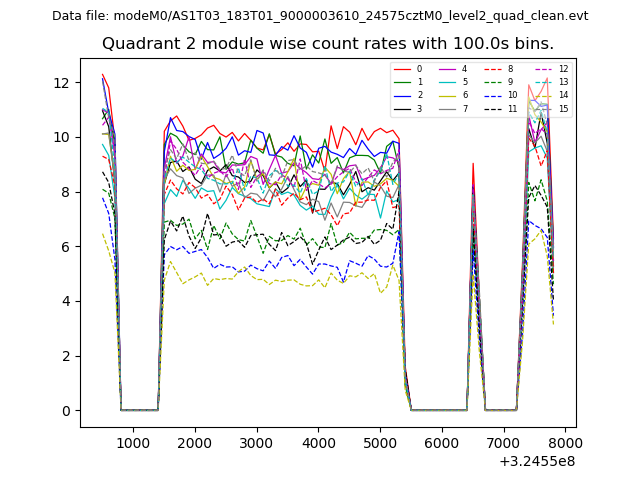
| Module-wise count rates for Quadrant B Data is divided into 100 sec bins |
 |
 |
| Module-wise count rates for Quadrant C Data is divided into 100 sec bins |
 |
 |
| Module-wise count rates for Quadrant D Data is divided into 100 sec bins |
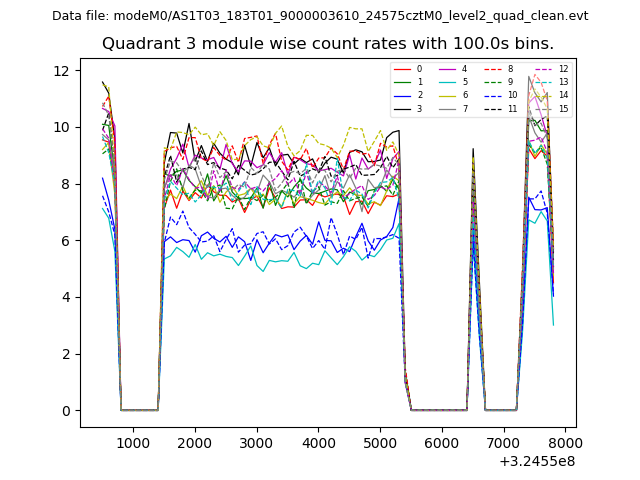 |
 |
| Parameter | Plot |
|---|---|
| CZT HV Monitor | 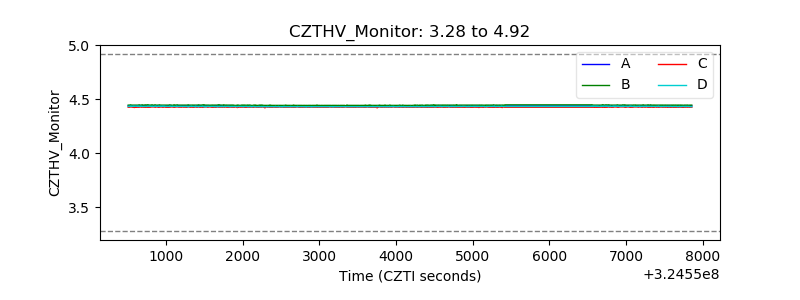 |
| D_VDD | 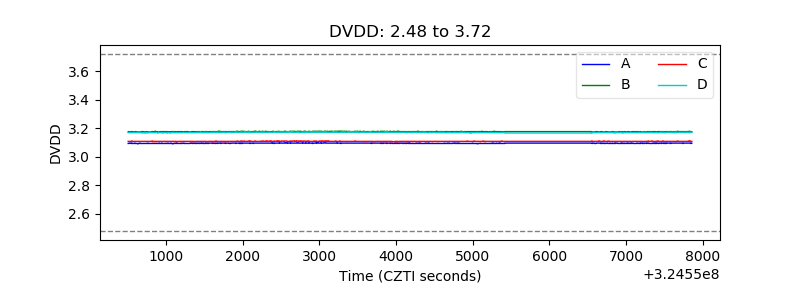 |
| Temperature 1 | 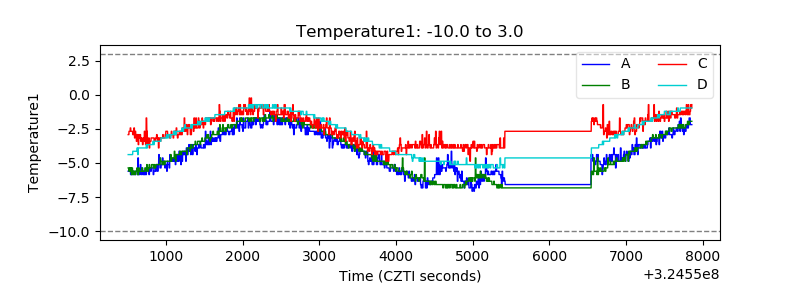 |
| Veto HV Monitor | 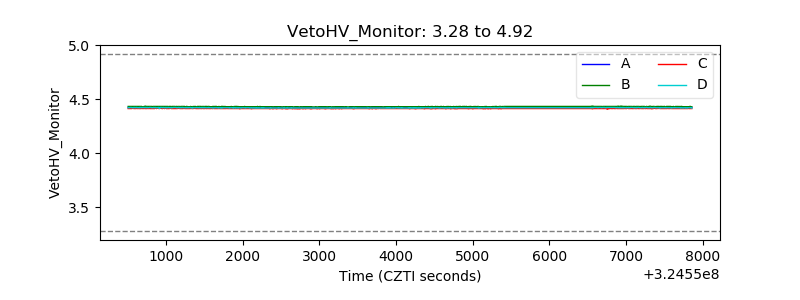 |
| Veto LLD | 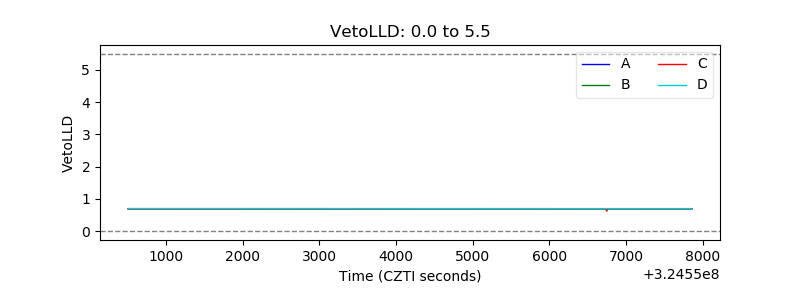 |
| Alpha Counter | 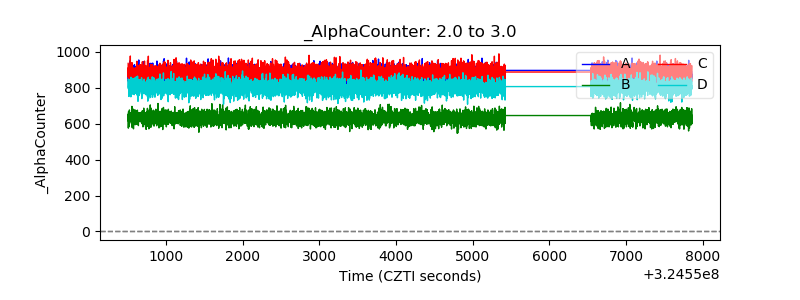 |
| _CPM_Rate | 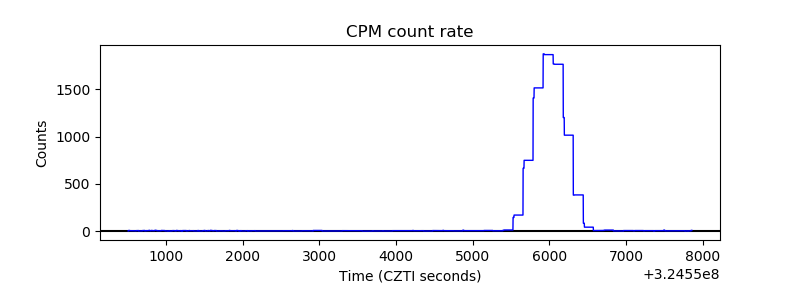 |
| CZT Counter | 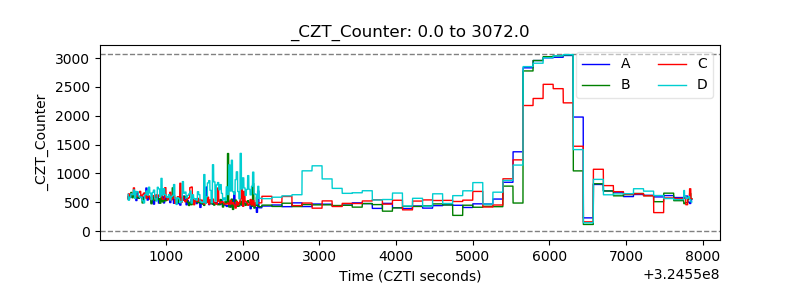 |
| +2.5 Volts monitor |  |
| +5 Volts monitor |  |
| _ROLL_ROT |  |
| _Roll_DEC | 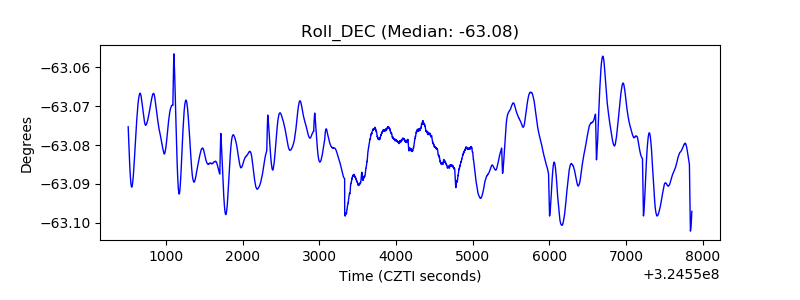 |
| _Roll_RA | 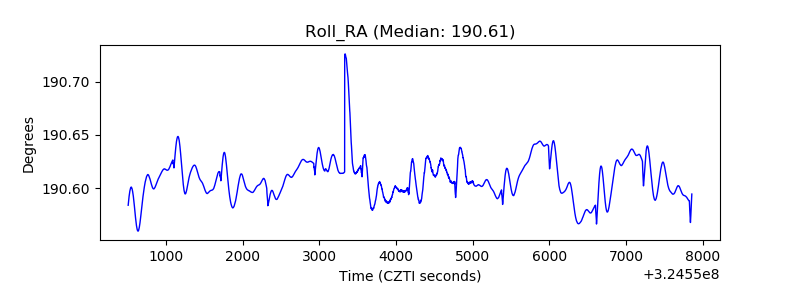 |
| Veto Counter | 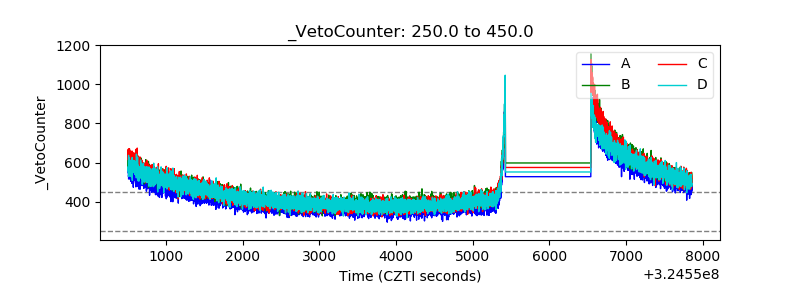 |