| Param | Original file | Final file |
|---|---|---|
| Filename | modeM0/AS1T03_183T01_9000003610_24576cztM0_level2.evt | modeM0/AS1T03_183T01_9000003610_24576cztM0_level2_quad_clean.evt |
| Size (bytes) | 558,267,840 | 121,199,040 |
| Size | 532.4 MB | 115.6 MB |
| Events in quadrant A | 3,519,641 | 829,259 |
| Events in quadrant B | 3,550,219 | 837,104 |
| Events in quadrant C | 4,767,418 | 774,918 |
| Events in quadrant D | 4,623,583 | 769,986 |
| Mode M0 | |||
|---|---|---|---|
| Quadrant | BADHDUFLAG | Total packets | Discarded packets |
| A | 0 | 14867 | 1 |
| B | 0 | 14922 | 1 |
| C | 0 | 18715 | 1 |
| D | 0 | 18305 | 1 |
| Mode SS | |||
|---|---|---|---|
| Quadrant | BADHDUFLAG | Total packets | Discarded packets |
| A | 0 | 132 | 0 |
| B | 0 | 132 | 0 |
| C | 0 | 132 | 0 |
| D | 0 | 132 | 0 |
| Mode M9 | |||
|---|---|---|---|
| Quadrant | BADHDUFLAG | Total packets | Discarded packets |
| A | 0 | 13 | 0 |
| B | 0 | 13 | 0 |
| C | 0 | 13 | 0 |
| D | 0 | 13 | 0 |
| Quadrant | Total seconds | Saturated seconds | Saturation percentage |
|---|---|---|---|
| A | 6597 | 84 | 1.273306% |
| B | 6598 | 95 | 1.439830% |
| C | 6598 | 292 | 4.425584% |
| D | 6598 | 163 | 2.470446% |
Noise dominated data is calculated using 1-second bins in cleaned event files. If a bin has >2000 counts, and if more than 50% of those come from <1% of pixels, then it is considered to be noise-dominated and hence unusable.
| Quadrant | # 1 sec bins | Bins with >0 counts | Bins with >2000 counts | High rate bins dominated by noise | Noise dominated (total time) | Noise dominated (detector-on time) | Marked lightcurve |
|---|---|---|---|---|---|---|---|
| A | 7817 | 6597 | 0 | 0 | 0.00% | 0.00% | 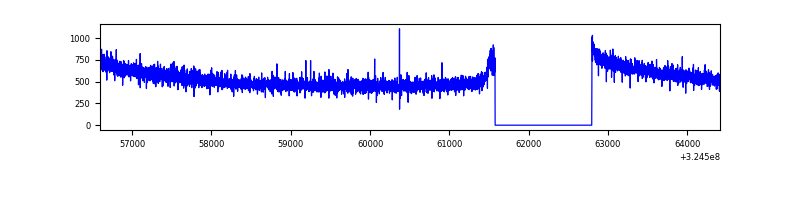 |
| B | 7818 | 6598 | 0 | 0 | 0.00% | 0.00% | 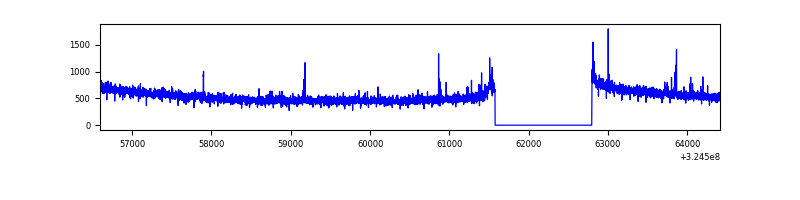 |
| C | 7818 | 6598 | 79 | 79 | 1.01% | 1.20% | 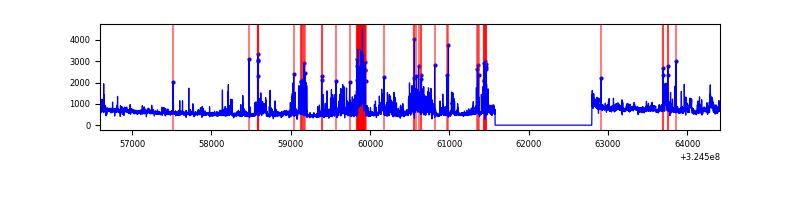 |
| D | 7818 | 6599 | 62 | 62 | 0.79% | 0.94% |  |
Top three noisy pixels from each quadrant. If the there are fewer than three noisy pixels in the level2.evt file, extra rows are filled as -1
| Pixel properties | Quadrant properties | ||||||
|---|---|---|---|---|---|---|---|
| Quadrant | DetID | PixID | Counts | Sigma | Mean | Median | Sigma |
| A | 13 | 254 | 11231 | 58.03 | 912 | 896 | 178.1 |
| A | 0 | 226 | 7973 | 39.74 | 912 | 896 | 178.1 |
| A | 3 | 137 | 7459 | 36.85 | 912 | 896 | 178.1 |
| B | 12 | 111 | 18884 | 109.26 | 897 | 876 | 164.8 |
| B | 3 | 64 | 18820 | 108.88 | 897 | 876 | 164.8 |
| B | 0 | 190 | 17868 | 103.1 | 897 | 876 | 164.8 |
| C | 10 | 9 | 673501 | 3489.05 | 849 | 856 | 192.8 |
| C | 2 | 16 | 317220 | 1641.0 | 849 | 856 | 192.8 |
| C | 7 | 247 | 298170 | 1542.18 | 849 | 856 | 192.8 |
| D | 12 | 218 | 619427 | 2999.35 | 870 | 848 | 206.2 |
| D | 8 | 195 | 545530 | 2641.04 | 870 | 848 | 206.2 |
| D | 7 | 238 | 99284 | 477.29 | 870 | 848 | 206.2 |
Histogram calculated using DETX and DETY for each event in the final _common_clean file
| Quadrant A |  |
 |
Quadrant B |
|---|---|---|---|
| Quadrant D | 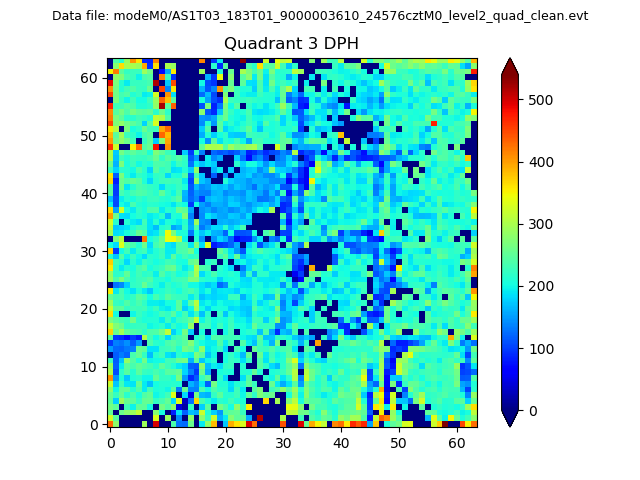 |
 |
Quadrant C |
| Plot type | Count rate plots | Images |
|---|---|---|
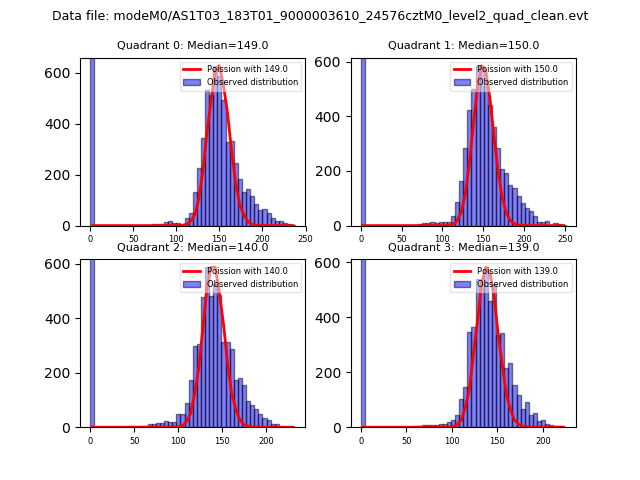
| Comparison with Poisson distribution Blue bars denote a histogram of data divided into 1 sec bins. Red curve is a Poisson curve with rate = median count rate of data. |
 |
 |
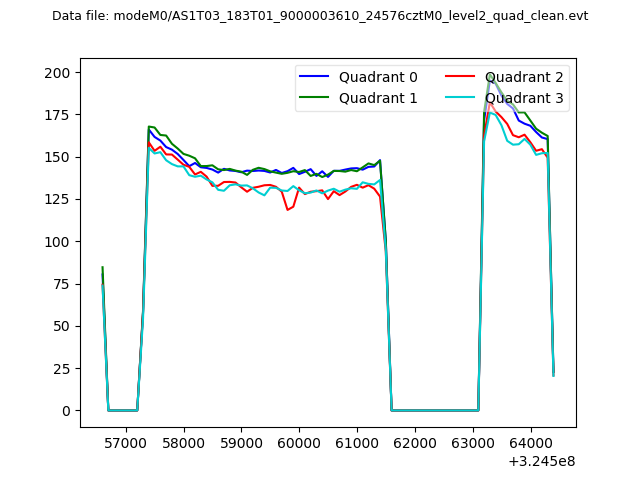
| Quadrant-wise count rates Data is divided into 100 sec bins |
 |
|
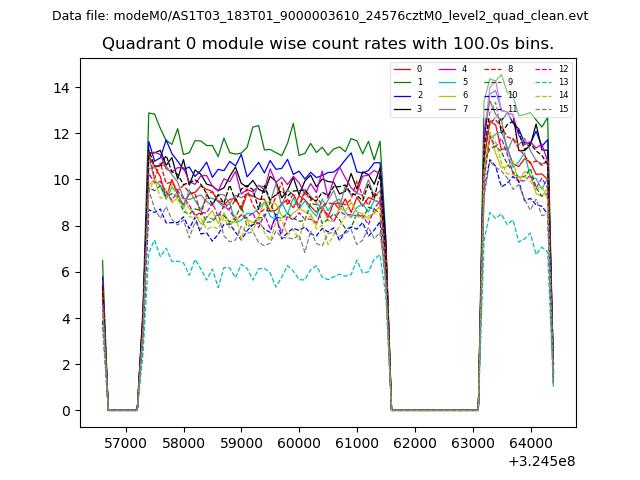
| Module-wise count rates for Quadrant A Data is divided into 100 sec bins |
 |
 |
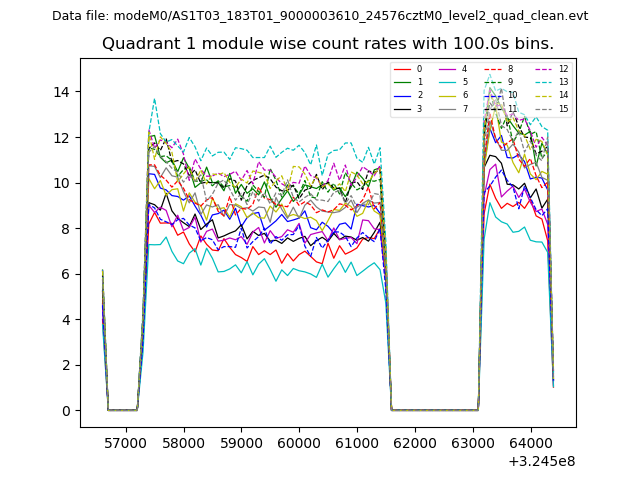
| Module-wise count rates for Quadrant B Data is divided into 100 sec bins |
 |
 |
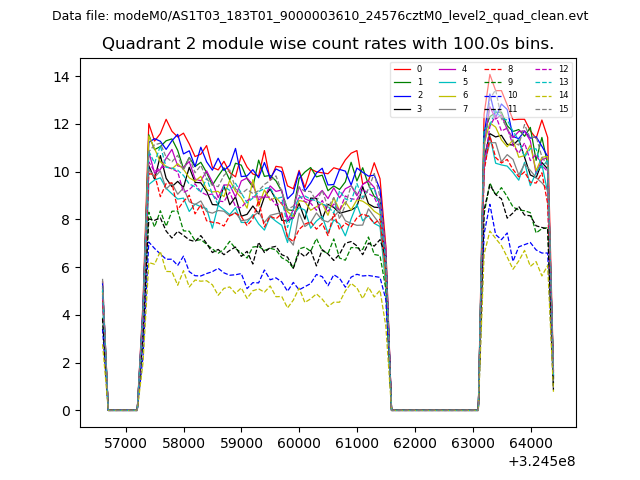
| Module-wise count rates for Quadrant C Data is divided into 100 sec bins |
 |
 |
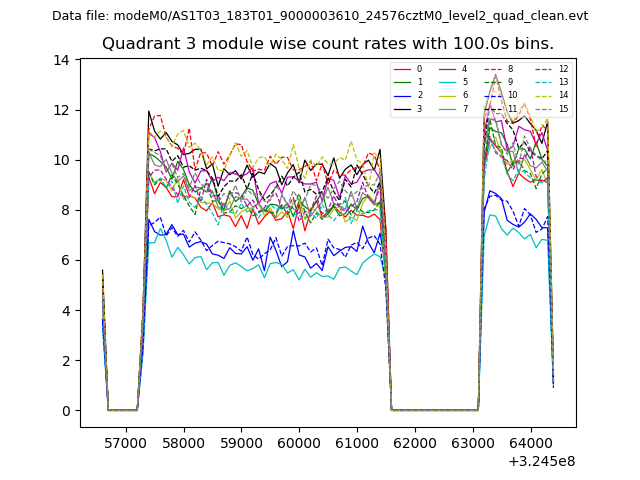
| Module-wise count rates for Quadrant D Data is divided into 100 sec bins |
 |
 |
| Parameter | Plot |
|---|---|
| CZT HV Monitor | 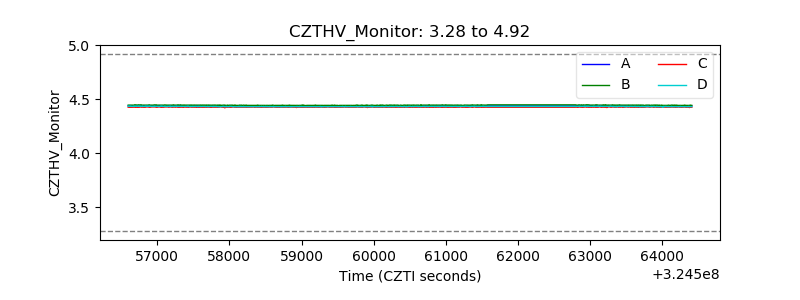 |
| D_VDD | 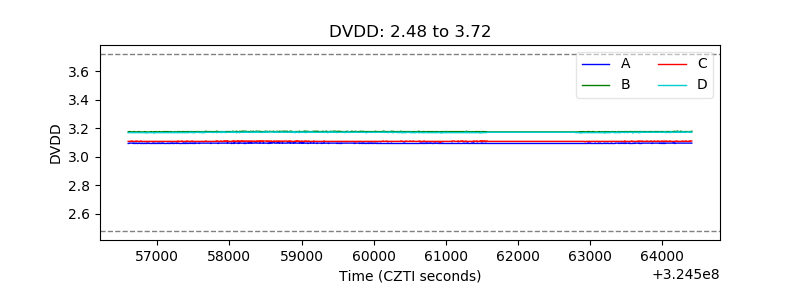 |
| Temperature 1 | 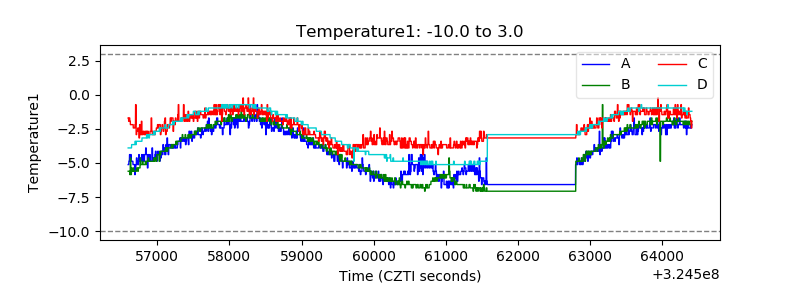 |
| Veto HV Monitor | 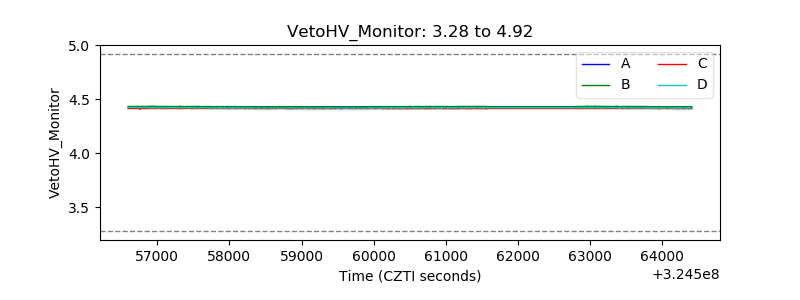 |
| Veto LLD | 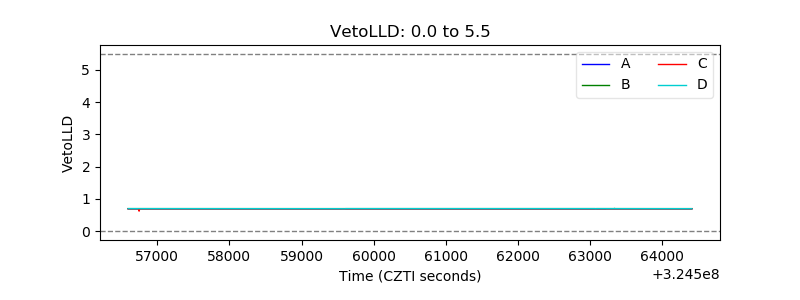 |
| Alpha Counter | 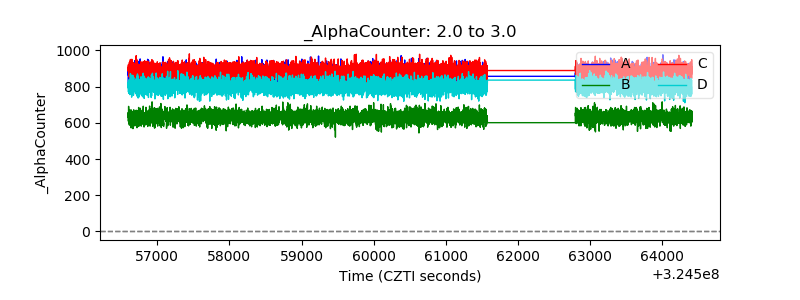 |
| _CPM_Rate | 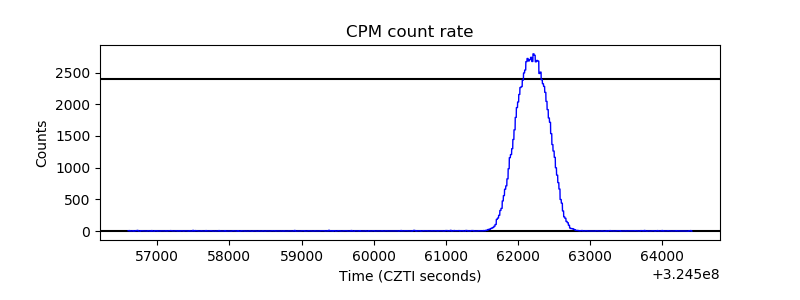 |
| CZT Counter |  |
| +2.5 Volts monitor |  |
| +5 Volts monitor | 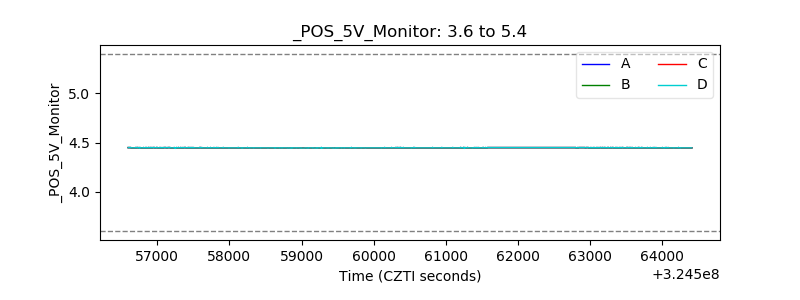 |
| _ROLL_ROT | 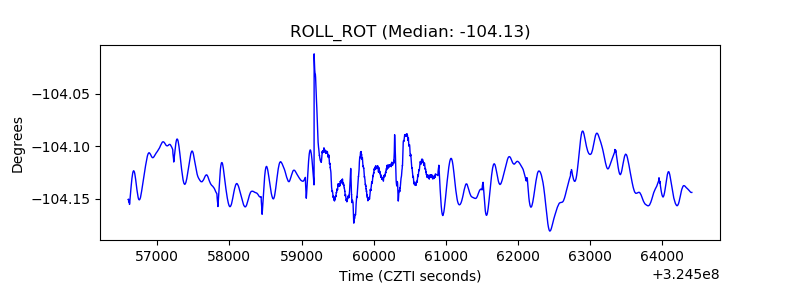 |
| _Roll_DEC | 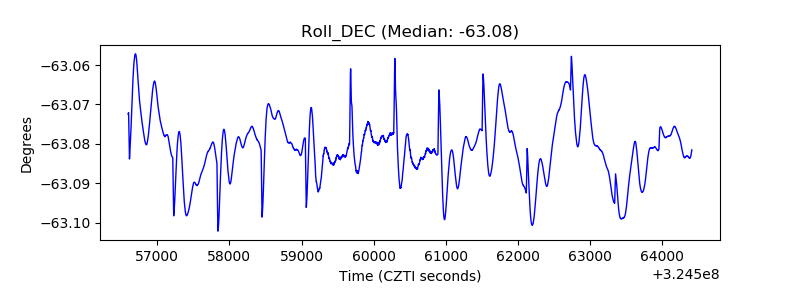 |
| _Roll_RA | 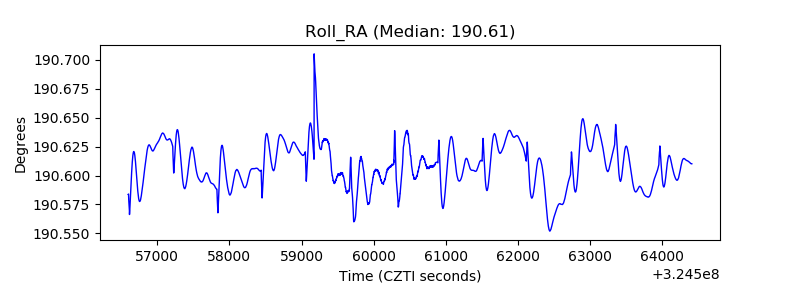 |
| Veto Counter | 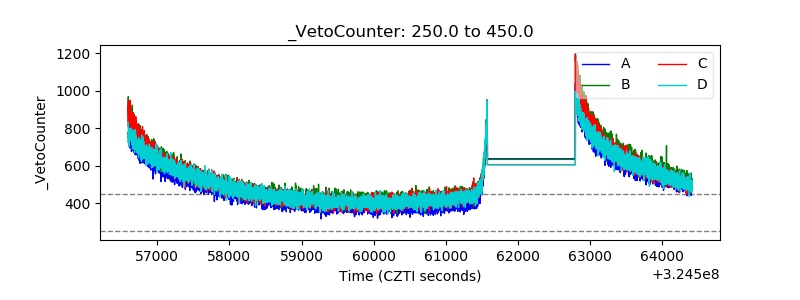 |