| Param | Original file | Final file |
|---|---|---|
| Filename | modeM0/AS1T03_183T01_9000003610_24577cztM0_level2.evt | modeM0/AS1T03_183T01_9000003610_24577cztM0_level2_quad_clean.evt |
| Size (bytes) | 499,838,400 | 136,422,720 |
| Size | 476.7 MB | 130.1 MB |
| Events in quadrant A | 3,140,351 | 963,642 |
| Events in quadrant B | 3,220,796 | 975,546 |
| Events in quadrant C | 3,942,590 | 899,381 |
| Events in quadrant D | 4,434,063 | 881,303 |
| Mode M0 | |||
|---|---|---|---|
| Quadrant | BADHDUFLAG | Total packets | Discarded packets |
| A | 0 | 13100 | 1 |
| B | 0 | 13310 | 1 |
| C | 0 | 15796 | 1 |
| D | 0 | 17269 | 1 |
| Mode SS | |||
|---|---|---|---|
| Quadrant | BADHDUFLAG | Total packets | Discarded packets |
| A | 0 | 120 | 0 |
| B | 0 | 120 | 0 |
| C | 0 | 120 | 0 |
| D | 0 | 120 | 0 |
| Mode M9 | |||
|---|---|---|---|
| Quadrant | BADHDUFLAG | Total packets | Discarded packets |
| A | 0 | 13 | 0 |
| B | 0 | 13 | 0 |
| C | 0 | 13 | 0 |
| D | 0 | 13 | 0 |
| Quadrant | Total seconds | Saturated seconds | Saturation percentage |
|---|---|---|---|
| A | 5899 | 76 | 1.288354% |
| B | 5900 | 88 | 1.491525% |
| C | 5900 | 158 | 2.677966% |
| D | 5900 | 200 | 3.389831% |
Noise dominated data is calculated using 1-second bins in cleaned event files. If a bin has >2000 counts, and if more than 50% of those come from <1% of pixels, then it is considered to be noise-dominated and hence unusable.
| Quadrant | # 1 sec bins | Bins with >0 counts | Bins with >2000 counts | High rate bins dominated by noise | Noise dominated (total time) | Noise dominated (detector-on time) | Marked lightcurve |
|---|---|---|---|---|---|---|---|
| A | 7219 | 5900 | 0 | 0 | 0.00% | 0.00% | 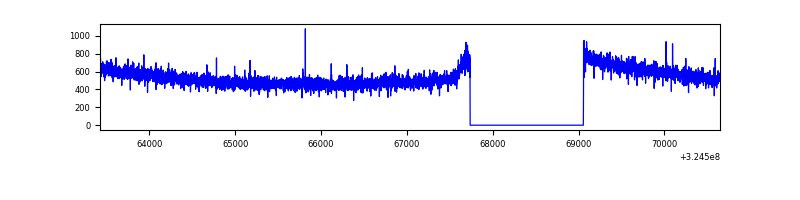 |
| B | 7220 | 5900 | 1 | 1 | 0.01% | 0.02% | 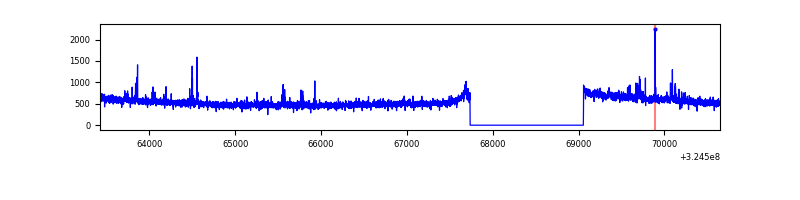 |
| C | 7220 | 5901 | 8 | 8 | 0.11% | 0.14% | 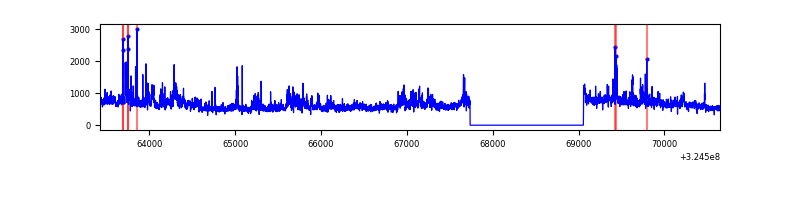 |
| D | 7220 | 5901 | 115 | 115 | 1.59% | 1.95% | 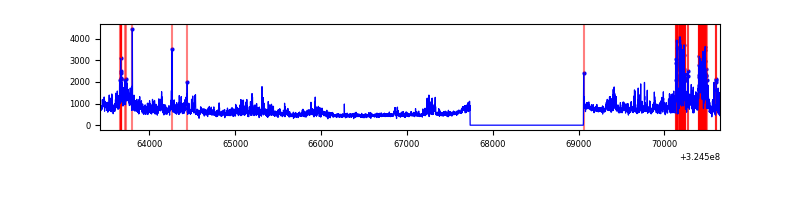 |
Top three noisy pixels from each quadrant. If the there are fewer than three noisy pixels in the level2.evt file, extra rows are filled as -1
| Pixel properties | Quadrant properties | ||||||
|---|---|---|---|---|---|---|---|
| Quadrant | DetID | PixID | Counts | Sigma | Mean | Median | Sigma |
| A | 13 | 254 | 9799 | 56.35 | 814 | 803 | 159.6 |
| A | 0 | 226 | 7056 | 39.17 | 814 | 803 | 159.6 |
| A | 3 | 137 | 6407 | 35.1 | 814 | 803 | 159.6 |
| B | 3 | 64 | 48992 | 327.05 | 804 | 789 | 147.4 |
| B | 0 | 190 | 18596 | 120.82 | 804 | 789 | 147.4 |
| B | 12 | 111 | 16681 | 107.82 | 804 | 789 | 147.4 |
| C | 7 | 247 | 664805 | 3888.65 | 755 | 764 | 170.8 |
| C | 2 | 16 | 155663 | 907.09 | 755 | 764 | 170.8 |
| C | 14 | 238 | 125077 | 727.98 | 755 | 764 | 170.8 |
| D | 8 | 195 | 904487 | 5015.83 | 768 | 746 | 180.2 |
| D | 12 | 218 | 592437 | 3283.93 | 768 | 746 | 180.2 |
| D | 2 | 234 | 29550 | 159.86 | 768 | 746 | 180.2 |
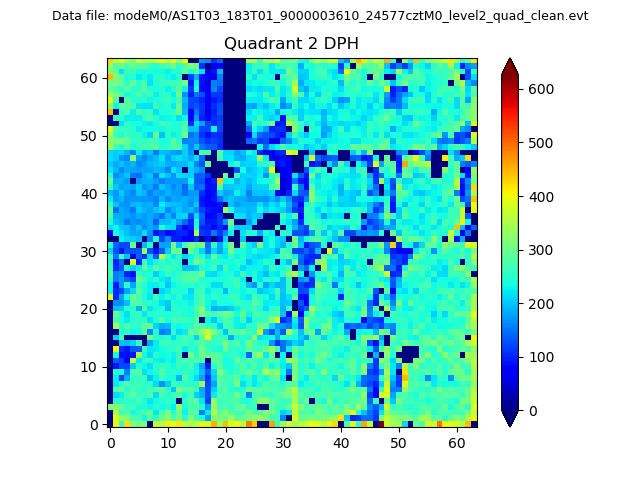
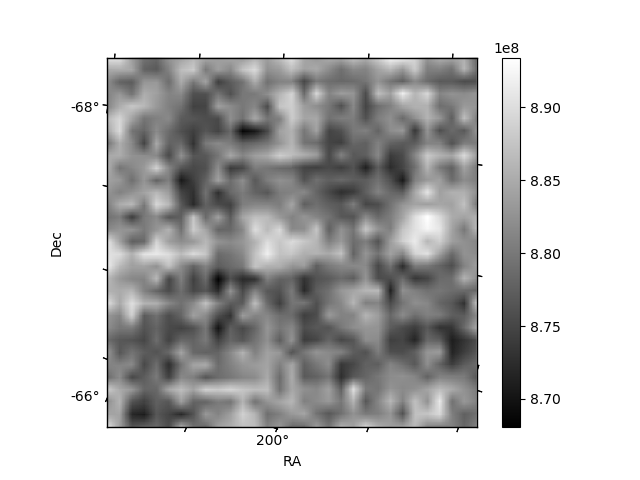
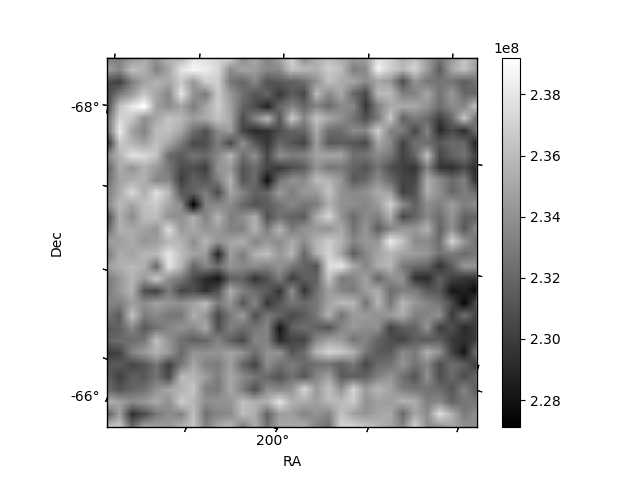
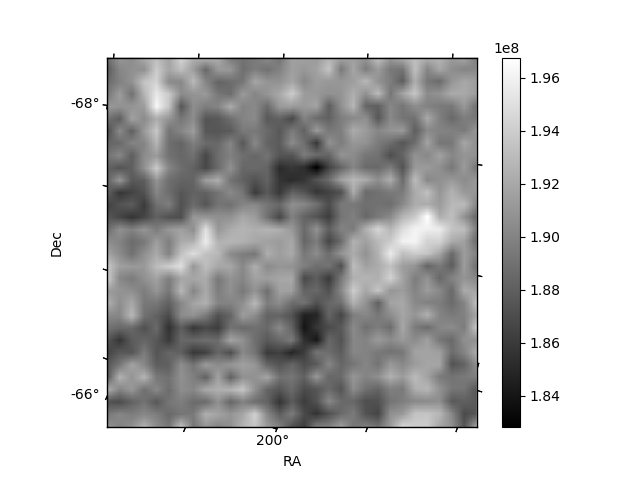
Histogram calculated using DETX and DETY for each event in the final _common_clean file
| Quadrant A | 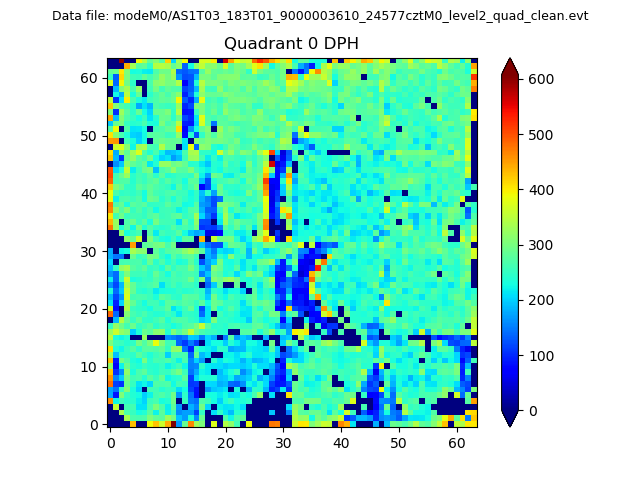 |
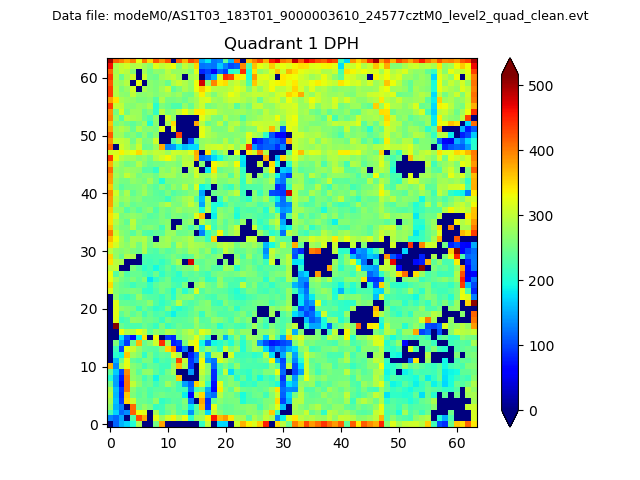 |
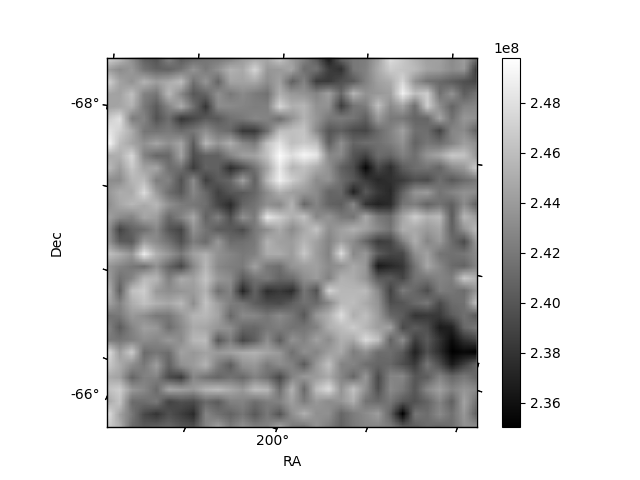
Quadrant B |
|---|---|---|---|
| Quadrant D | 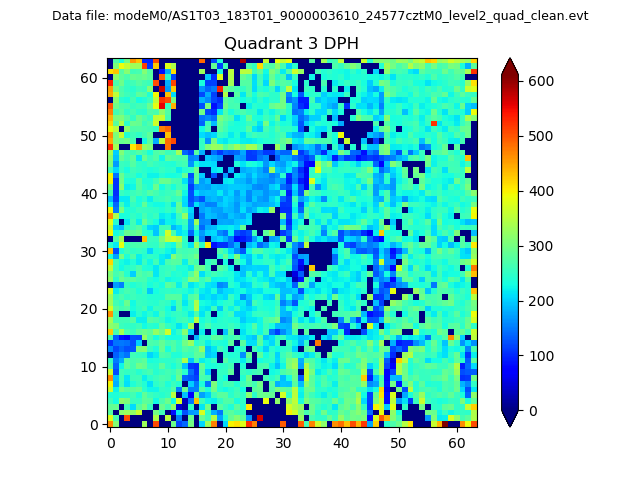 |
 |
Quadrant C |
| Plot type | Count rate plots | Images |
|---|---|---|
| Comparison with Poisson distribution Blue bars denote a histogram of data divided into 1 sec bins. Red curve is a Poisson curve with rate = median count rate of data. |
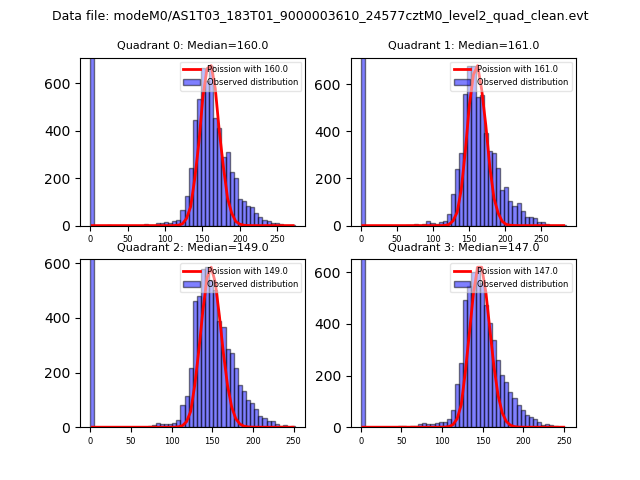 |
 |
| Quadrant-wise count rates Data is divided into 100 sec bins |
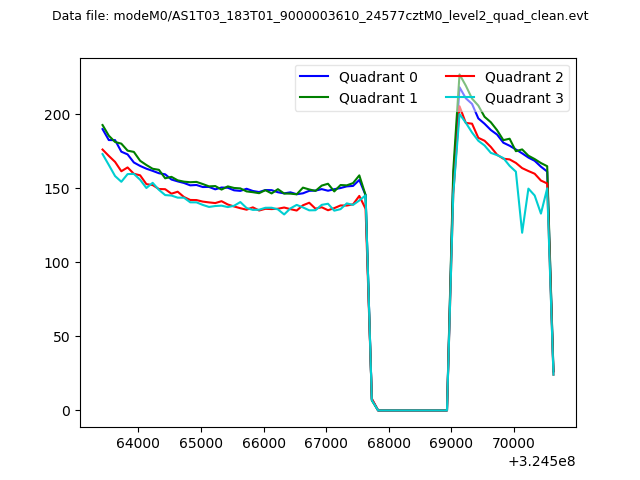 |
|
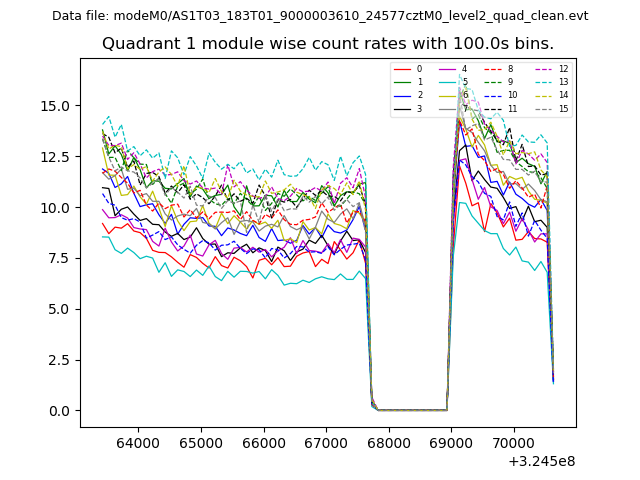
| Module-wise count rates for Quadrant A Data is divided into 100 sec bins |
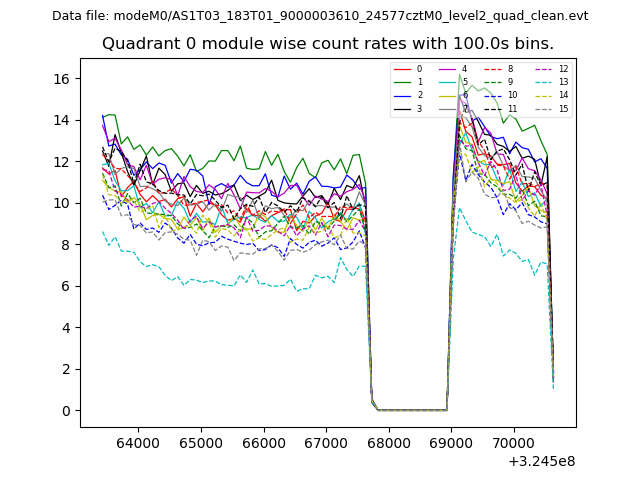 |
 |
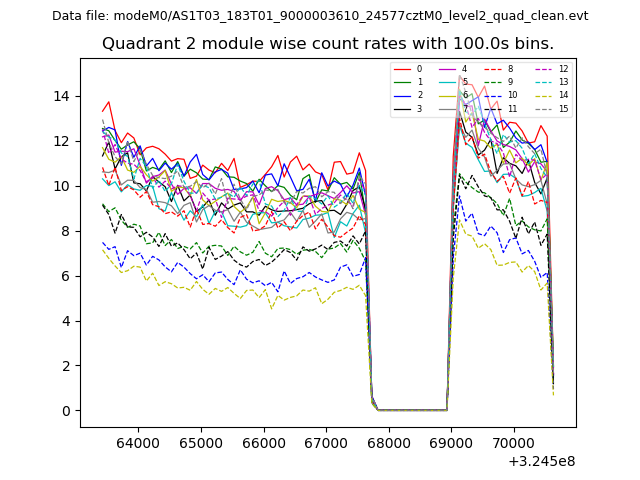
| Module-wise count rates for Quadrant B Data is divided into 100 sec bins |
 |
 |
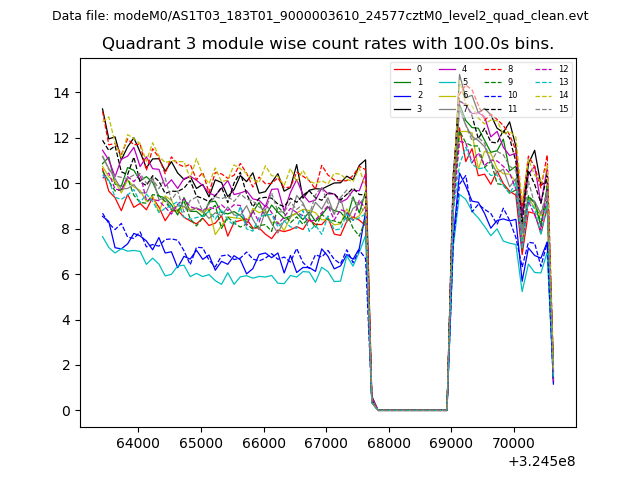
| Module-wise count rates for Quadrant C Data is divided into 100 sec bins |
 |
 |
| Module-wise count rates for Quadrant D Data is divided into 100 sec bins |
 |
 |
| Parameter | Plot |
|---|---|
| CZT HV Monitor | 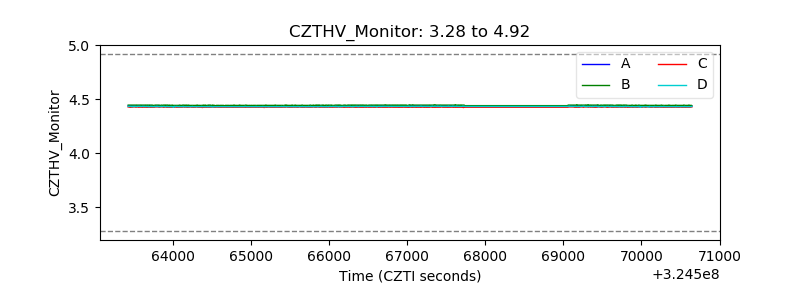 |
| D_VDD | 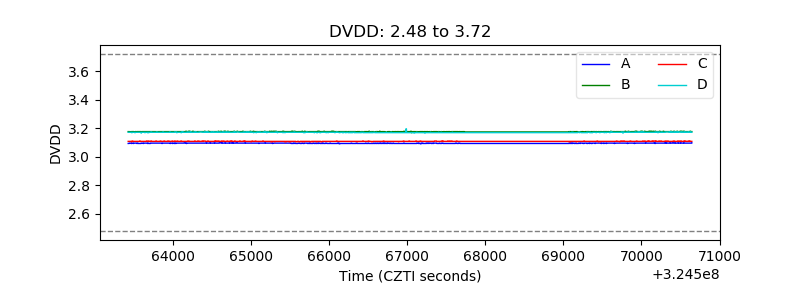 |
| Temperature 1 | 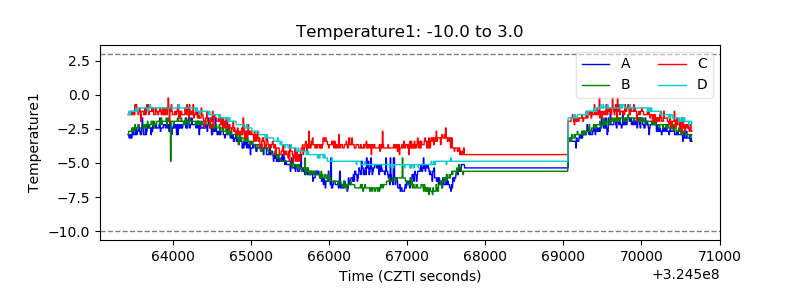 |
| Veto HV Monitor | 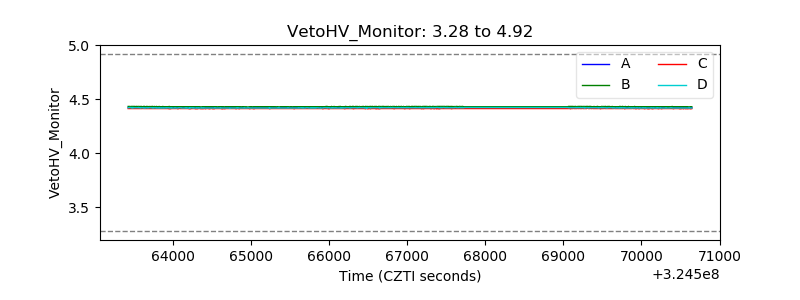 |
| Veto LLD | 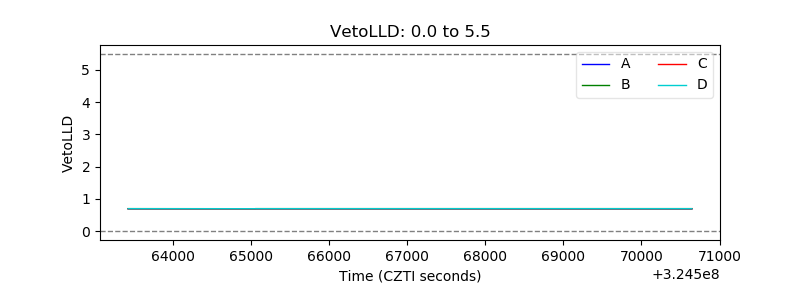 |
| Alpha Counter | 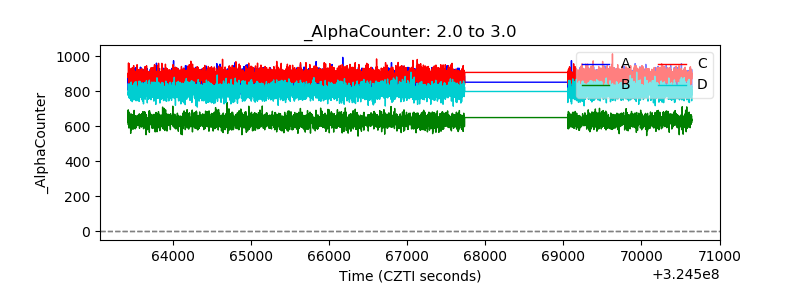 |
| _CPM_Rate | 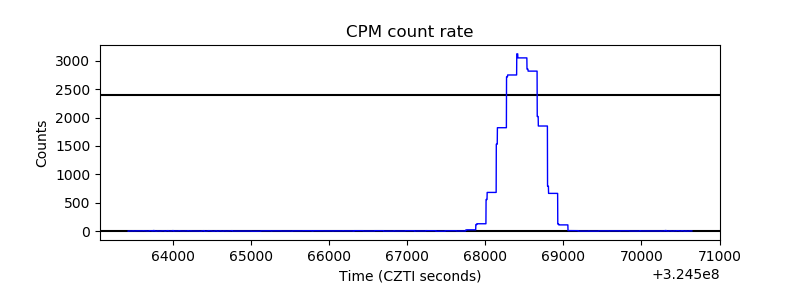 |
| CZT Counter | 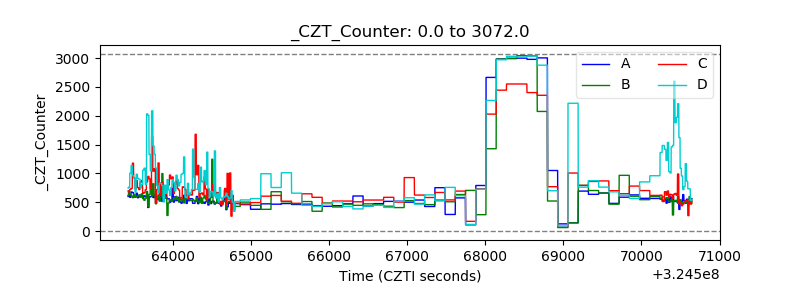 |
| +2.5 Volts monitor |  |
| +5 Volts monitor |  |
| _ROLL_ROT | 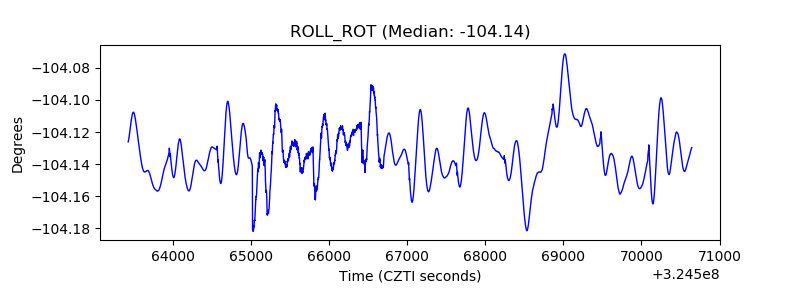 |
| _Roll_DEC |  |
| _Roll_RA | 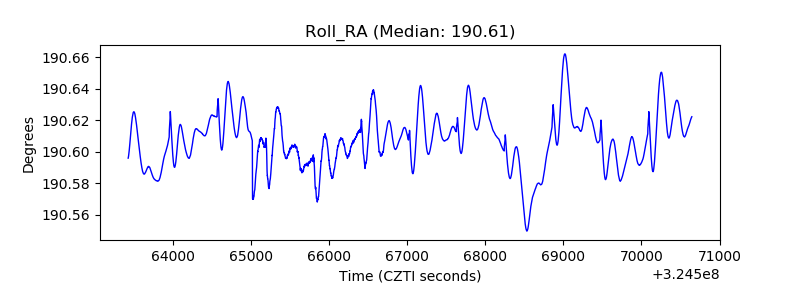 |
| Veto Counter | 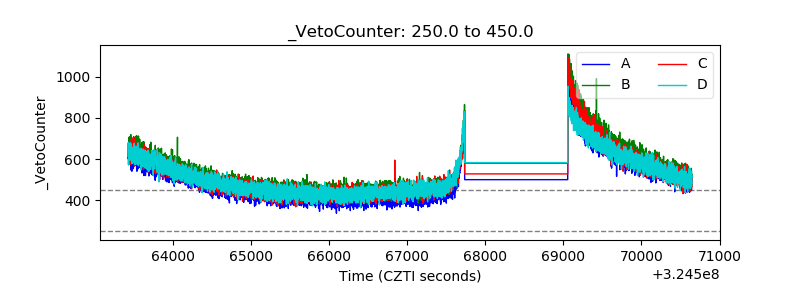 |