| Param | Original file | Final file |
|---|---|---|
| Filename | modeM0/AS1T03_183T01_9000003610_24579cztM0_level2.evt | modeM0/AS1T03_183T01_9000003610_24579cztM0_level2_quad_clean.evt |
| Size (bytes) | 733,726,080 | 120,153,600 |
| Size | 699.7 MB | 114.6 MB |
| Events in quadrant A | 3,007,261 | 890,001 |
| Events in quadrant B | 3,192,169 | 900,582 |
| Events in quadrant C | 11,700,686 | 616,702 |
| Events in quadrant D | 3,915,181 | 811,397 |
| Mode M0 | |||
|---|---|---|---|
| Quadrant | BADHDUFLAG | Total packets | Discarded packets |
| A | 0 | 12628 | 0 |
| B | 0 | 13164 | 0 |
| C | 0 | 38904 | 0 |
| D | 0 | 15741 | 0 |
| Mode SS | |||
|---|---|---|---|
| Quadrant | BADHDUFLAG | Total packets | Discarded packets |
| A | 0 | 124 | 0 |
| B | 0 | 124 | 0 |
| C | 0 | 124 | 0 |
| D | 0 | 124 | 0 |
| Mode M9 | |||
|---|---|---|---|
| Quadrant | BADHDUFLAG | Total packets | Discarded packets |
| A | 0 | 13 | 0 |
| B | 0 | 13 | 0 |
| C | 0 | 13 | 0 |
| D | 0 | 13 | 0 |
| Quadrant | Total seconds | Saturated seconds | Saturation percentage |
|---|---|---|---|
| A | 5989 | 38 | 0.634497% |
| B | 5989 | 78 | 1.302388% |
| C | 5990 | 3847 | 64.223706% |
| D | 5990 | 33 | 0.550918% |
Noise dominated data is calculated using 1-second bins in cleaned event files. If a bin has >2000 counts, and if more than 50% of those come from <1% of pixels, then it is considered to be noise-dominated and hence unusable.
| Quadrant | # 1 sec bins | Bins with >0 counts | Bins with >2000 counts | High rate bins dominated by noise | Noise dominated (total time) | Noise dominated (detector-on time) | Marked lightcurve |
|---|---|---|---|---|---|---|---|
| A | 7344 | 5990 | 0 | 0 | 0.00% | 0.00% | 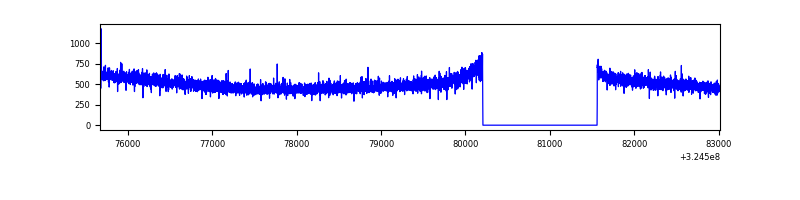 |
| B | 7344 | 5990 | 18 | 18 | 0.25% | 0.30% | 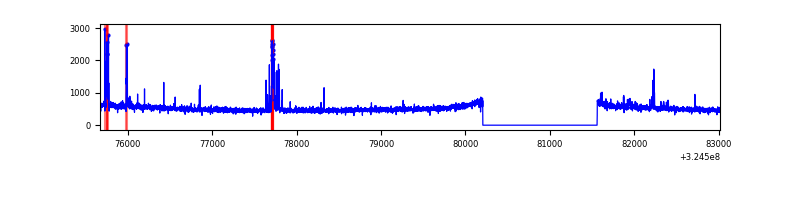 |
| C | 7345 | 5991 | 3317 | 3317 | 45.16% | 55.37% | 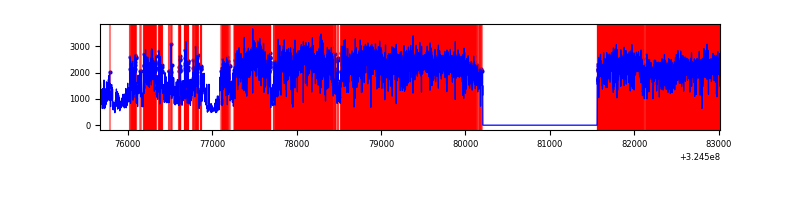 |
| D | 7345 | 5991 | 25 | 25 | 0.34% | 0.42% | 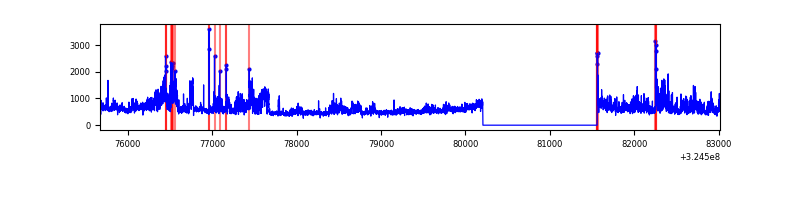 |
Top three noisy pixels from each quadrant. If the there are fewer than three noisy pixels in the level2.evt file, extra rows are filled as -1
| Pixel properties | Quadrant properties | ||||||
|---|---|---|---|---|---|---|---|
| Quadrant | DetID | PixID | Counts | Sigma | Mean | Median | Sigma |
| A | 13 | 254 | 9943 | 59.63 | 779 | 766 | 153.9 |
| A | 0 | 226 | 6774 | 39.04 | 779 | 766 | 153.9 |
| A | 3 | 137 | 6473 | 37.08 | 779 | 766 | 153.9 |
| B | 3 | 64 | 129761 | 900.65 | 775 | 758 | 143.2 |
| B | 15 | 33 | 16823 | 112.16 | 775 | 758 | 143.2 |
| B | 12 | 111 | 16460 | 109.62 | 775 | 758 | 143.2 |
| C | 7 | 247 | 9212722 | 70063.44 | 580 | 584 | 131.5 |
| C | 2 | 16 | 97134 | 734.31 | 580 | 584 | 131.5 |
| C | 14 | 238 | 91807 | 693.8 | 580 | 584 | 131.5 |
| D | 8 | 195 | 886625 | 5066.38 | 735 | 715 | 174.9 |
| D | 12 | 218 | 151736 | 863.67 | 735 | 715 | 174.9 |
| D | 1 | 52 | 94335 | 535.4 | 735 | 715 | 174.9 |
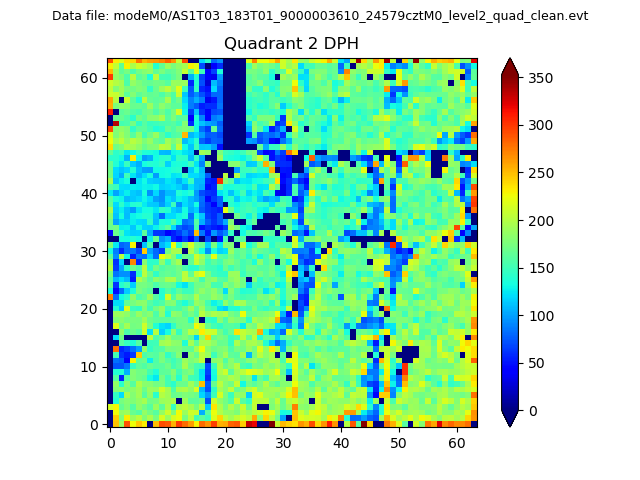
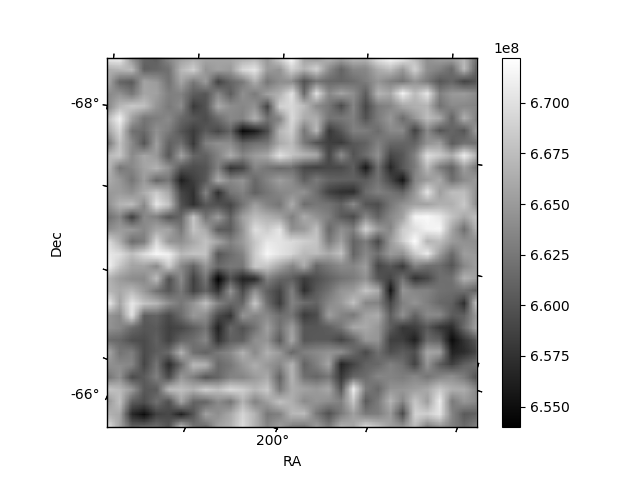
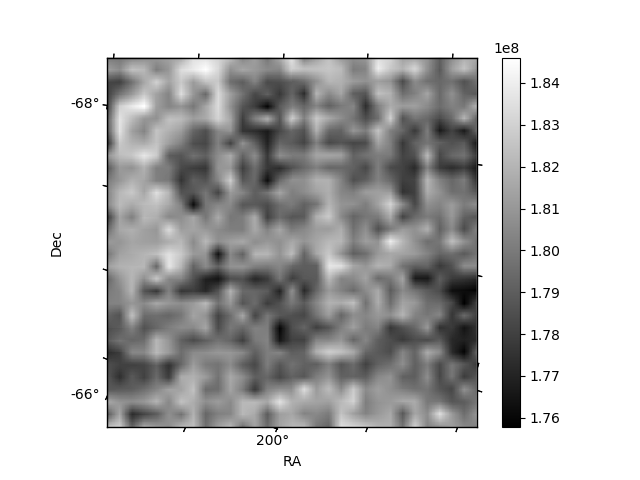
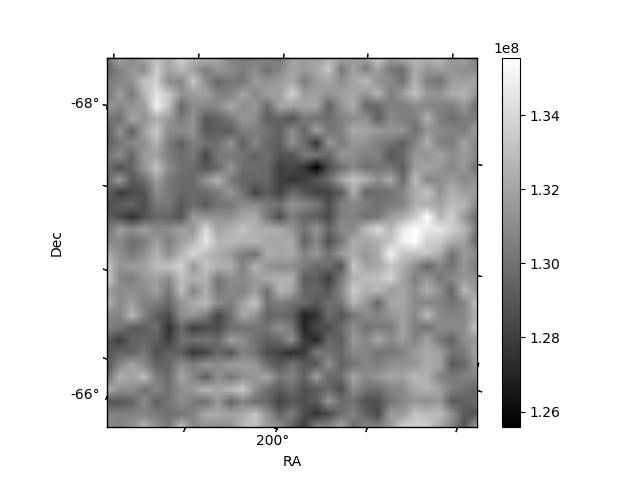
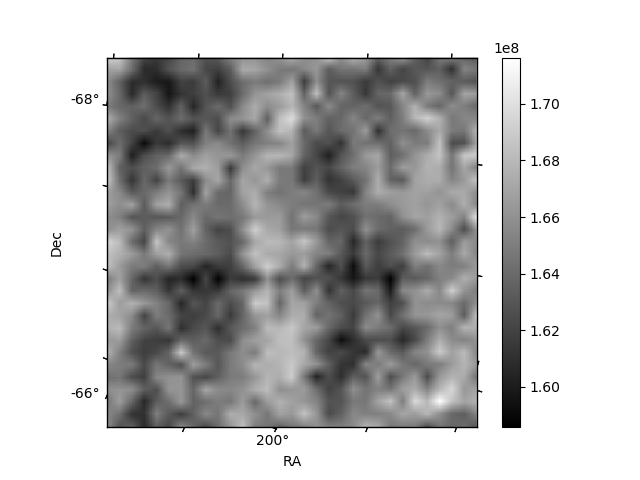
Histogram calculated using DETX and DETY for each event in the final _common_clean file
| Quadrant A | 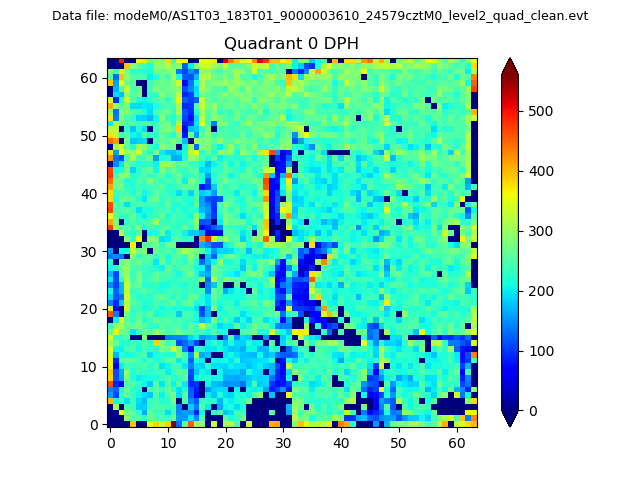 |
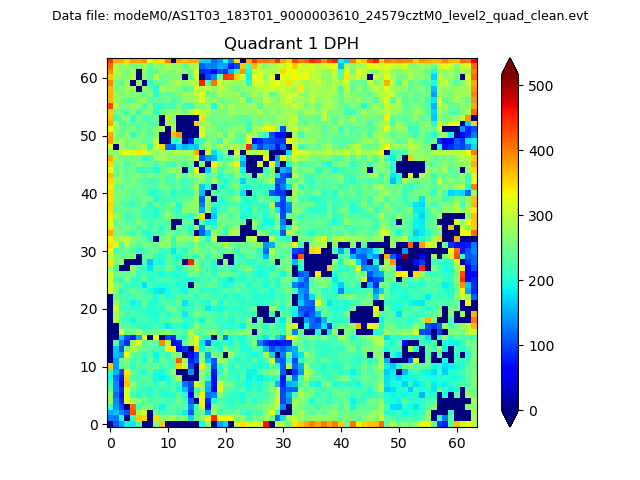 |
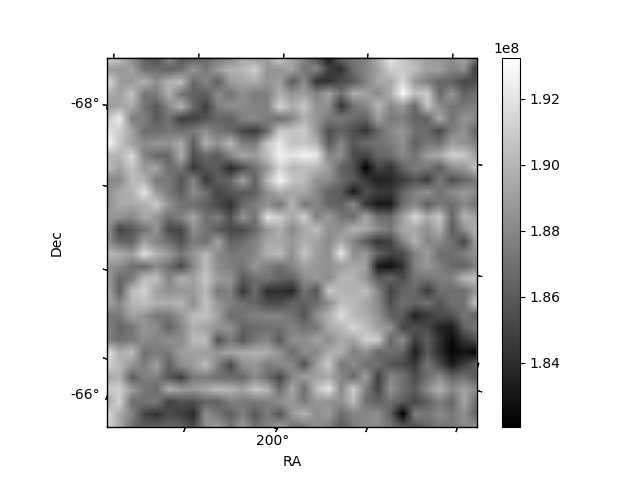
Quadrant B |
|---|---|---|---|
| Quadrant D | 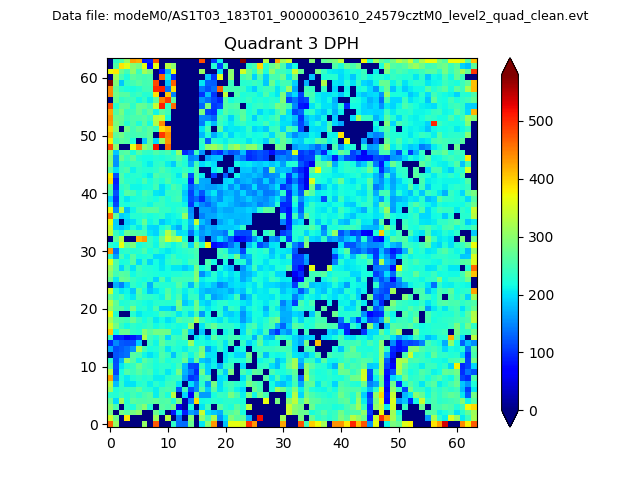 |
 |
Quadrant C |
| Plot type | Count rate plots | Images |
|---|---|---|
| Comparison with Poisson distribution Blue bars denote a histogram of data divided into 1 sec bins. Red curve is a Poisson curve with rate = median count rate of data. |
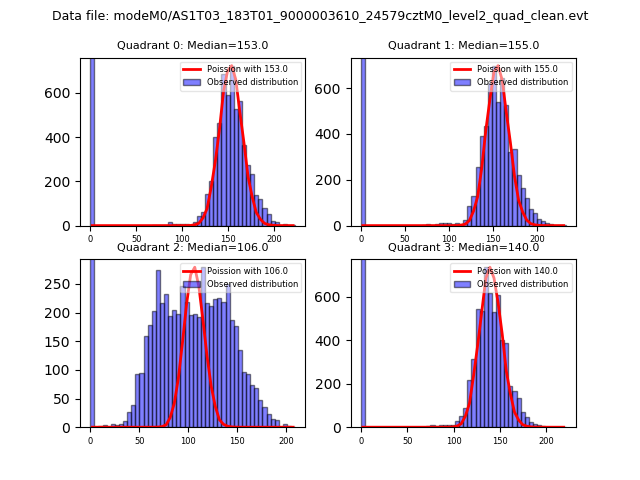 |
 |
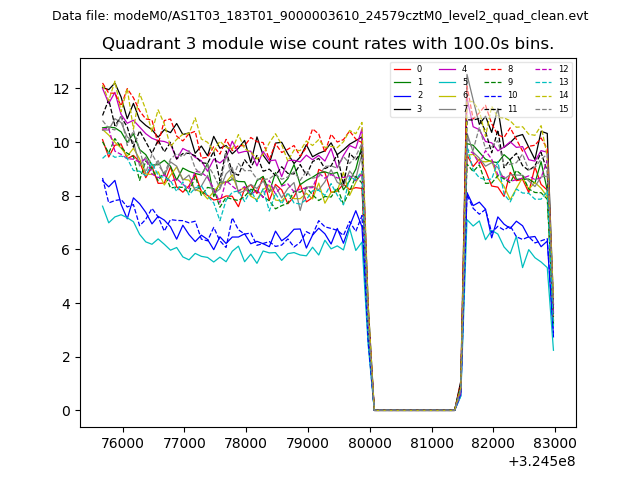
| Quadrant-wise count rates Data is divided into 100 sec bins |
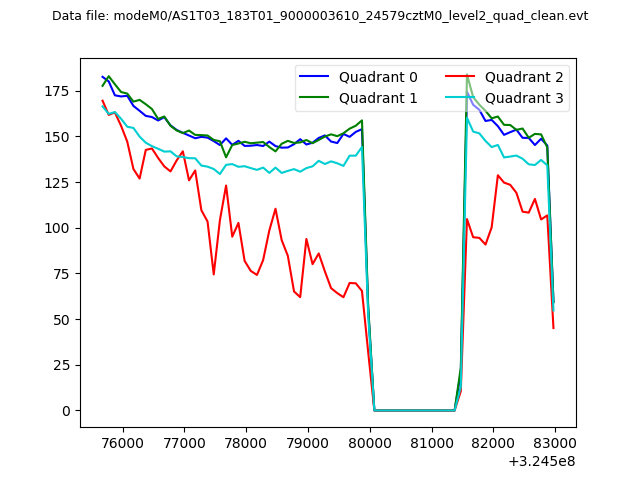 |
|
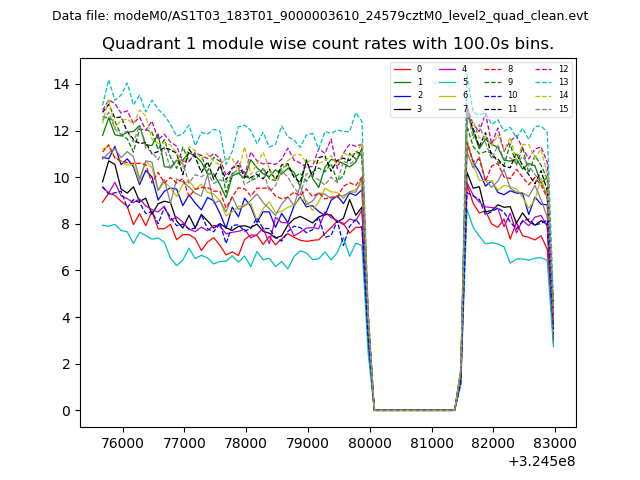
| Module-wise count rates for Quadrant A Data is divided into 100 sec bins |
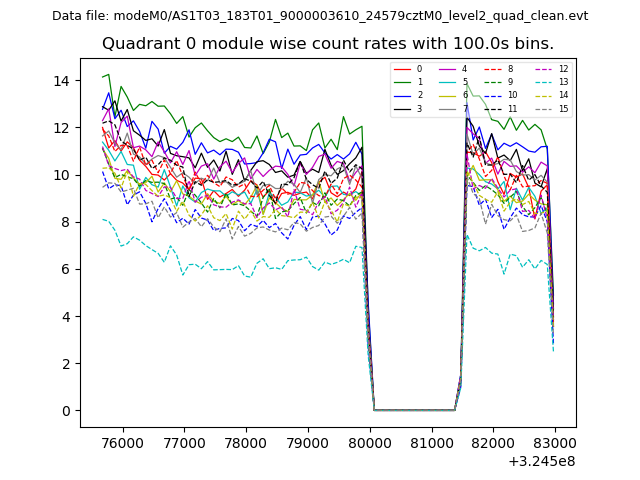 |
 |
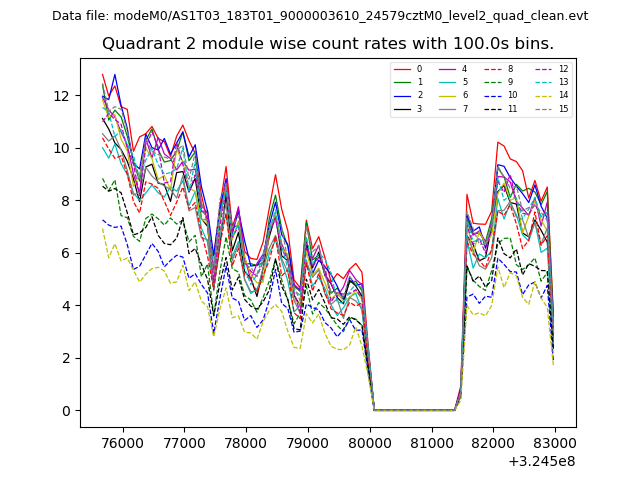
| Module-wise count rates for Quadrant B Data is divided into 100 sec bins |
 |
 |
| Module-wise count rates for Quadrant C Data is divided into 100 sec bins |
 |
 |
| Module-wise count rates for Quadrant D Data is divided into 100 sec bins |
 |
 |
| Parameter | Plot |
|---|---|
| CZT HV Monitor | 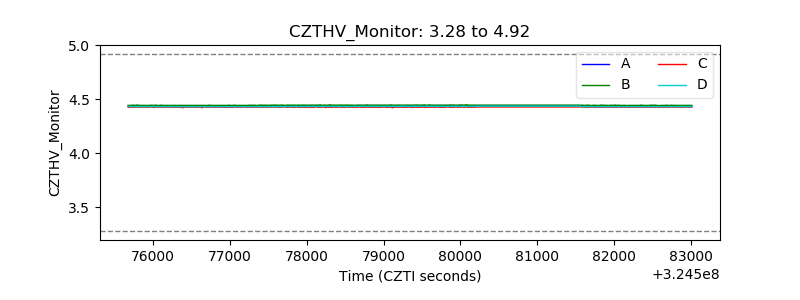 |
| D_VDD | 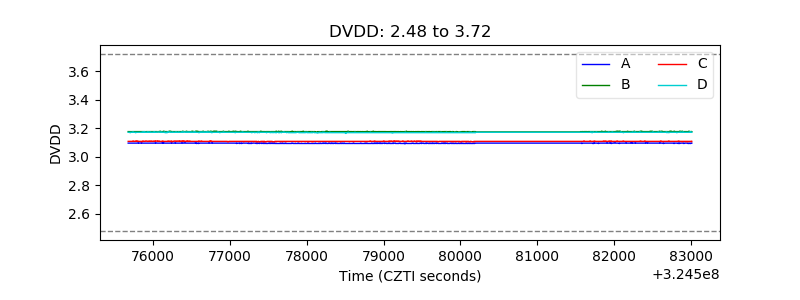 |
| Temperature 1 | 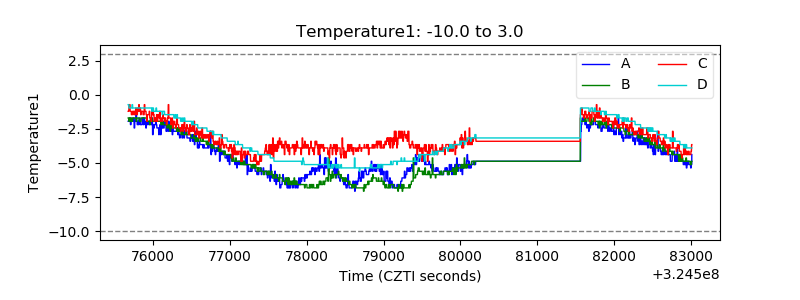 |
| Veto HV Monitor | 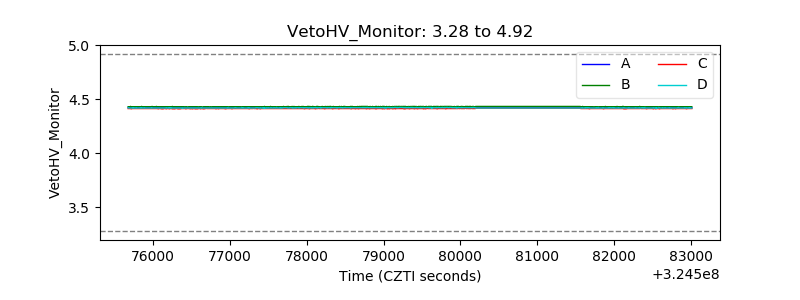 |
| Veto LLD | 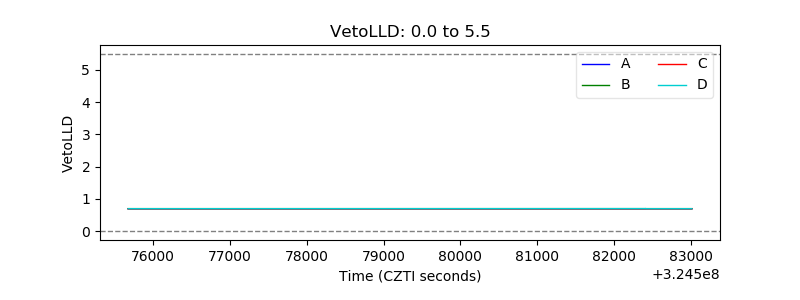 |
| Alpha Counter | 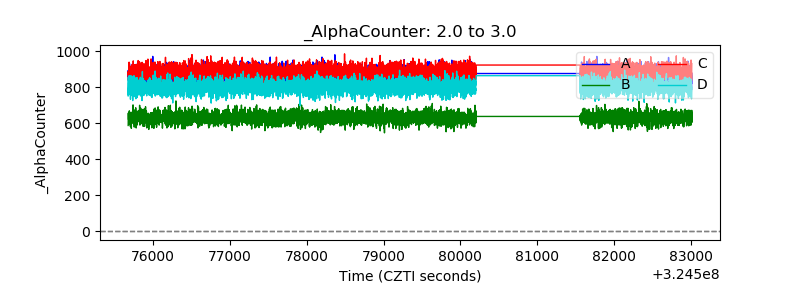 |
| _CPM_Rate | 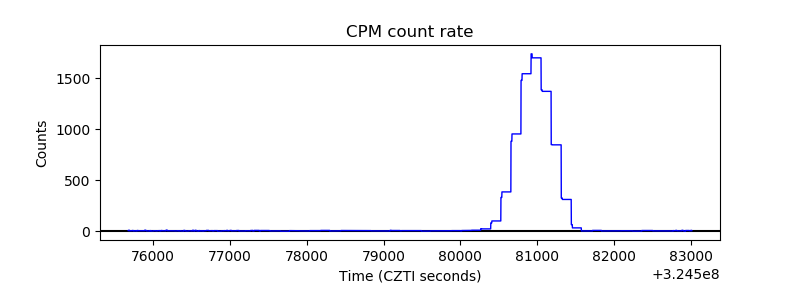 |
| CZT Counter | 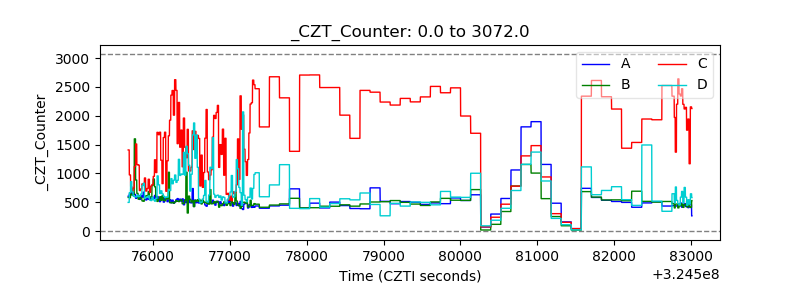 |
| +2.5 Volts monitor |  |
| +5 Volts monitor |  |
| _ROLL_ROT | 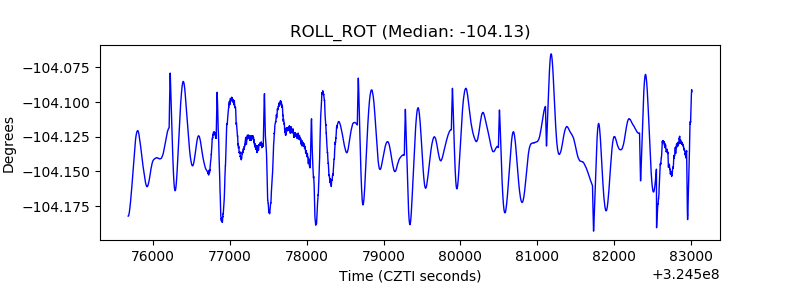 |
| _Roll_DEC | 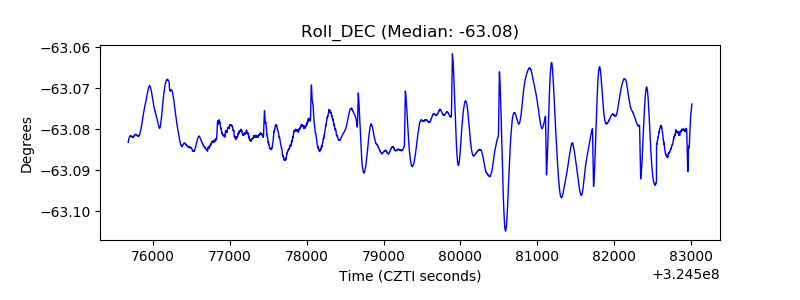 |
| _Roll_RA | 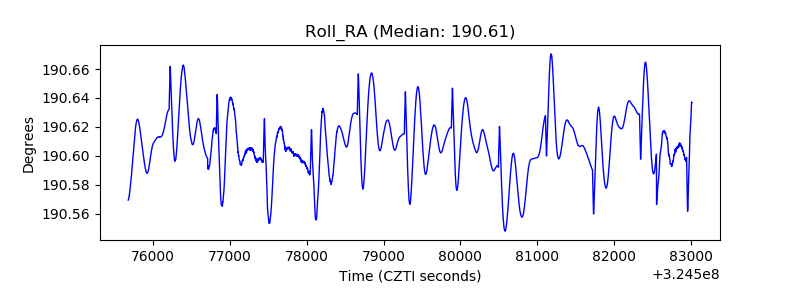 |
| Veto Counter | 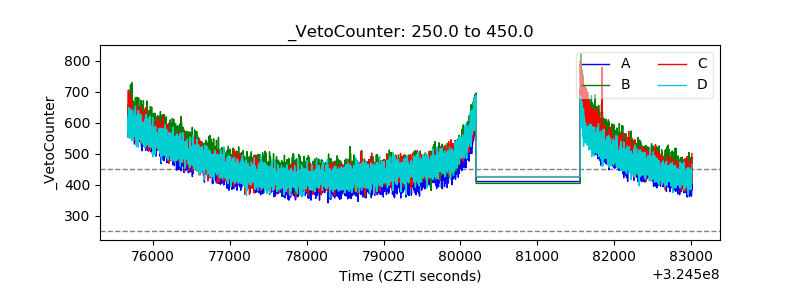 |