| Param | Original file | Final file |
|---|---|---|
| Filename | modeM0/AS1T03_183T01_9000003610_24580cztM0_level2.evt | modeM0/AS1T03_183T01_9000003610_24580cztM0_level2_quad_clean.evt |
| Size (bytes) | 827,208,000 | 115,007,040 |
| Size | 788.9 MB | 109.7 MB |
| Events in quadrant A | 3,174,955 | 833,253 |
| Events in quadrant B | 3,765,310 | 842,297 |
| Events in quadrant C | 13,613,148 | 586,509 |
| Events in quadrant D | 4,056,755 | 763,593 |
| Mode M0 | |||
|---|---|---|---|
| Quadrant | BADHDUFLAG | Total packets | Discarded packets |
| A | 0 | 13636 | 2 |
| B | 0 | 15386 | 2 |
| C | 0 | 44878 | 3 |
| D | 0 | 16525 | 2 |
| Mode SS | |||
|---|---|---|---|
| Quadrant | BADHDUFLAG | Total packets | Discarded packets |
| A | 0 | 134 | 0 |
| B | 0 | 134 | 0 |
| C | 0 | 134 | 0 |
| D | 0 | 134 | 0 |
| Mode M9 | |||
|---|---|---|---|
| Quadrant | BADHDUFLAG | Total packets | Discarded packets |
| A | 0 | 11 | 0 |
| B | 0 | 12 | 0 |
| C | 0 | 12 | 0 |
| D | 0 | 12 | 0 |
| Quadrant | Total seconds | Saturated seconds | Saturation percentage |
|---|---|---|---|
| A | 6530 | 50 | 0.765697% |
| B | 6530 | 303 | 4.640123% |
| C | 6529 | 4745 | 72.675754% |
| D | 6529 | 47 | 0.719865% |
Noise dominated data is calculated using 1-second bins in cleaned event files. If a bin has >2000 counts, and if more than 50% of those come from <1% of pixels, then it is considered to be noise-dominated and hence unusable.
| Quadrant | # 1 sec bins | Bins with >0 counts | Bins with >2000 counts | High rate bins dominated by noise | Noise dominated (total time) | Noise dominated (detector-on time) | Marked lightcurve |
|---|---|---|---|---|---|---|---|
| A | 7600 | 6531 | 0 | 0 | 0.00% | 0.00% | 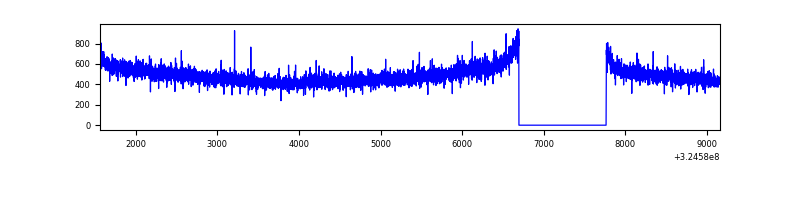 |
| B | 7600 | 6531 | 142 | 142 | 1.87% | 2.17% | 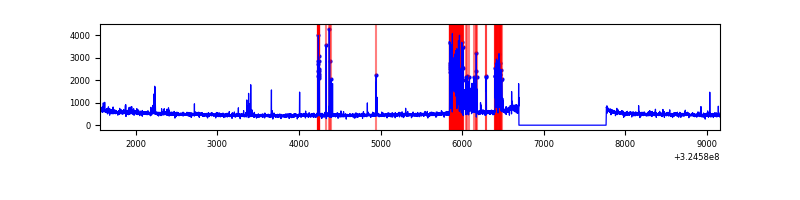 |
| C | 7599 | 6529 | 4077 | 4077 | 53.65% | 62.44% | 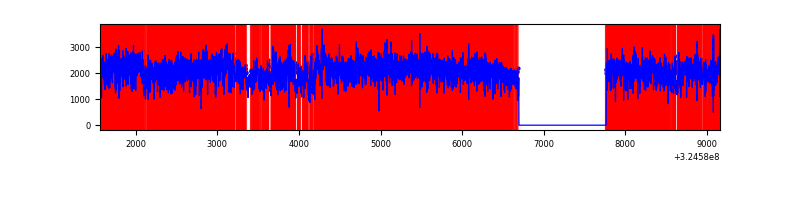 |
| D | 7599 | 6530 | 22 | 22 | 0.29% | 0.34% | 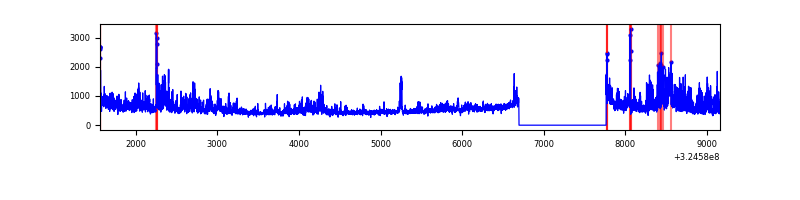 |
Top three noisy pixels from each quadrant. If the there are fewer than three noisy pixels in the level2.evt file, extra rows are filled as -1
| Pixel properties | Quadrant properties | ||||||
|---|---|---|---|---|---|---|---|
| Quadrant | DetID | PixID | Counts | Sigma | Mean | Median | Sigma |
| A | 13 | 254 | 10590 | 59.77 | 822 | 807 | 163.7 |
| A | 3 | 137 | 7284 | 39.57 | 822 | 807 | 163.7 |
| A | 0 | 226 | 7082 | 38.34 | 822 | 807 | 163.7 |
| B | 3 | 64 | 592321 | 3902.59 | 808 | 789 | 151.6 |
| B | 12 | 111 | 17798 | 112.22 | 808 | 789 | 151.6 |
| B | 11 | 111 | 15623 | 97.87 | 808 | 789 | 151.6 |
| C | 7 | 247 | 11030987 | 77981.15 | 622 | 626 | 141.4 |
| C | 14 | 238 | 96621 | 678.65 | 622 | 626 | 141.4 |
| C | 7 | 226 | 32468 | 225.11 | 622 | 626 | 141.4 |
| D | 8 | 195 | 870141 | 4634.44 | 781 | 759 | 187.6 |
| D | 1 | 52 | 121983 | 646.21 | 781 | 759 | 187.6 |
| D | 1 | 255 | 50502 | 265.17 | 781 | 759 | 187.6 |
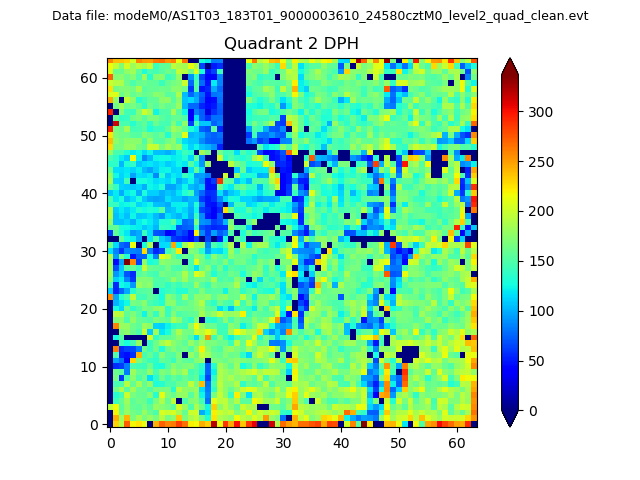
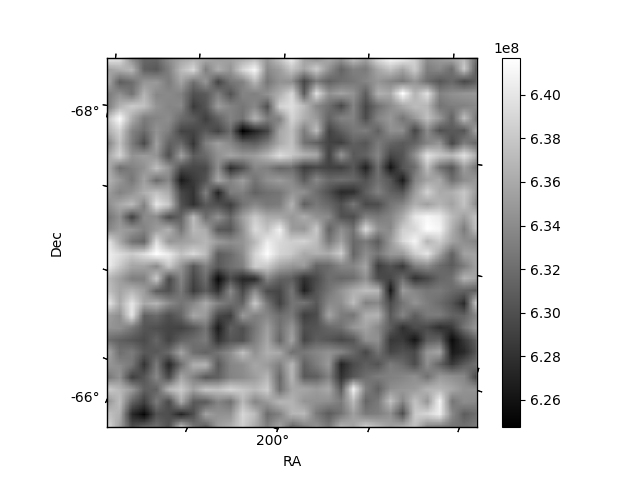
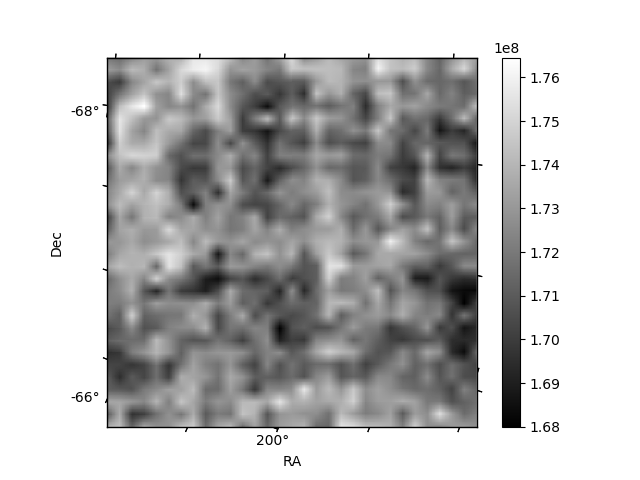
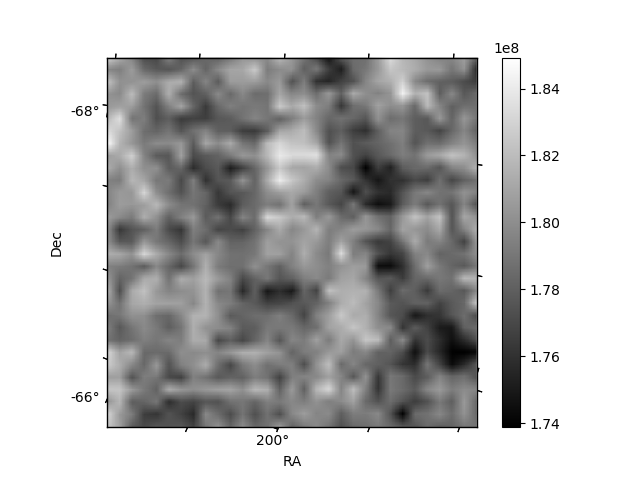
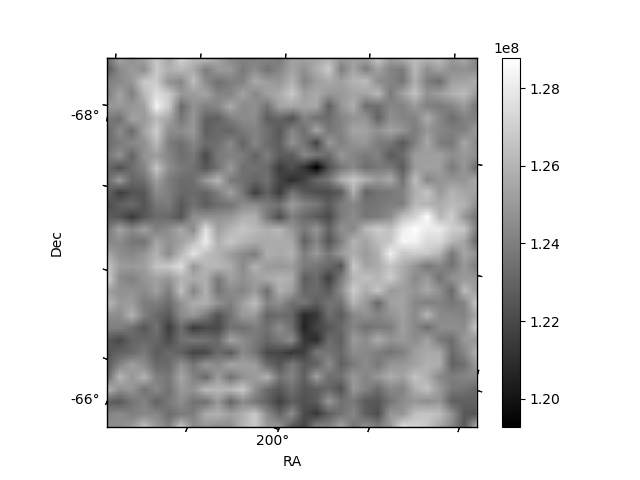
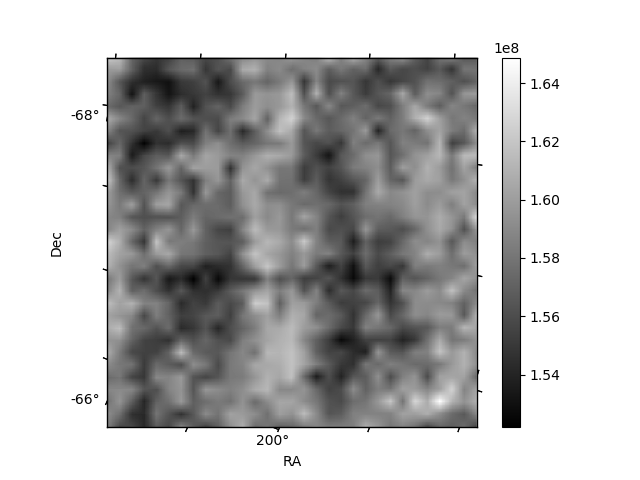
Histogram calculated using DETX and DETY for each event in the final _common_clean file
| Quadrant A | 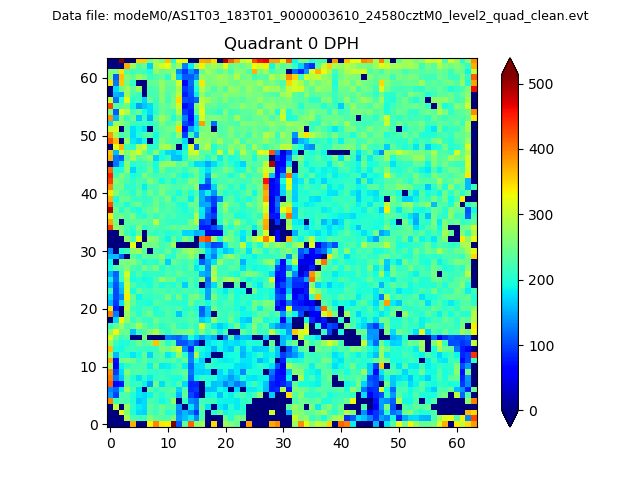 |
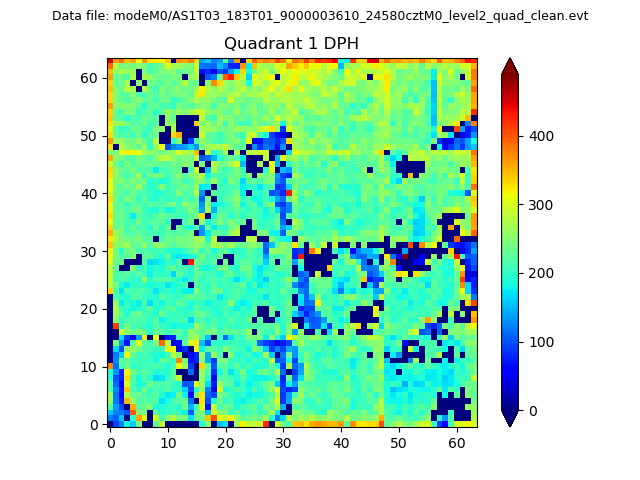 |
Quadrant B |
|---|---|---|---|
| Quadrant D | 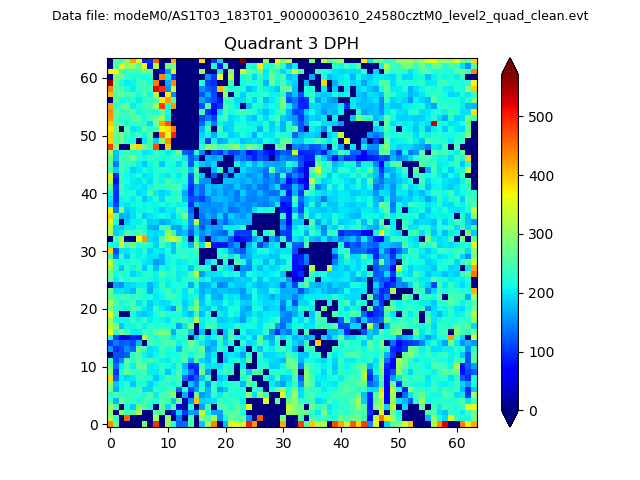 |
 |
Quadrant C |
| Plot type | Count rate plots | Images |
|---|---|---|
| Comparison with Poisson distribution Blue bars denote a histogram of data divided into 1 sec bins. Red curve is a Poisson curve with rate = median count rate of data. |
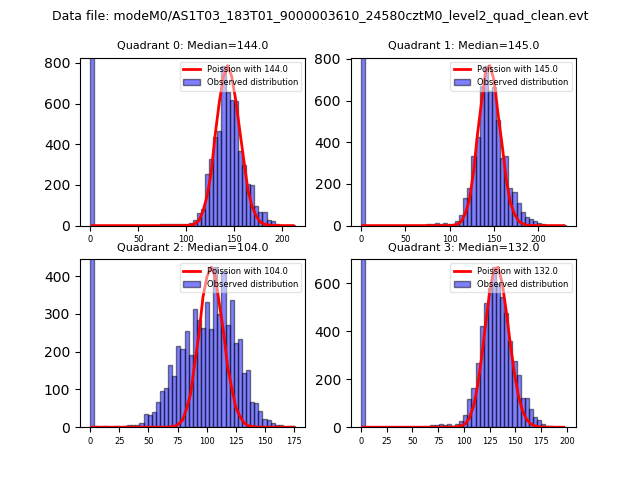 |
 |
| Quadrant-wise count rates Data is divided into 100 sec bins |
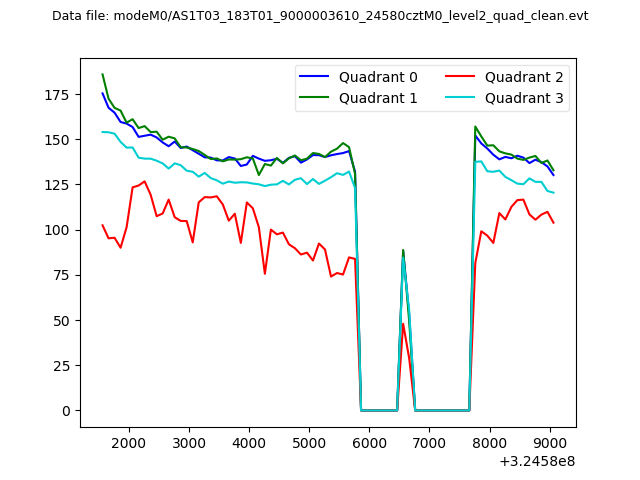 |
|
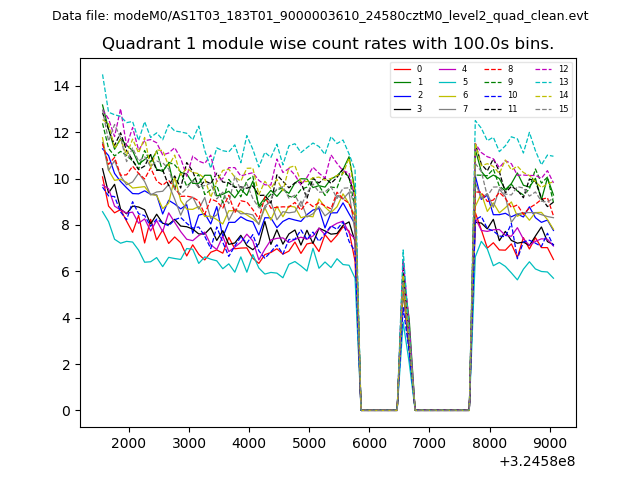
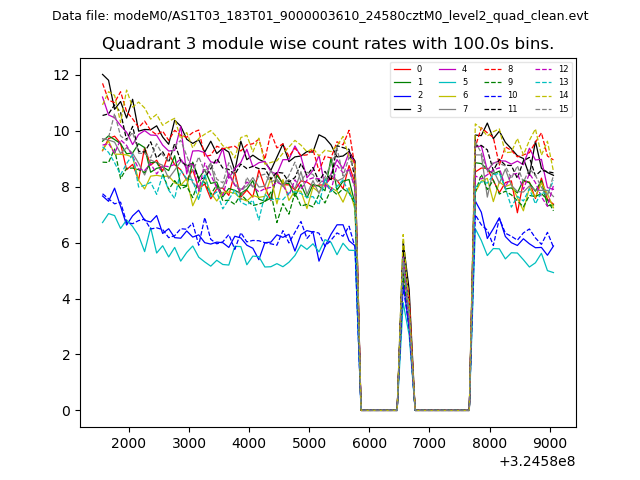
| Module-wise count rates for Quadrant A Data is divided into 100 sec bins |
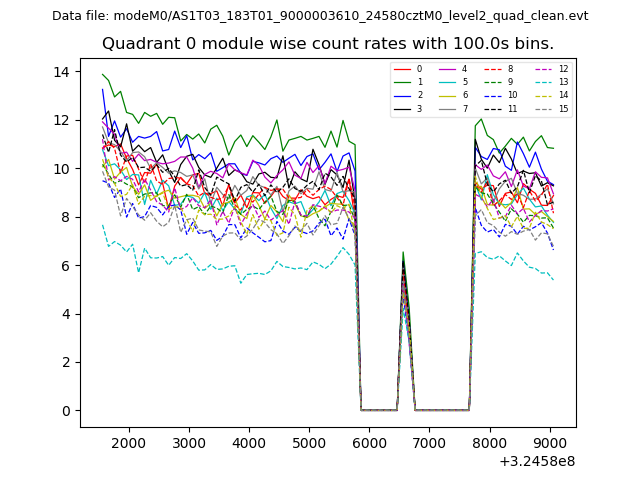 |
 |
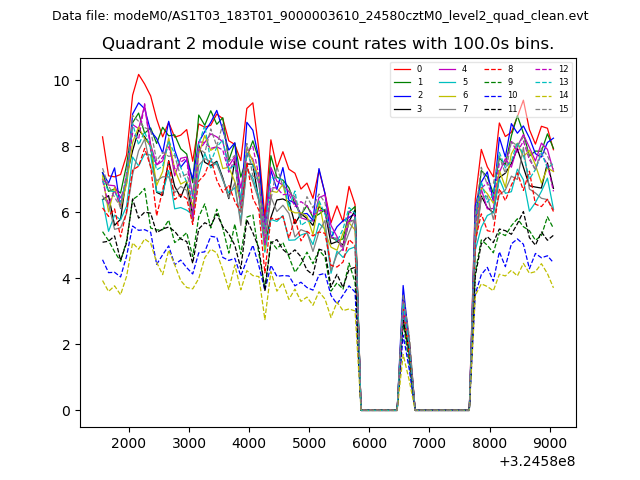
| Module-wise count rates for Quadrant B Data is divided into 100 sec bins |
 |
 |
| Module-wise count rates for Quadrant C Data is divided into 100 sec bins |
 |
 |
| Module-wise count rates for Quadrant D Data is divided into 100 sec bins |
 |
 |
| Parameter | Plot |
|---|---|
| CZT HV Monitor | 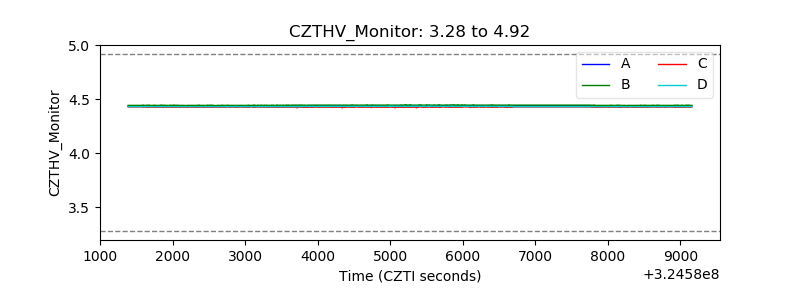 |
| D_VDD | 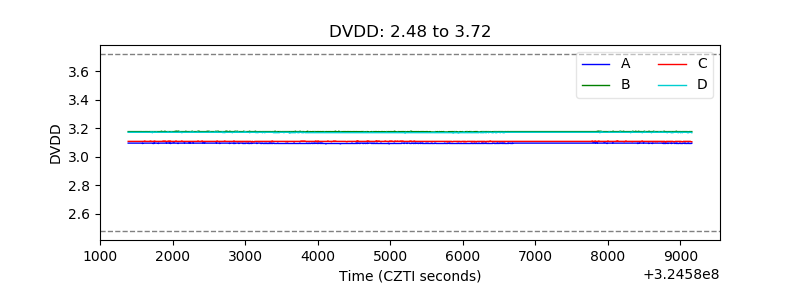 |
| Temperature 1 | 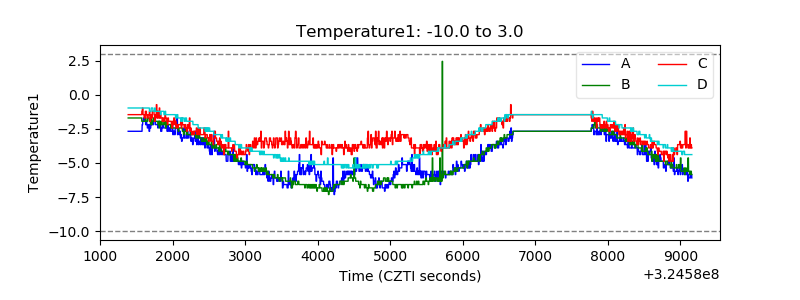 |
| Veto HV Monitor | 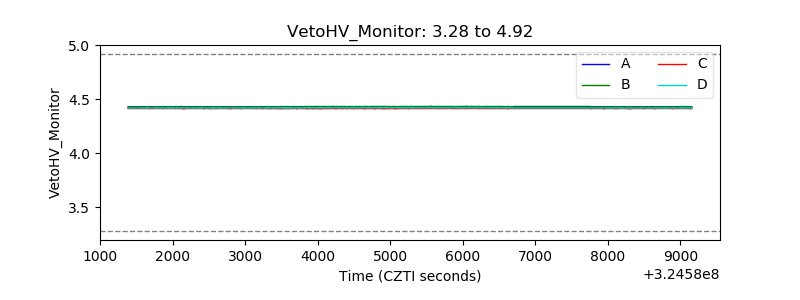 |
| Veto LLD | 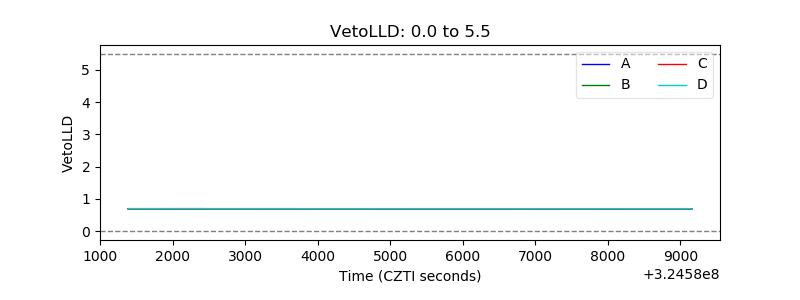 |
| Alpha Counter | 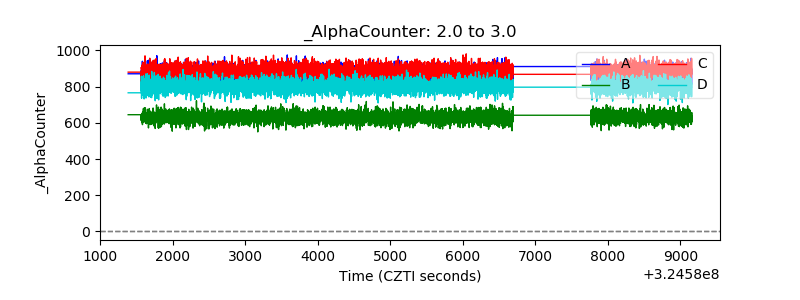 |
| _CPM_Rate | 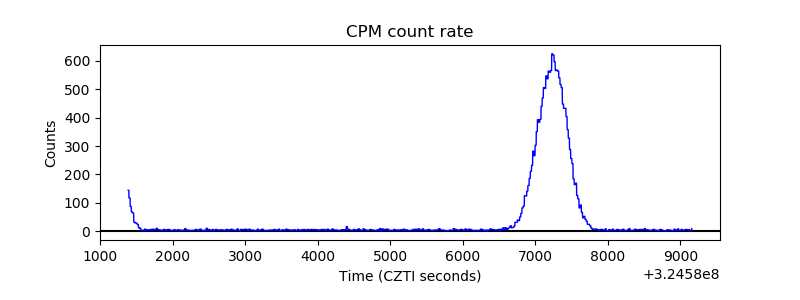 |
| CZT Counter | 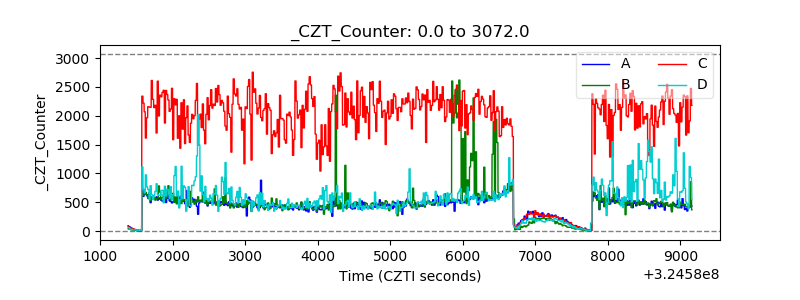 |
| +2.5 Volts monitor | 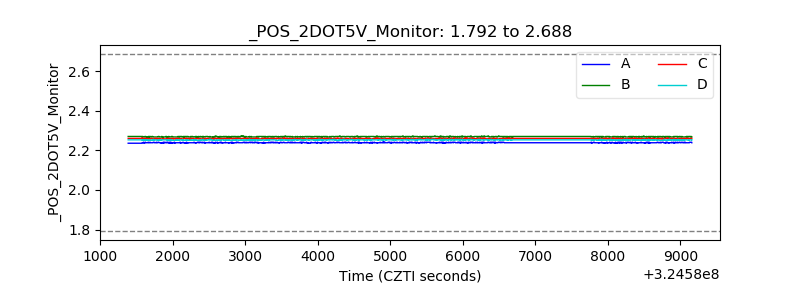 |
| +5 Volts monitor | 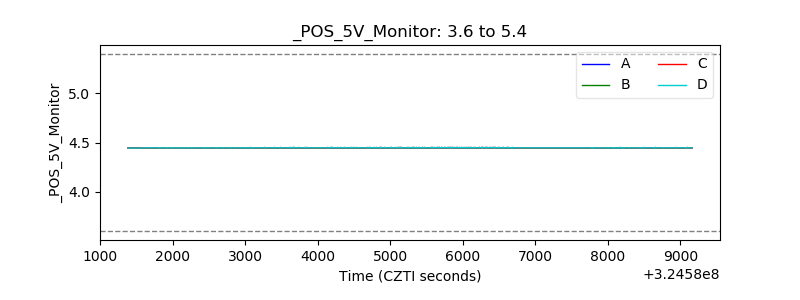 |
| _ROLL_ROT | 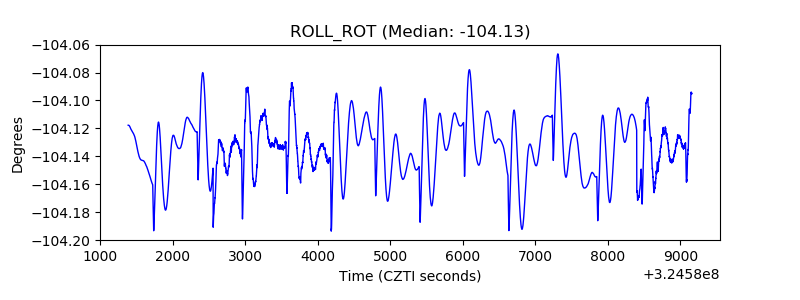 |
| _Roll_DEC | 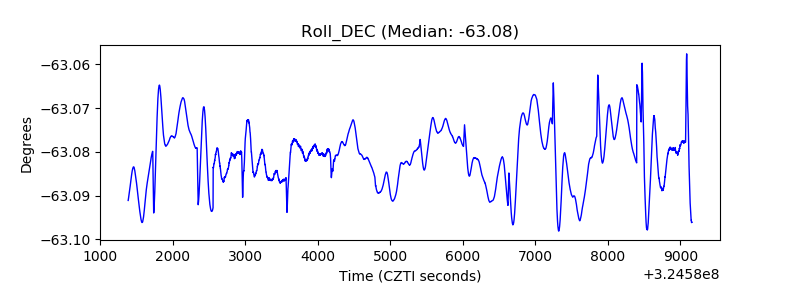 |
| _Roll_RA | 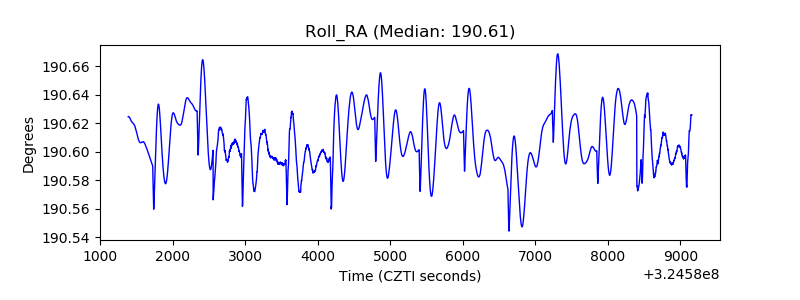 |
| Veto Counter | 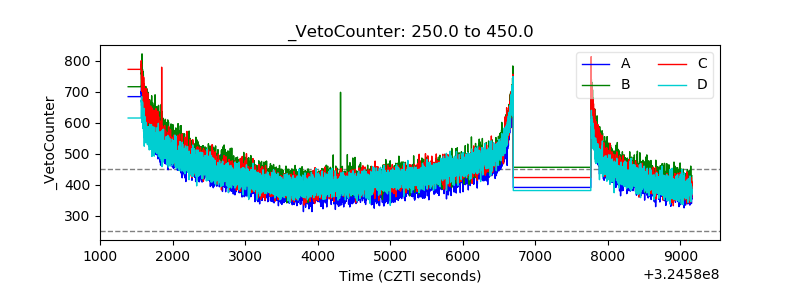 |