| Param | Original file | Final file |
|---|---|---|
| Filename | modeM0/AS1T03_183T01_9000003610_24582cztM0_level2.evt | modeM0/AS1T03_183T01_9000003610_24582cztM0_level2_quad_clean.evt |
| Size (bytes) | 858,168,000 | 128,272,320 |
| Size | 818.4 MB | 122.3 MB |
| Events in quadrant A | 3,500,310 | 899,019 |
| Events in quadrant B | 3,834,751 | 909,963 |
| Events in quadrant C | 13,341,402 | 712,512 |
| Events in quadrant D | 4,799,074 | 832,531 |
| Mode M0 | |||
|---|---|---|---|
| Quadrant | BADHDUFLAG | Total packets | Discarded packets |
| A | 0 | 15531 | 1 |
| B | 0 | 16426 | 1 |
| C | 0 | 44916 | 1 |
| D | 0 | 19445 | 1 |
| Mode SS | |||
|---|---|---|---|
| Quadrant | BADHDUFLAG | Total packets | Discarded packets |
| A | 0 | 154 | 0 |
| B | 0 | 154 | 0 |
| C | 0 | 154 | 0 |
| D | 0 | 154 | 0 |
| Mode M9 | |||
|---|---|---|---|
| Quadrant | BADHDUFLAG | Total packets | Discarded packets |
| A | 0 | 3 | 0 |
| B | 0 | 3 | 0 |
| C | 0 | 3 | 0 |
| D | 0 | 3 | 0 |
| Quadrant | Total seconds | Saturated seconds | Saturation percentage |
|---|---|---|---|
| A | 7613 | 22 | 0.288979% |
| B | 7614 | 79 | 1.037562% |
| C | 7614 | 3707 | 48.686630% |
| D | 7614 | 66 | 0.866824% |
Noise dominated data is calculated using 1-second bins in cleaned event files. If a bin has >2000 counts, and if more than 50% of those come from <1% of pixels, then it is considered to be noise-dominated and hence unusable.
| Quadrant | # 1 sec bins | Bins with >0 counts | Bins with >2000 counts | High rate bins dominated by noise | Noise dominated (total time) | Noise dominated (detector-on time) | Marked lightcurve |
|---|---|---|---|---|---|---|---|
| A | 7878 | 7614 | 0 | 0 | 0.00% | 0.00% | 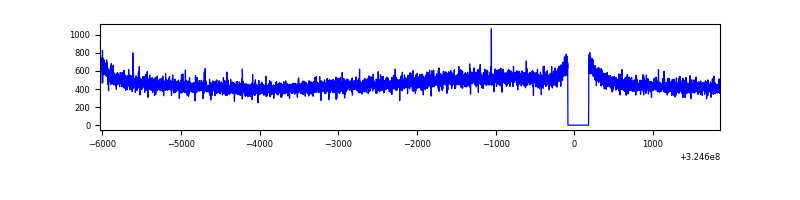 |
| B | 7879 | 7615 | 15 | 15 | 0.19% | 0.20% |  |
| C | 7879 | 7615 | 2692 | 2692 | 34.17% | 35.35% | 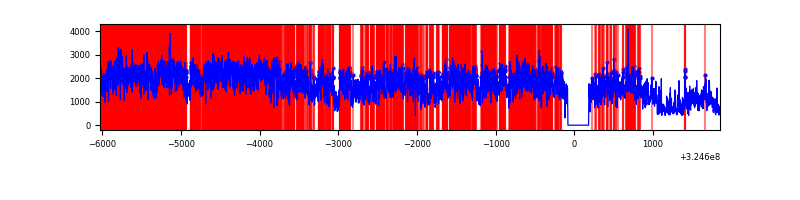 |
| D | 7879 | 7615 | 25 | 25 | 0.32% | 0.33% | 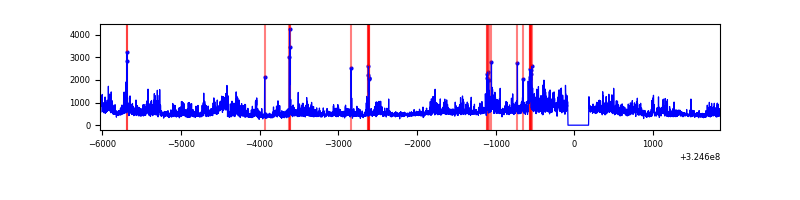 |
Top three noisy pixels from each quadrant. If the there are fewer than three noisy pixels in the level2.evt file, extra rows are filled as -1
| Pixel properties | Quadrant properties | ||||||
|---|---|---|---|---|---|---|---|
| Quadrant | DetID | PixID | Counts | Sigma | Mean | Median | Sigma |
| A | 13 | 254 | 12801 | 65.49 | 907 | 886 | 181.9 |
| A | 3 | 137 | 8279 | 40.64 | 907 | 886 | 181.9 |
| A | 0 | 226 | 7795 | 37.98 | 907 | 886 | 181.9 |
| B | 3 | 64 | 144198 | 840.67 | 905 | 881 | 170.5 |
| B | 15 | 32 | 91082 | 529.1 | 905 | 881 | 170.5 |
| B | 0 | 190 | 44150 | 253.8 | 905 | 881 | 170.5 |
| C | 7 | 247 | 10027561 | 56207.32 | 772 | 775 | 178.4 |
| C | 2 | 16 | 123220 | 686.39 | 772 | 775 | 178.4 |
| C | 14 | 238 | 121663 | 677.66 | 772 | 775 | 178.4 |
| D | 8 | 195 | 1260261 | 5971.81 | 868 | 839 | 210.9 |
| D | 1 | 255 | 106592 | 501.45 | 868 | 839 | 210.9 |
| D | 7 | 238 | 78814 | 369.73 | 868 | 839 | 210.9 |
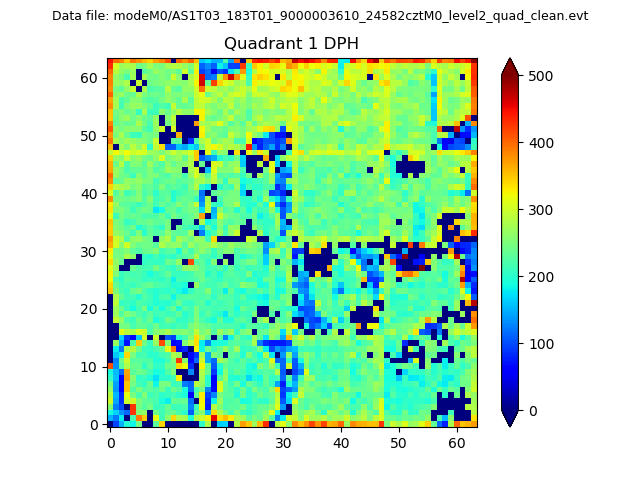
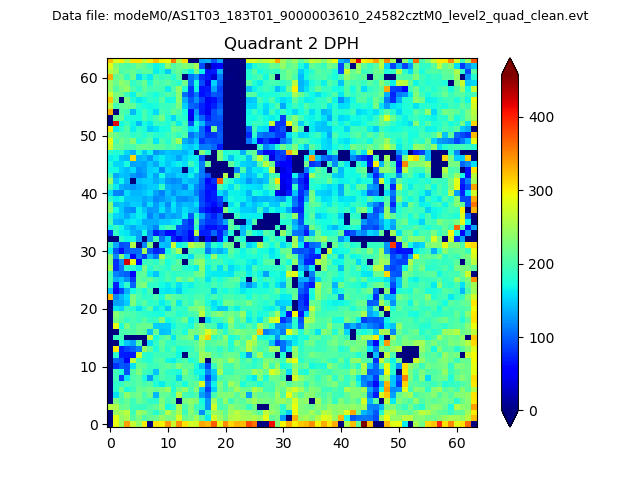
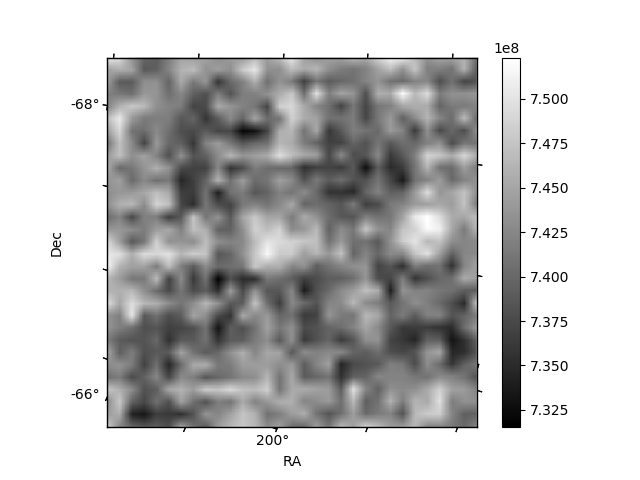
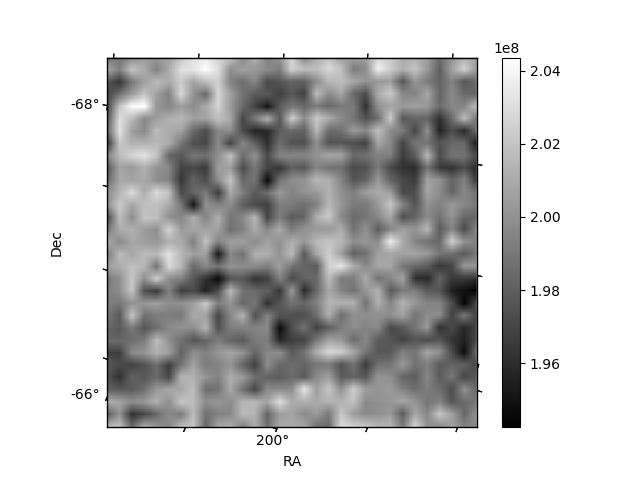
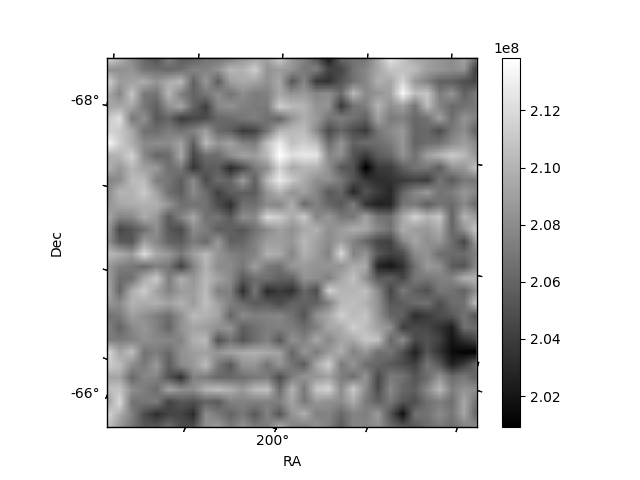
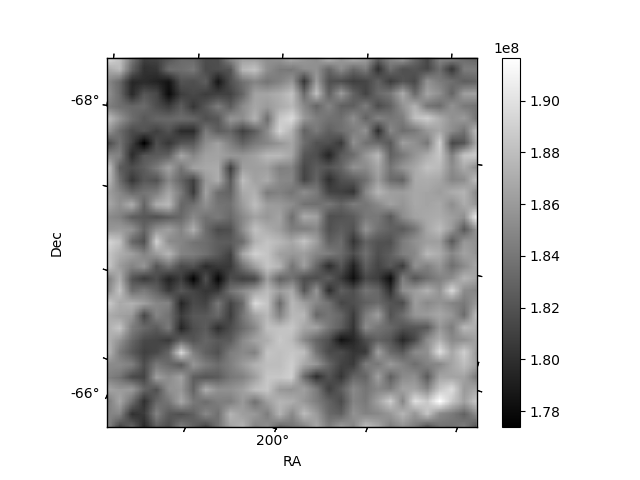
Histogram calculated using DETX and DETY for each event in the final _common_clean file
| Quadrant A | 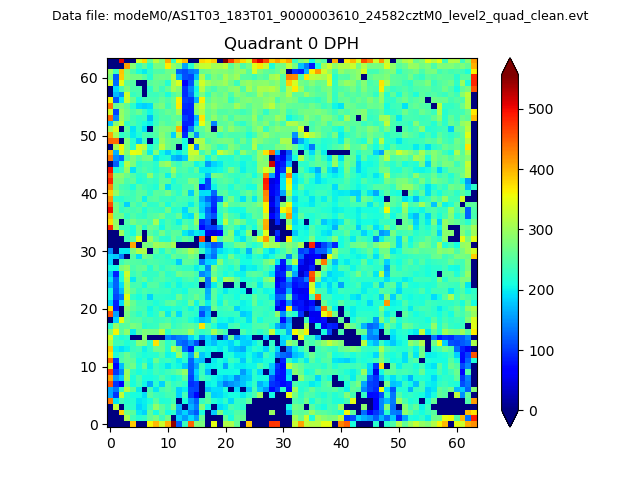 |
 |
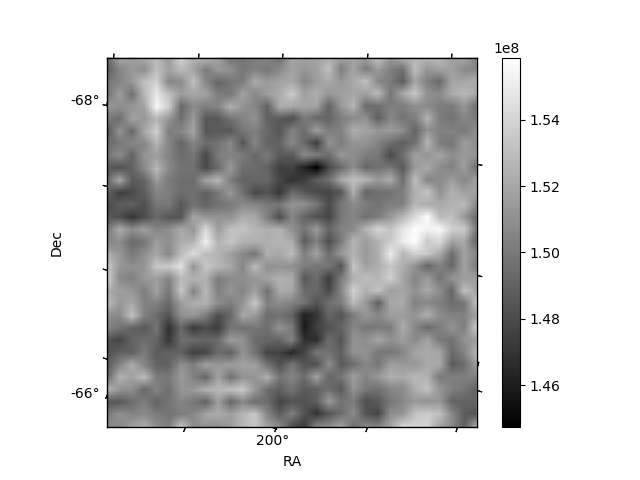
Quadrant B |
|---|---|---|---|
| Quadrant D | 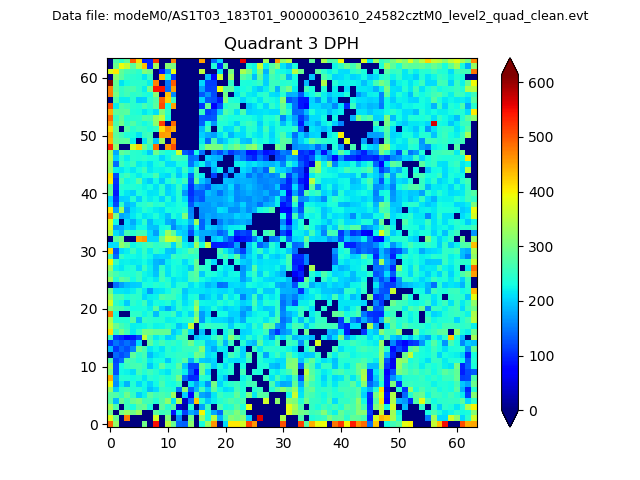 |
 |
Quadrant C |
| Plot type | Count rate plots | Images |
|---|---|---|
| Comparison with Poisson distribution Blue bars denote a histogram of data divided into 1 sec bins. Red curve is a Poisson curve with rate = median count rate of data. |
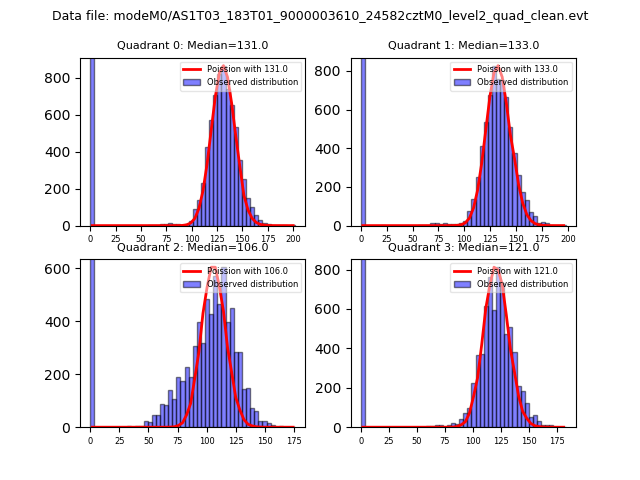 |
 |
| Quadrant-wise count rates Data is divided into 100 sec bins |
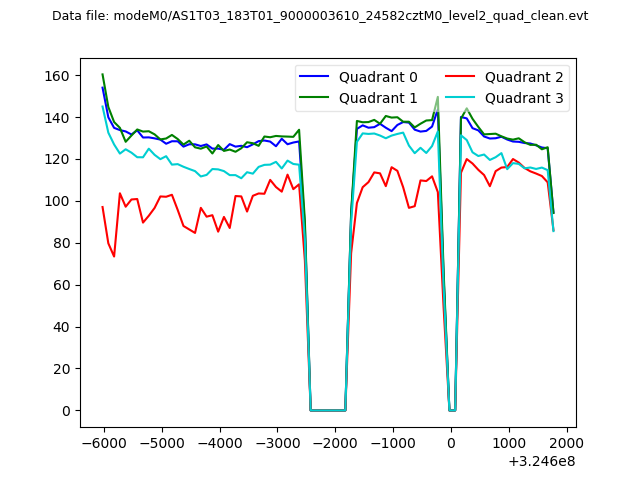 |
|
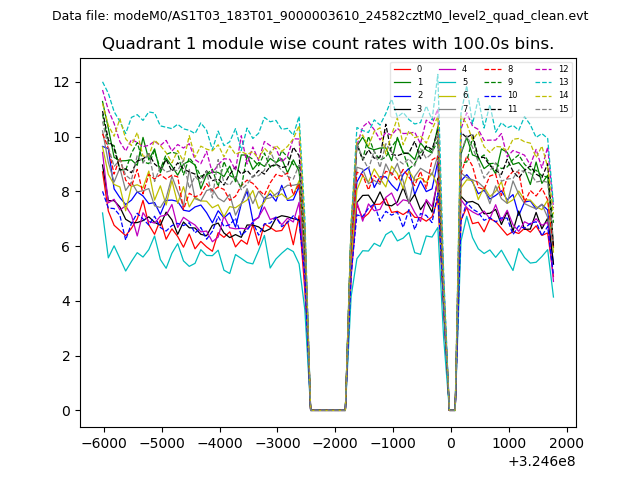
| Module-wise count rates for Quadrant A Data is divided into 100 sec bins |
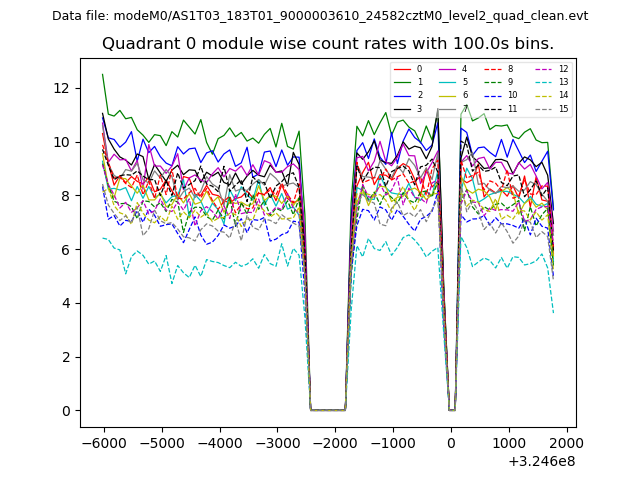 |
 |
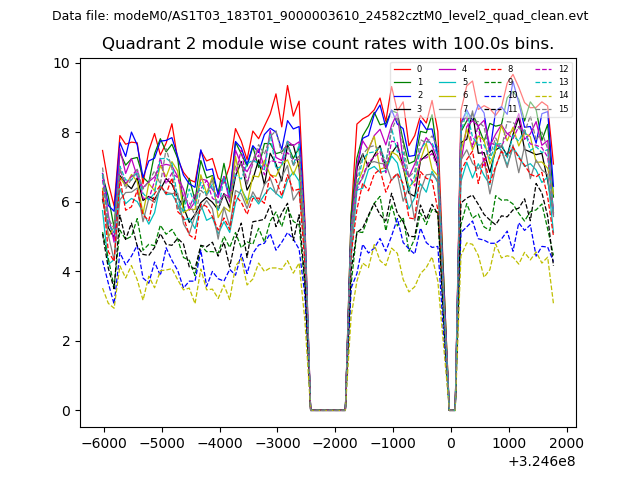
| Module-wise count rates for Quadrant B Data is divided into 100 sec bins |
 |
 |
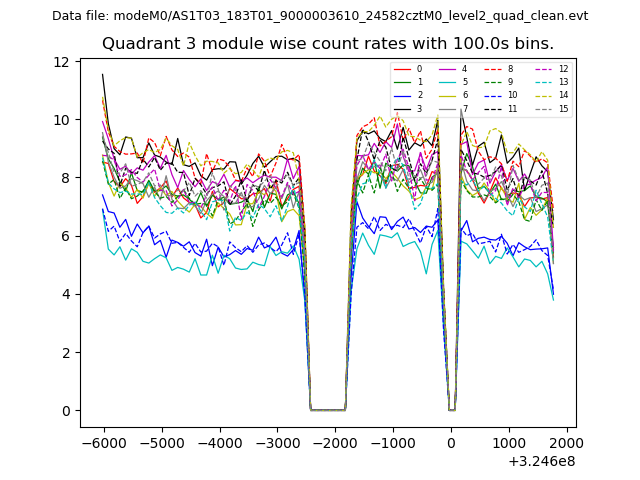
| Module-wise count rates for Quadrant C Data is divided into 100 sec bins |
 |
 |
| Module-wise count rates for Quadrant D Data is divided into 100 sec bins |
 |
 |
| Parameter | Plot |
|---|---|
| CZT HV Monitor | 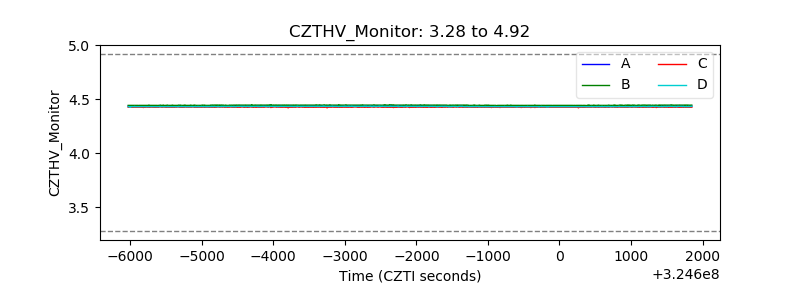 |
| D_VDD |  |
| Temperature 1 | 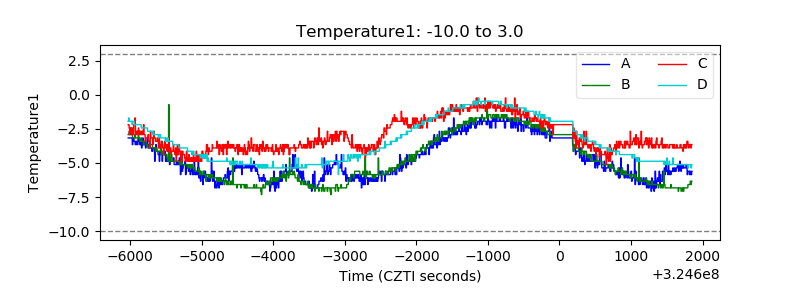 |
| Veto HV Monitor | 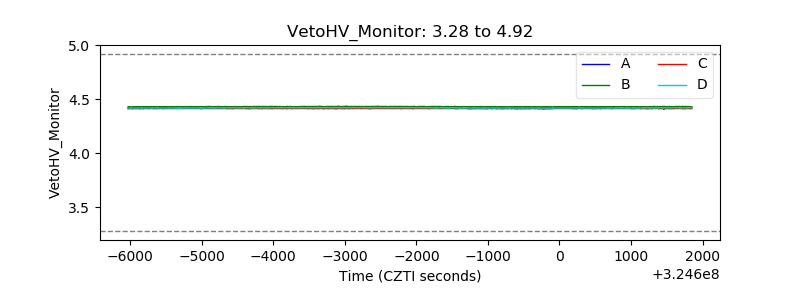 |
| Veto LLD | 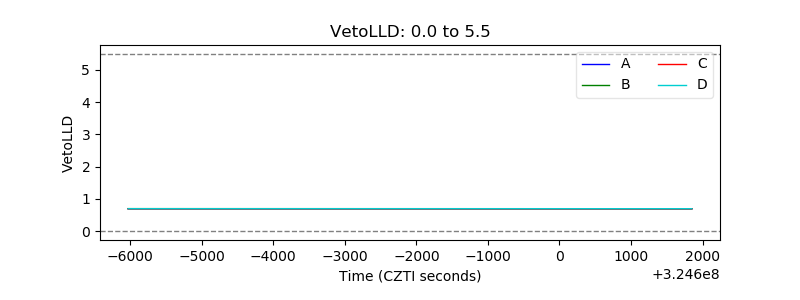 |
| Alpha Counter | 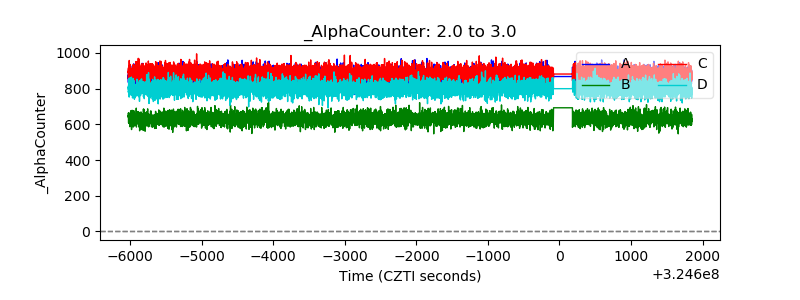 |
| _CPM_Rate | 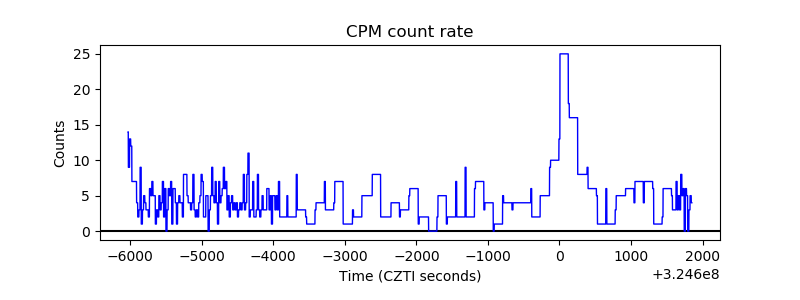 |
| CZT Counter | 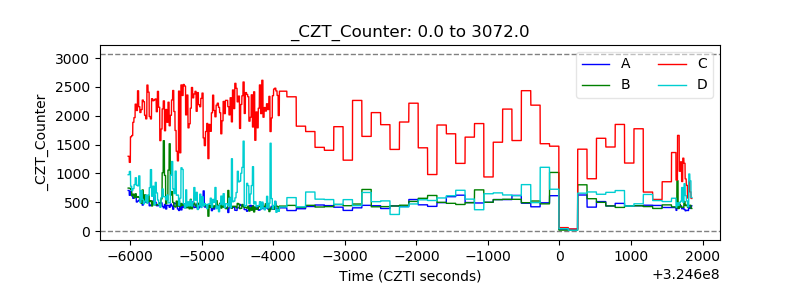 |
| +2.5 Volts monitor |  |
| +5 Volts monitor |  |
| _ROLL_ROT | 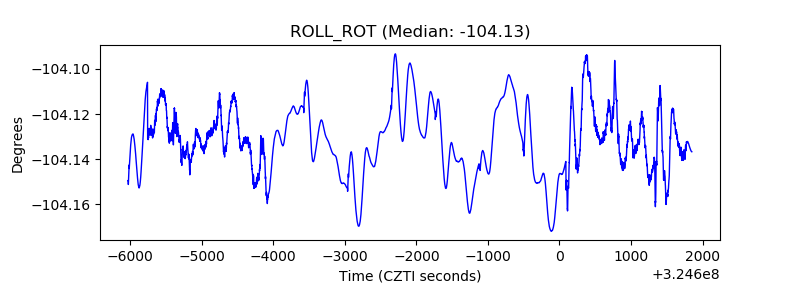 |
| _Roll_DEC | 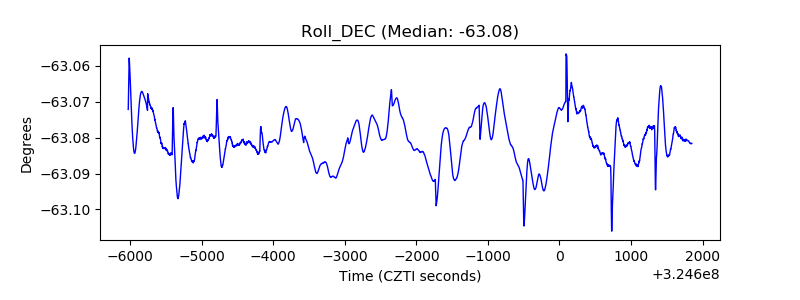 |
| _Roll_RA | 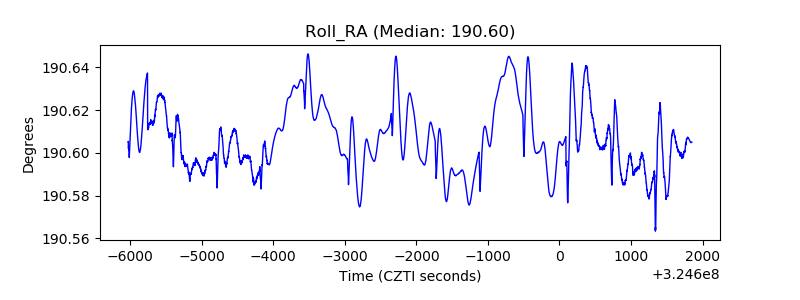 |
| Veto Counter | 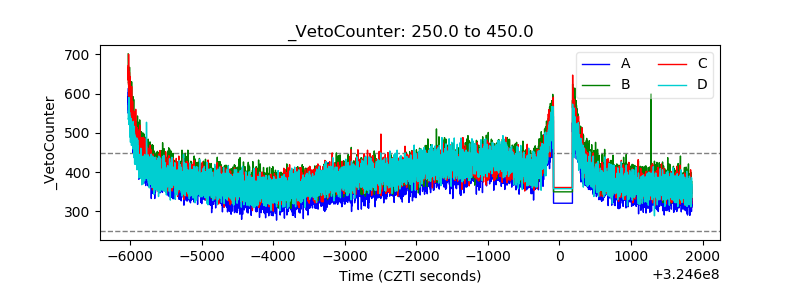 |