| Param | Original file | Final file |
|---|---|---|
| Filename | modeM0/AS1T03_183T01_9000003610_24583cztM0_level2.evt | modeM0/AS1T03_183T01_9000003610_24583cztM0_level2_quad_clean.evt |
| Size (bytes) | 728,372,160 | 127,440,000 |
| Size | 694.6 MB | 121.5 MB |
| Events in quadrant A | 3,436,800 | 879,303 |
| Events in quadrant B | 4,301,416 | 866,465 |
| Events in quadrant C | 9,148,439 | 774,986 |
| Events in quadrant D | 4,663,089 | 814,219 |
| Mode M0 | |||
|---|---|---|---|
| Quadrant | BADHDUFLAG | Total packets | Discarded packets |
| A | 0 | 15291 | 1 |
| B | 0 | 17681 | 1 |
| C | 0 | 32458 | 1 |
| D | 0 | 18995 | 1 |
| Mode SS | |||
|---|---|---|---|
| Quadrant | BADHDUFLAG | Total packets | Discarded packets |
| A | 0 | 152 | 0 |
| B | 0 | 152 | 0 |
| C | 0 | 152 | 0 |
| D | 0 | 152 | 0 |
| Mode M9 | |||
|---|---|---|---|
| Quadrant | BADHDUFLAG | Total packets | Discarded packets |
| A | 0 | 3 | 0 |
| B | 0 | 3 | 0 |
| C | 0 | 3 | 0 |
| D | 0 | 3 | 0 |
| Quadrant | Total seconds | Saturated seconds | Saturation percentage |
|---|---|---|---|
| A | 7544 | 42 | 0.556734% |
| B | 7544 | 346 | 4.586426% |
| C | 7543 | 1212 | 16.067878% |
| D | 7544 | 63 | 0.835101% |
Noise dominated data is calculated using 1-second bins in cleaned event files. If a bin has >2000 counts, and if more than 50% of those come from <1% of pixels, then it is considered to be noise-dominated and hence unusable.
| Quadrant | # 1 sec bins | Bins with >0 counts | Bins with >2000 counts | High rate bins dominated by noise | Noise dominated (total time) | Noise dominated (detector-on time) | Marked lightcurve |
|---|---|---|---|---|---|---|---|
| A | 7769 | 7546 | 0 | 0 | 0.00% | 0.00% | 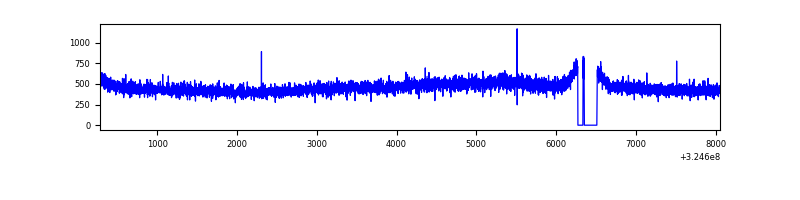 |
| B | 7769 | 7546 | 203 | 203 | 2.61% | 2.69% | 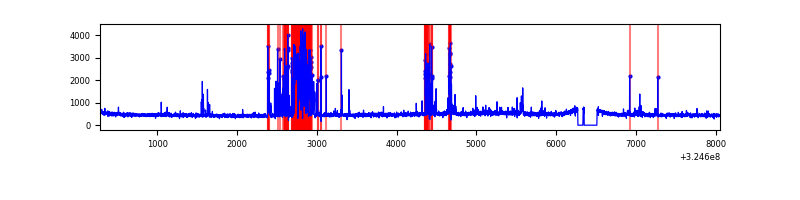 |
| C | 7768 | 7545 | 551 | 551 | 7.09% | 7.30% | 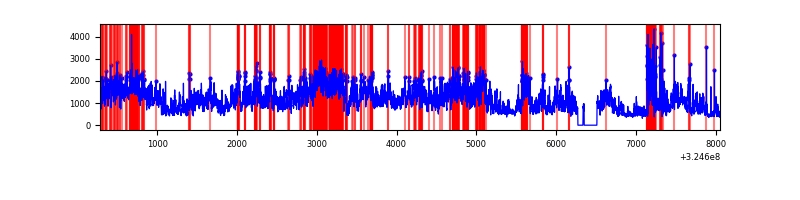 |
| D | 7769 | 7546 | 10 | 10 | 0.13% | 0.13% | 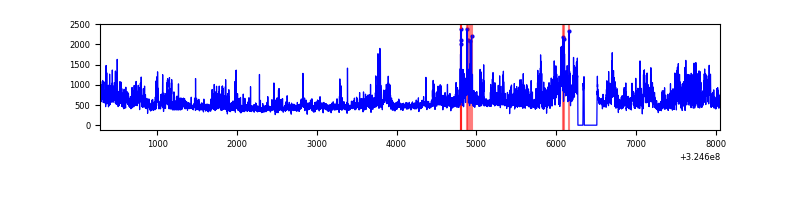 |
Top three noisy pixels from each quadrant. If the there are fewer than three noisy pixels in the level2.evt file, extra rows are filled as -1
| Pixel properties | Quadrant properties | ||||||
|---|---|---|---|---|---|---|---|
| Quadrant | DetID | PixID | Counts | Sigma | Mean | Median | Sigma |
| A | 13 | 254 | 12552 | 65.27 | 891 | 870 | 179.0 |
| A | 3 | 137 | 7992 | 39.79 | 891 | 870 | 179.0 |
| A | 0 | 226 | 7630 | 37.77 | 891 | 870 | 179.0 |
| B | 3 | 64 | 837433 | 5027.65 | 877 | 854 | 166.4 |
| B | 12 | 111 | 20455 | 117.8 | 877 | 854 | 166.4 |
| B | 11 | 111 | 17970 | 102.86 | 877 | 854 | 166.4 |
| C | 7 | 247 | 5443335 | 28681.4 | 819 | 824 | 189.8 |
| C | 2 | 16 | 341567 | 1795.68 | 819 | 824 | 189.8 |
| C | 14 | 238 | 130696 | 684.41 | 819 | 824 | 189.8 |
| D | 8 | 195 | 1331652 | 6395.37 | 854 | 827 | 208.1 |
| D | 1 | 52 | 47001 | 221.89 | 854 | 827 | 208.1 |
| D | 12 | 217 | 45152 | 213.01 | 854 | 827 | 208.1 |
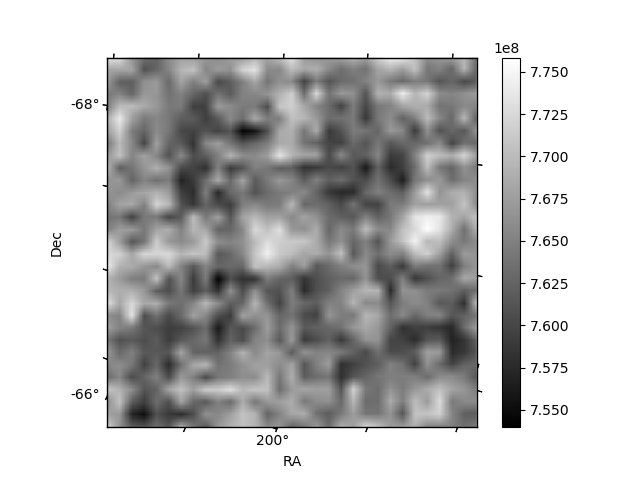
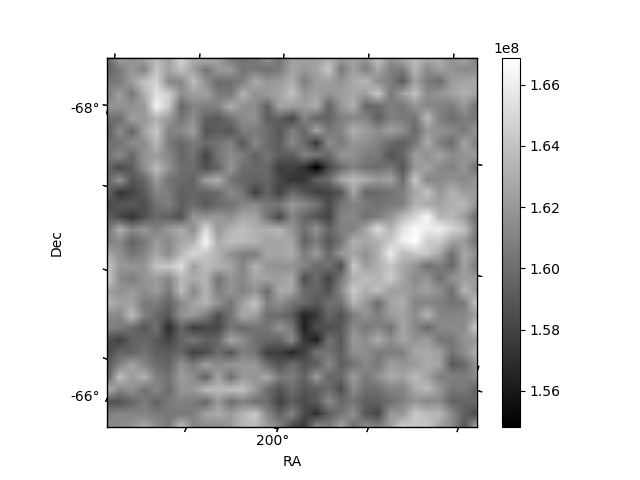
Histogram calculated using DETX and DETY for each event in the final _common_clean file
| Quadrant A | 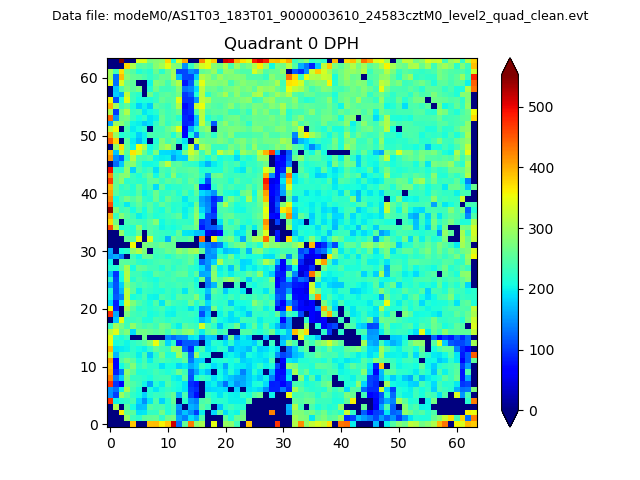 |
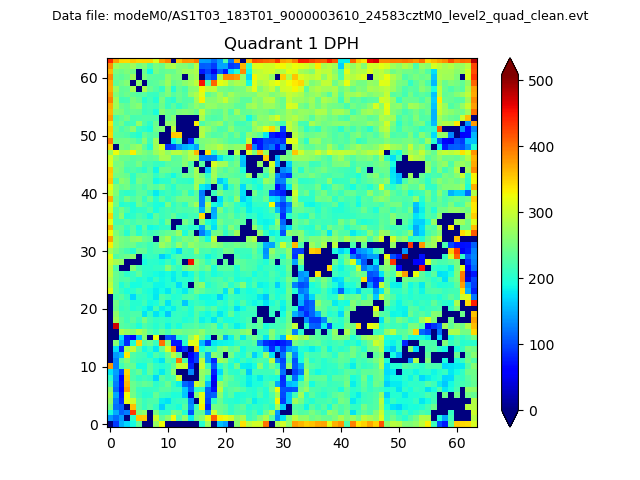 |
Quadrant B |
|---|---|---|---|
| Quadrant D |  |
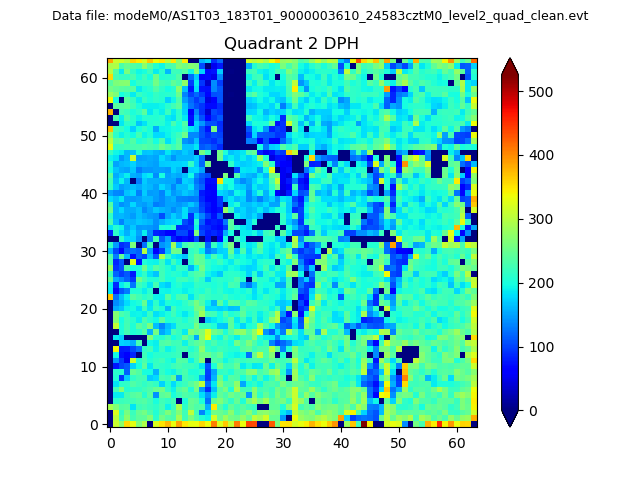 |
Quadrant C |
| Plot type | Count rate plots | Images |
|---|---|---|
| Comparison with Poisson distribution Blue bars denote a histogram of data divided into 1 sec bins. Red curve is a Poisson curve with rate = median count rate of data. |
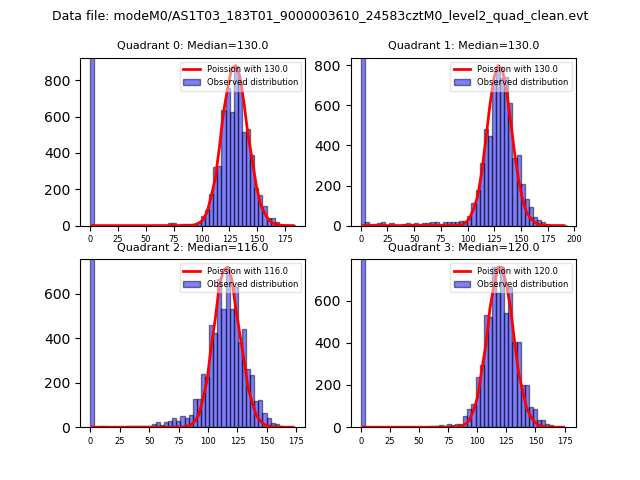 |
 |
| Quadrant-wise count rates Data is divided into 100 sec bins |
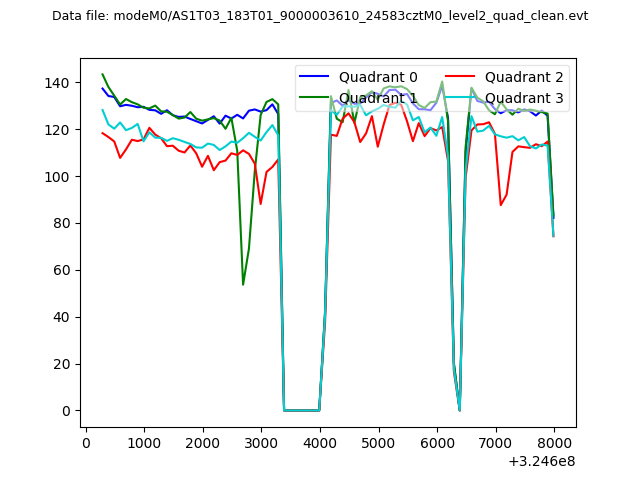 |
|
| Module-wise count rates for Quadrant A Data is divided into 100 sec bins |
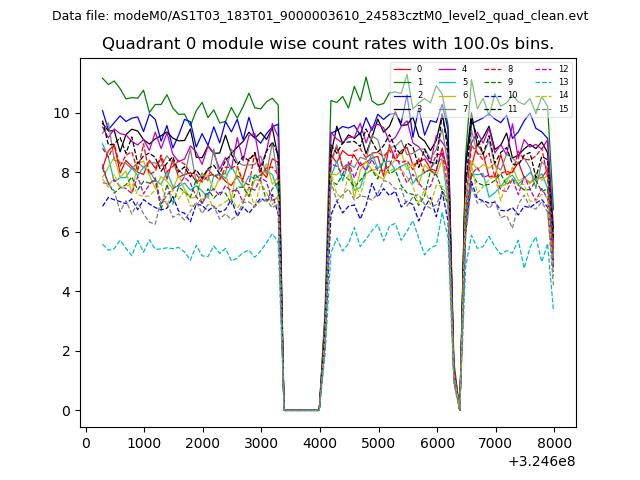 |
 |
| Module-wise count rates for Quadrant B Data is divided into 100 sec bins |
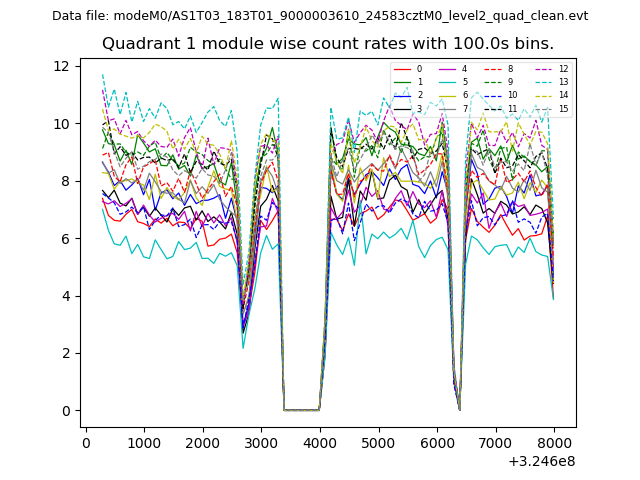 |
 |
| Module-wise count rates for Quadrant C Data is divided into 100 sec bins |
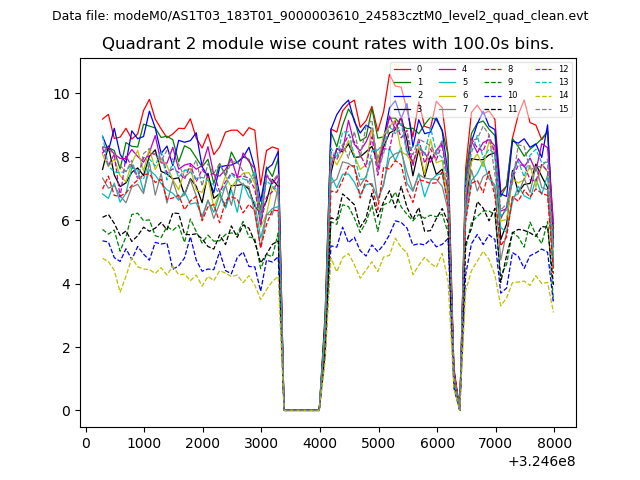 |
 |
| Module-wise count rates for Quadrant D Data is divided into 100 sec bins |
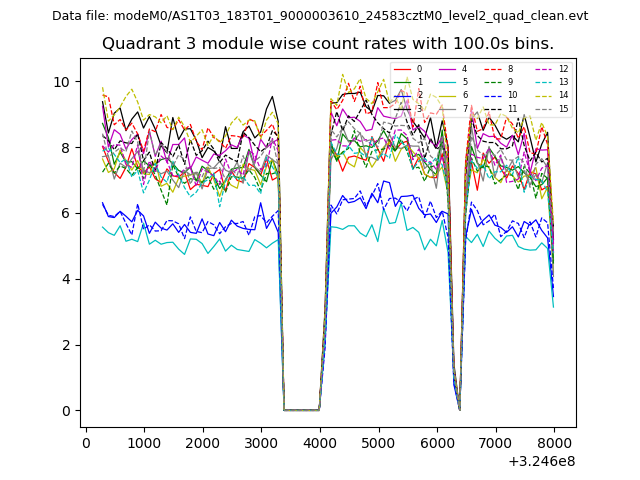 |
 |
| Parameter | Plot |
|---|---|
| CZT HV Monitor | 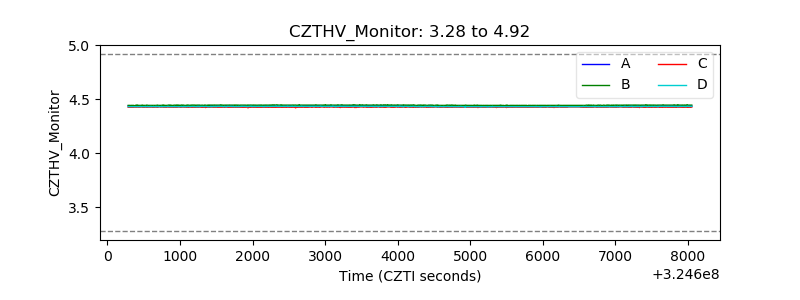 |
| D_VDD |  |
| Temperature 1 | 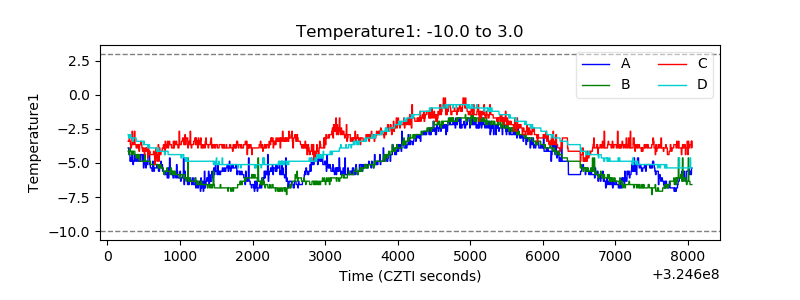 |
| Veto HV Monitor | 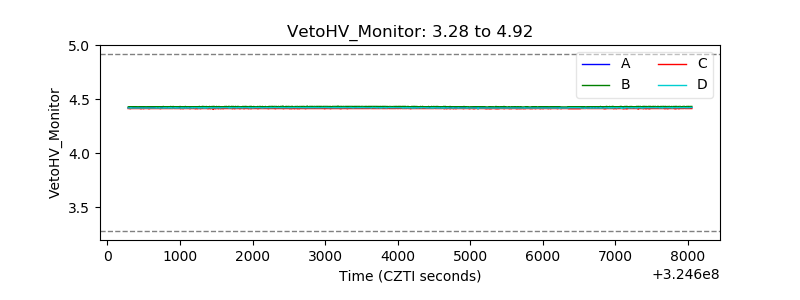 |
| Veto LLD | 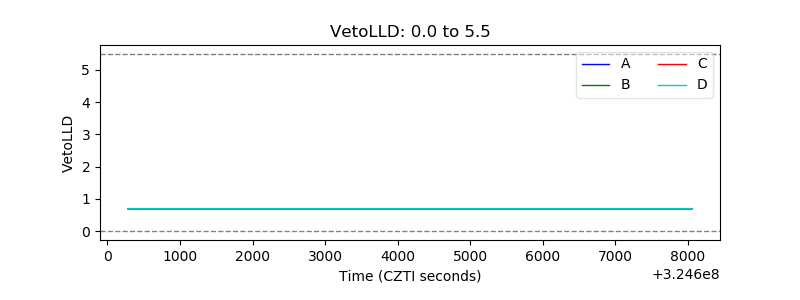 |
| Alpha Counter | 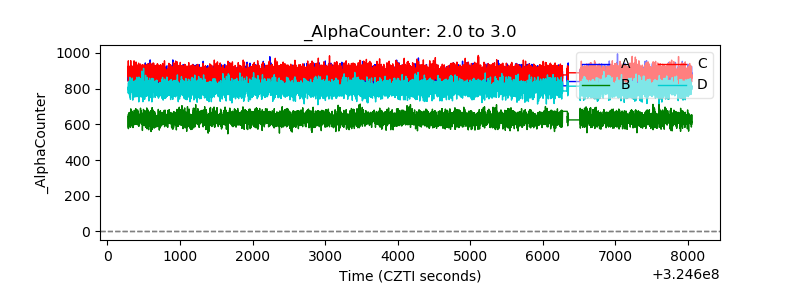 |
| _CPM_Rate | 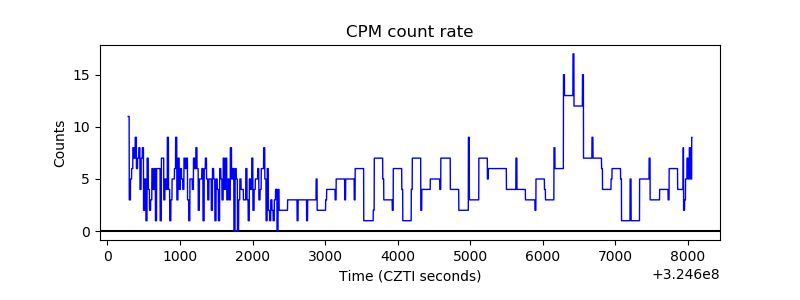 |
| CZT Counter | 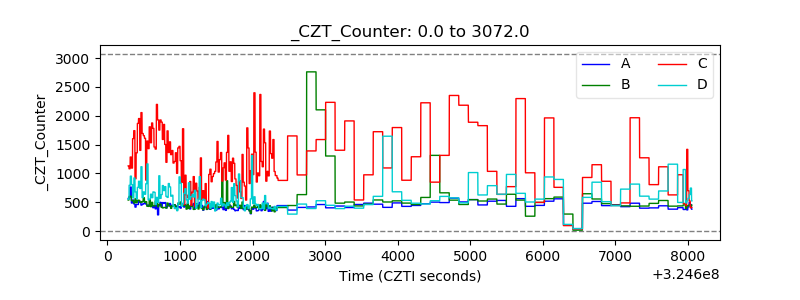 |
| +2.5 Volts monitor |  |
| +5 Volts monitor |  |
| _ROLL_ROT | 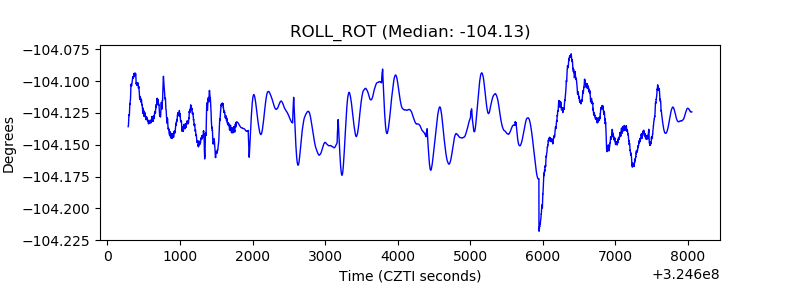 |
| _Roll_DEC | 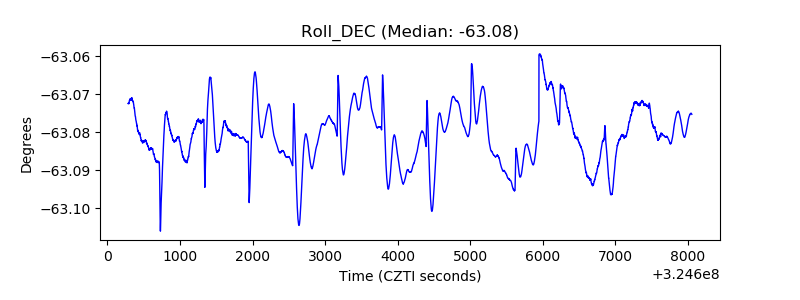 |
| _Roll_RA | 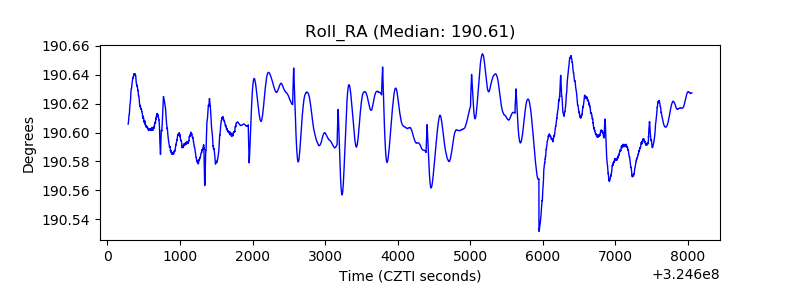 |
| Veto Counter | 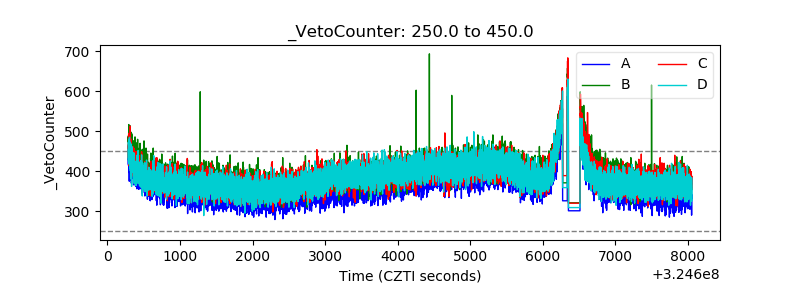 |