| Param | Original file | Final file |
|---|---|---|
| Filename | modeM0/AS1T03_183T01_9000003610_24587cztM0_level2.evt | modeM0/AS1T03_183T01_9000003610_24587cztM0_level2_quad_clean.evt |
| Size (bytes) | 549,823,680 | 99,607,680 |
| Size | 524.4 MB | 95.0 MB |
| Events in quadrant A | 2,768,632 | 676,603 |
| Events in quadrant B | 3,336,002 | 681,385 |
| Events in quadrant C | 5,965,595 | 612,391 |
| Events in quadrant D | 4,174,680 | 626,673 |
| Mode M0 | |||
|---|---|---|---|
| Quadrant | BADHDUFLAG | Total packets | Discarded packets |
| A | 0 | 12206 | 1 |
| B | 0 | 13815 | 1 |
| C | 0 | 21959 | 1 |
| D | 0 | 16449 | 1 |
| Mode SS | |||
|---|---|---|---|
| Quadrant | BADHDUFLAG | Total packets | Discarded packets |
| A | 0 | 124 | 0 |
| B | 0 | 124 | 0 |
| C | 0 | 124 | 0 |
| D | 0 | 124 | 0 |
| Mode M9 | |||
|---|---|---|---|
| Quadrant | BADHDUFLAG | Total packets | Discarded packets |
| A | 0 | 3 | 0 |
| B | 0 | 3 | 0 |
| C | 0 | 3 | 0 |
| D | 0 | 3 | 0 |
| Quadrant | Total seconds | Saturated seconds | Saturation percentage |
|---|---|---|---|
| A | 6005 | 40 | 0.666112% |
| B | 6006 | 184 | 3.063603% |
| C | 6006 | 602 | 10.023310% |
| D | 6006 | 67 | 1.115551% |
Noise dominated data is calculated using 1-second bins in cleaned event files. If a bin has >2000 counts, and if more than 50% of those come from <1% of pixels, then it is considered to be noise-dominated and hence unusable.
| Quadrant | # 1 sec bins | Bins with >0 counts | Bins with >2000 counts | High rate bins dominated by noise | Noise dominated (total time) | Noise dominated (detector-on time) | Marked lightcurve |
|---|---|---|---|---|---|---|---|
| A | 6230 | 6007 | 0 | 0 | 0.00% | 0.00% | 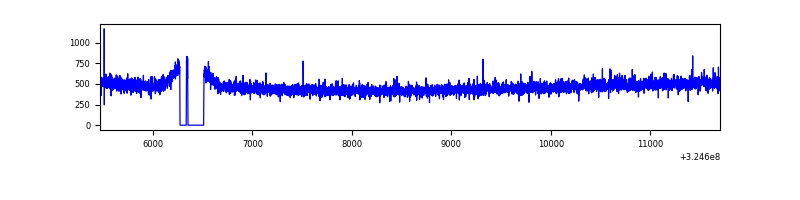 |
| B | 6231 | 6008 | 79 | 79 | 1.27% | 1.31% | 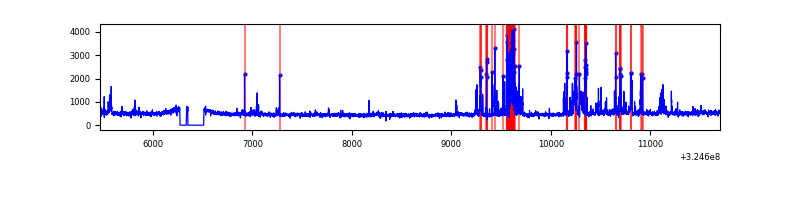 |
| C | 6231 | 6008 | 212 | 212 | 3.40% | 3.53% | 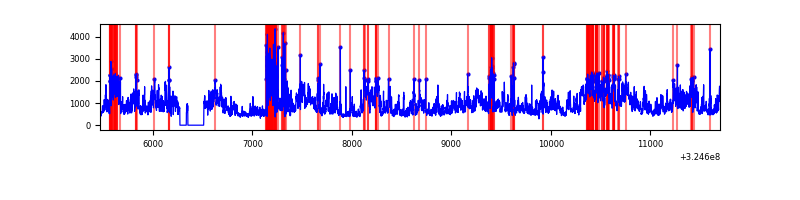 |
| D | 6231 | 6008 | 7 | 7 | 0.11% | 0.12% | 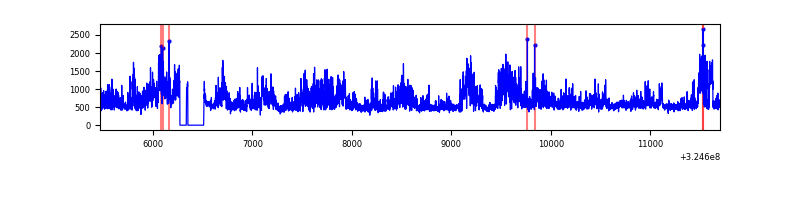 |
Top three noisy pixels from each quadrant. If the there are fewer than three noisy pixels in the level2.evt file, extra rows are filled as -1
| Pixel properties | Quadrant properties | ||||||
|---|---|---|---|---|---|---|---|
| Quadrant | DetID | PixID | Counts | Sigma | Mean | Median | Sigma |
| A | 13 | 254 | 9808 | 62.98 | 716 | 699 | 144.6 |
| A | 3 | 137 | 6568 | 40.58 | 716 | 699 | 144.6 |
| A | 0 | 226 | 6282 | 38.6 | 716 | 699 | 144.6 |
| B | 3 | 64 | 517594 | 3765.83 | 710 | 692 | 137.3 |
| B | 0 | 190 | 29901 | 212.8 | 710 | 692 | 137.3 |
| B | 12 | 111 | 16495 | 115.13 | 710 | 692 | 137.3 |
| C | 7 | 247 | 2792496 | 18087.75 | 665 | 668 | 154.3 |
| C | 2 | 16 | 454283 | 2938.89 | 665 | 668 | 154.3 |
| C | 14 | 238 | 106024 | 682.58 | 665 | 668 | 154.3 |
| D | 8 | 195 | 1418221 | 8415.66 | 688 | 666 | 168.4 |
| D | 1 | 52 | 135171 | 798.52 | 688 | 666 | 168.4 |
| D | 2 | 234 | 26784 | 155.06 | 688 | 666 | 168.4 |
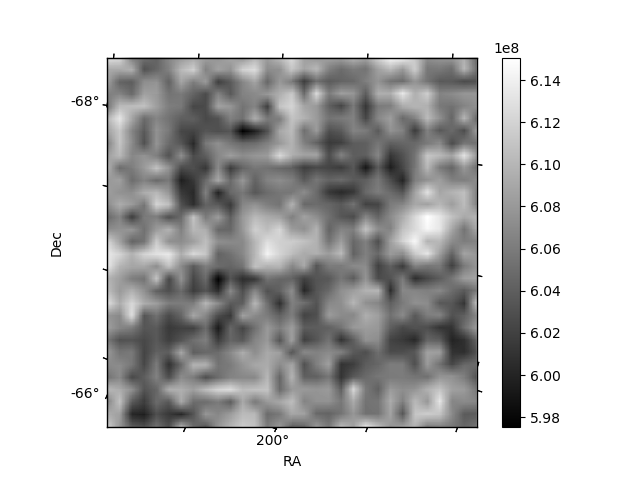
Histogram calculated using DETX and DETY for each event in the final _common_clean file
| Quadrant A | 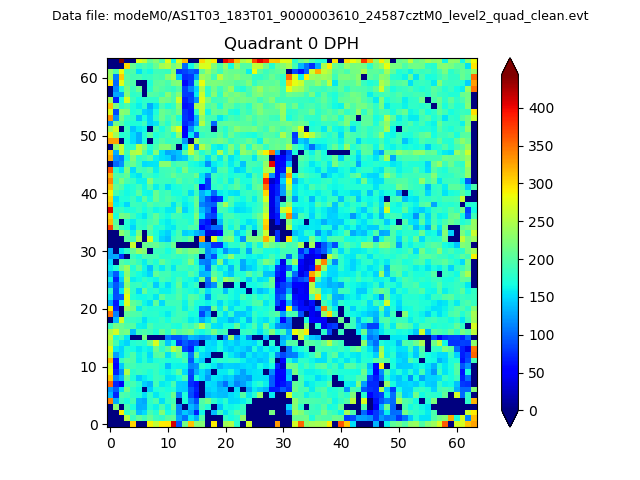 |
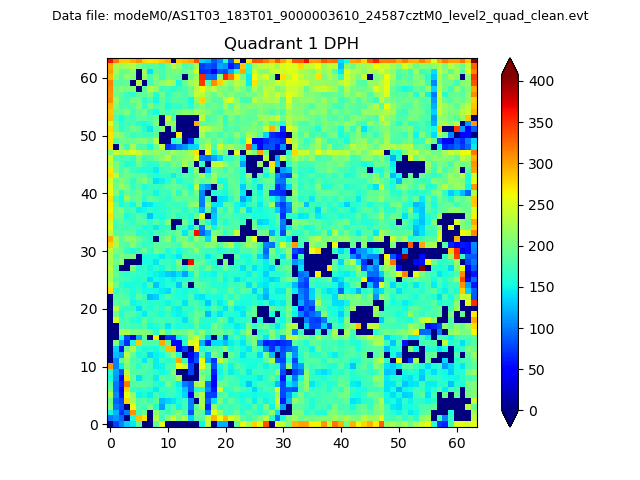 |
Quadrant B |
|---|---|---|---|
| Quadrant D |  |
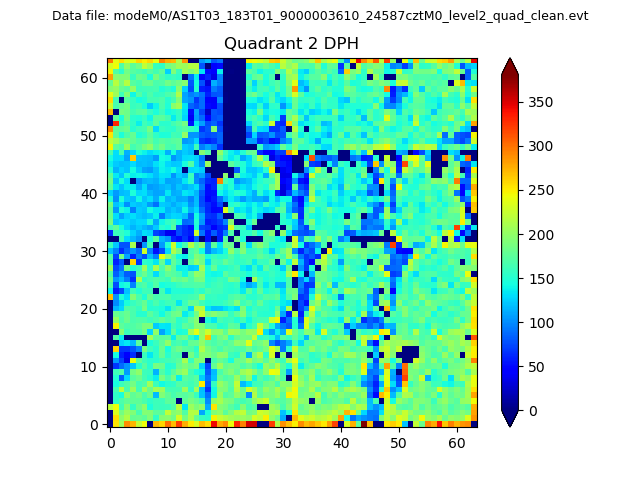 |
Quadrant C |
| Plot type | Count rate plots | Images |
|---|---|---|
| Comparison with Poisson distribution Blue bars denote a histogram of data divided into 1 sec bins. Red curve is a Poisson curve with rate = median count rate of data. |
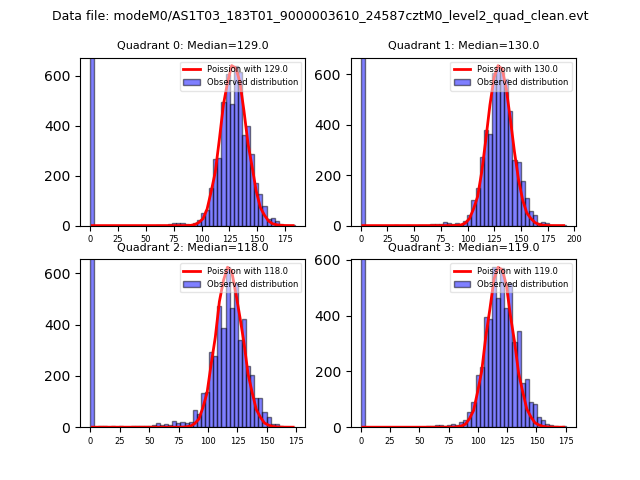 |
 |
| Quadrant-wise count rates Data is divided into 100 sec bins |
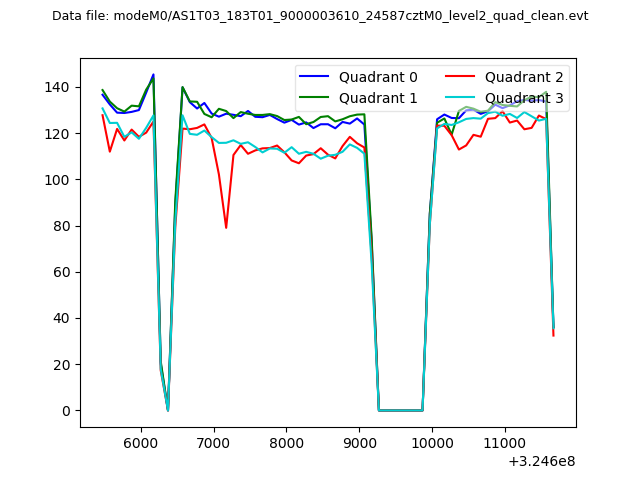 |
|
| Module-wise count rates for Quadrant A Data is divided into 100 sec bins |
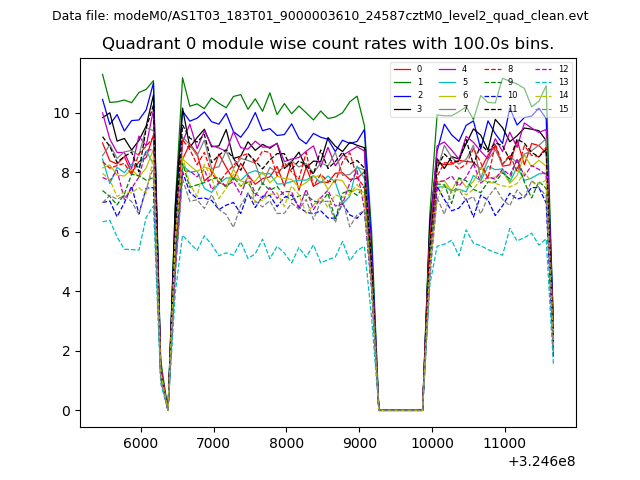 |
 |
| Module-wise count rates for Quadrant B Data is divided into 100 sec bins |
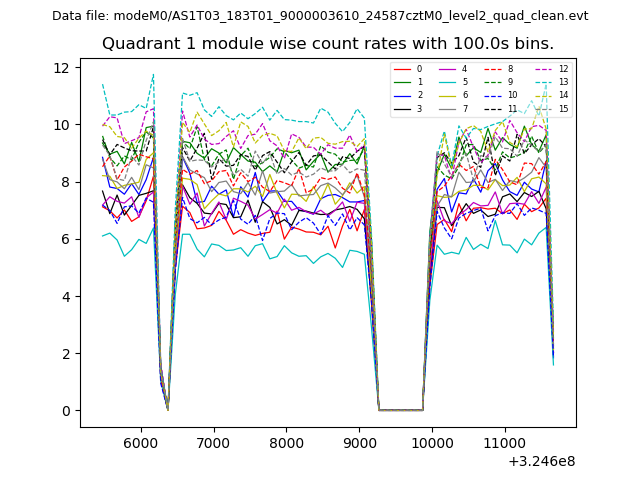 |
 |
| Module-wise count rates for Quadrant C Data is divided into 100 sec bins |
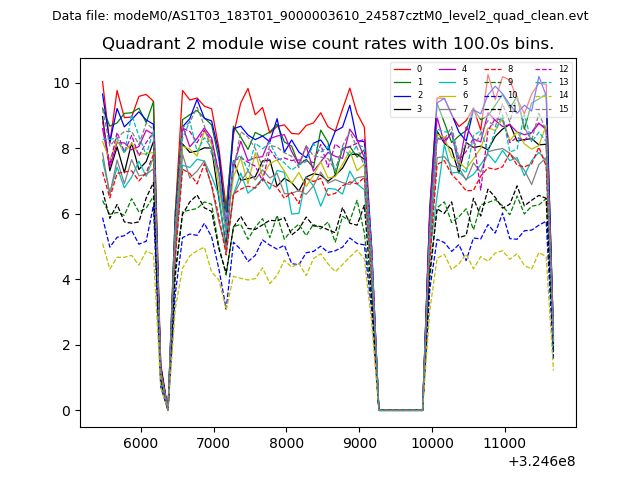 |
 |
| Module-wise count rates for Quadrant D Data is divided into 100 sec bins |
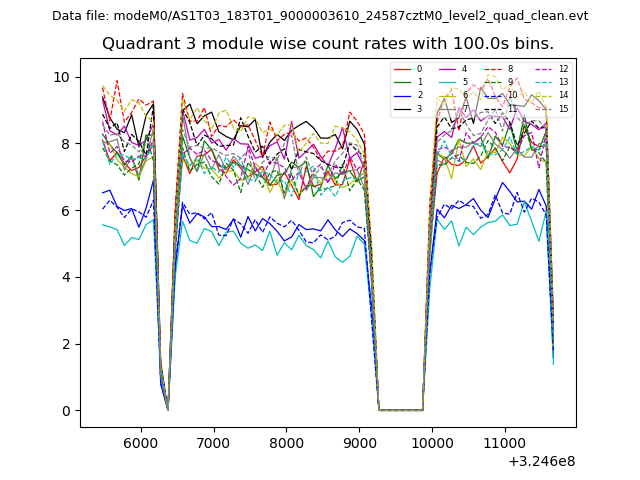 |
 |
| Parameter | Plot |
|---|---|
| CZT HV Monitor | 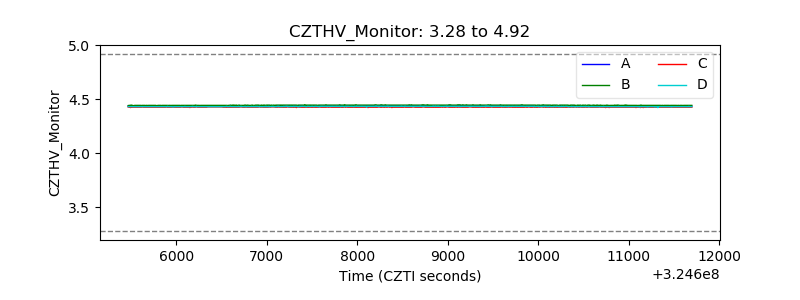 |
| D_VDD | 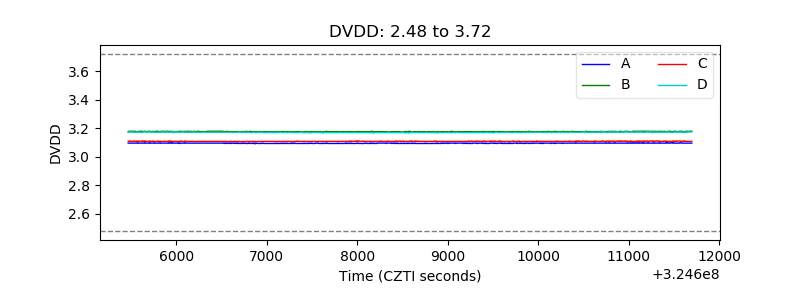 |
| Temperature 1 | 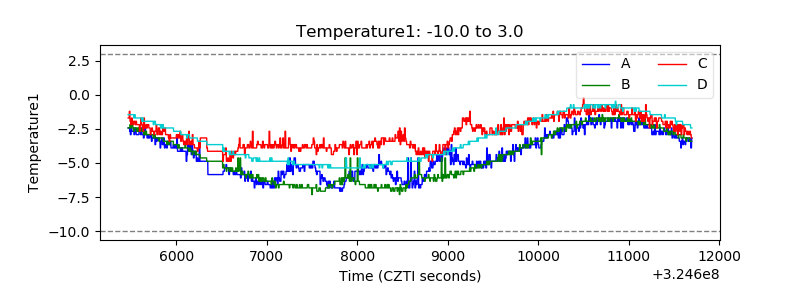 |
| Veto HV Monitor | 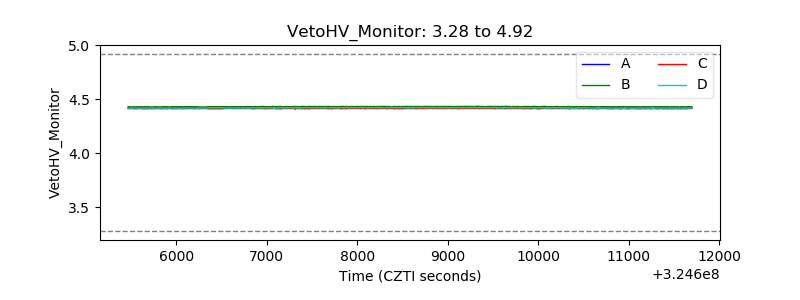 |
| Veto LLD | 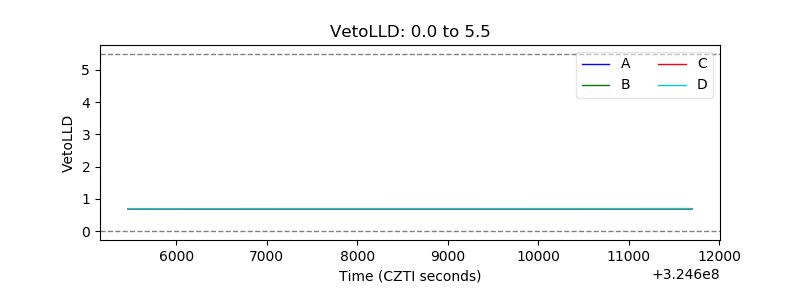 |
| Alpha Counter | 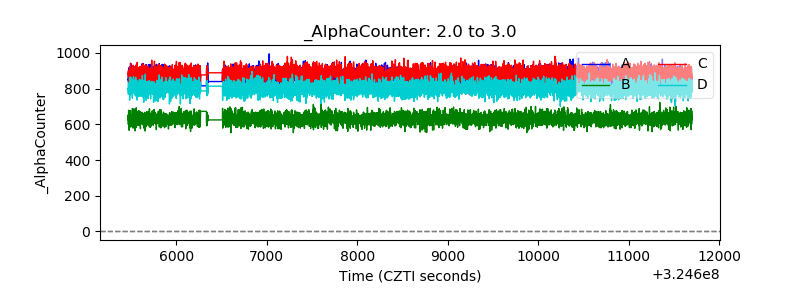 |
| _CPM_Rate | 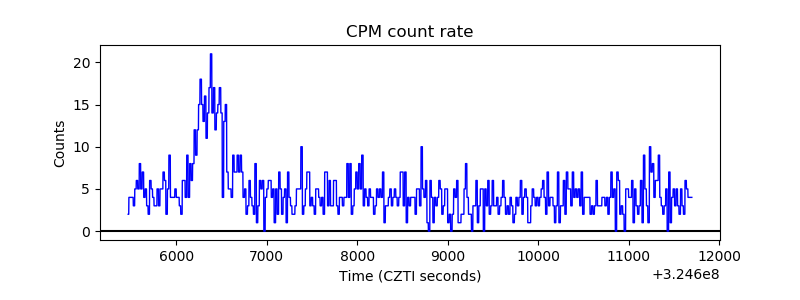 |
| CZT Counter | 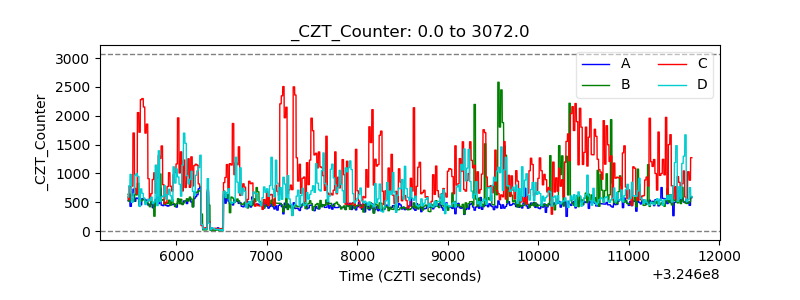 |
| +2.5 Volts monitor |  |
| +5 Volts monitor | 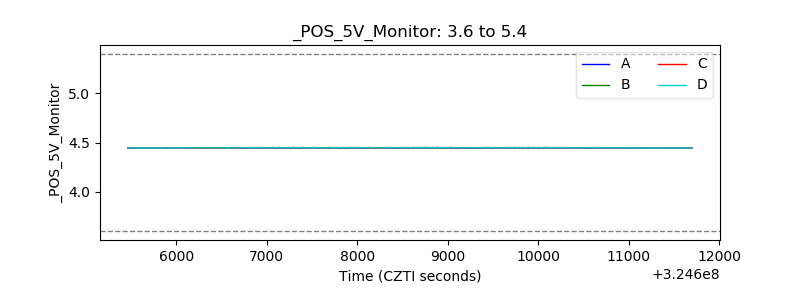 |
| _ROLL_ROT | 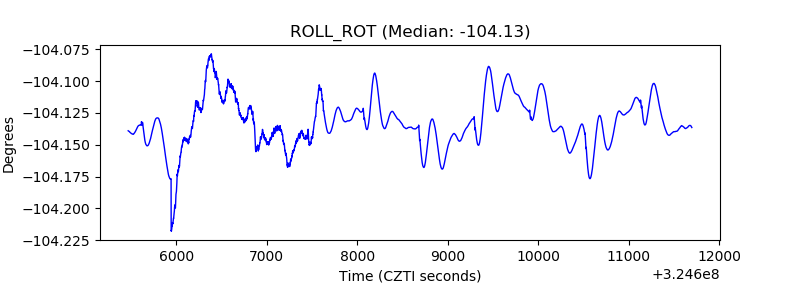 |
| _Roll_DEC | 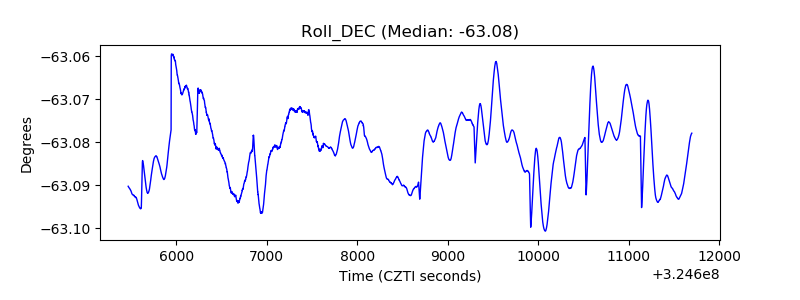 |
| _Roll_RA | 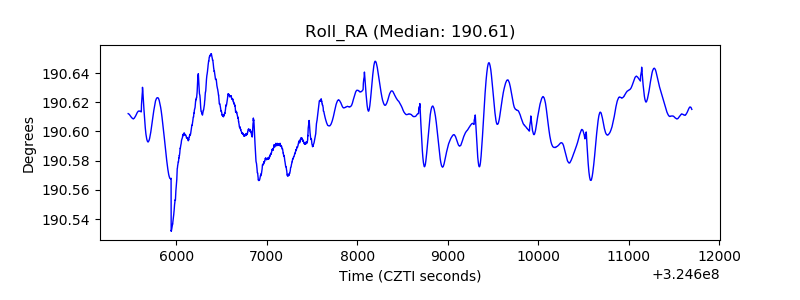 |
| Veto Counter | 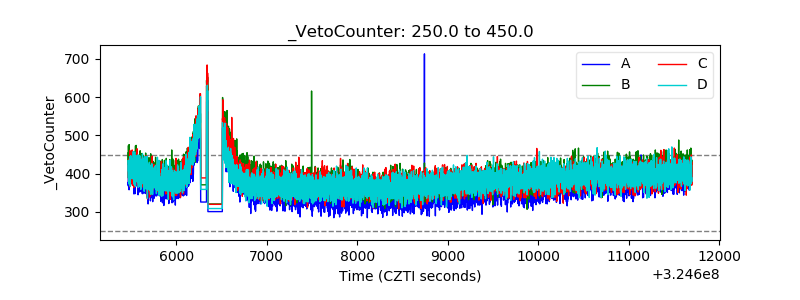 |