| Param | Original file | Final file |
|---|---|---|
| Filename | modeM0/AS1T03_188T01_9000003612cztM0_level2.fits | modeM0/AS1T03_188T01_9000003612cztM0_level2_quad_clean.evt |
| Size (bytes) | 419,555,520 | 322,830,720 |
| Size | 400.1 MB | 307.9 MB |
| Events in quadrant A | 2,702,434 | 1,865,904 |
| Events in quadrant B | 2,536,284 | 1,841,511 |
| Events in quadrant C | 2,436,840 | 1,673,218 |
| Events in quadrant D | 2,212,744 | 1,578,419 |
| Mode M0 | |||
|---|---|---|---|
| Quadrant | BADHDUFLAG | Total packets | Discarded packets |
| A | 0 | 86720 | 0 |
| B | 0 | 97327 | 0 |
| C | 0 | 122571 | 0 |
| D | 0 | 127438 | 0 |
| Mode M9 | |||
|---|---|---|---|
| Quadrant | BADHDUFLAG | Total packets | Discarded packets |
| A | 0 | 74 | 0 |
| B | 0 | 74 | 0 |
| C | 0 | 74 | 0 |
| D | 0 | 74 | 0 |
| Mode SS | |||
|---|---|---|---|
| Quadrant | BADHDUFLAG | Total packets | Discarded packets |
| A | 0 | 836 | 0 |
| B | 0 | 836 | 0 |
| C | 0 | 836 | 0 |
| D | 0 | 836 | 0 |
| Quadrant | Total seconds | Saturated seconds | Saturation percentage |
|---|---|---|---|
| A | 41012 | 412 | 1.004584% |
| B | 41012 | 1440 | 3.511167% |
| C | 41012 | 4488 | 10.943139% |
| D | 41012 | 1446 | 3.525797% |
Noise dominated data is calculated using 1-second bins in cleaned event files. If a bin has >2000 counts, and if more than 50% of those come from <1% of pixels, then it is considered to be noise-dominated and hence unusable.
| Quadrant | # 1 sec bins | Bins with >0 counts | Bins with >2000 counts | High rate bins dominated by noise | Noise dominated (total time) | Noise dominated (detector-on time) | Marked lightcurve |
|---|---|---|---|---|---|---|---|
| A | 48412 | 41010 | 0 | 0 | 0.00% | 0.00% | 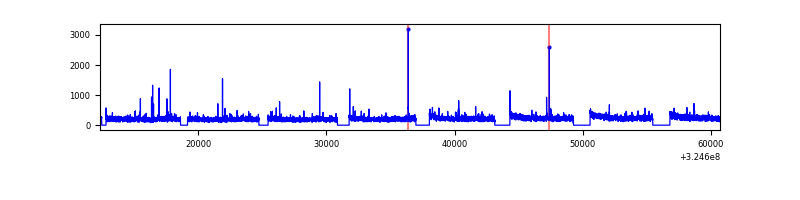 |
| B | 48412 | 40996 | 0 | 0 | 0.00% | 0.00% | 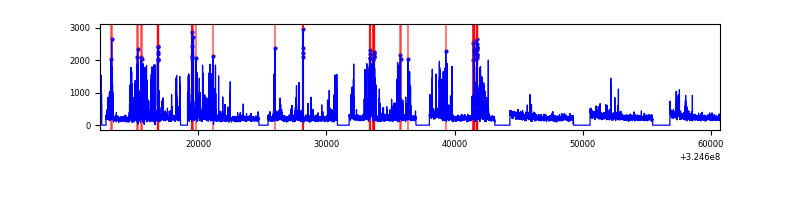 |
| C | 48412 | 41011 | 0 | 0 | 0.00% | 0.00% | 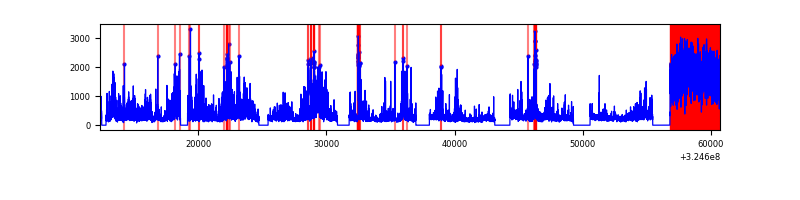 |
| D | 48412 | 41010 | 0 | 0 | 0.00% | 0.00% | 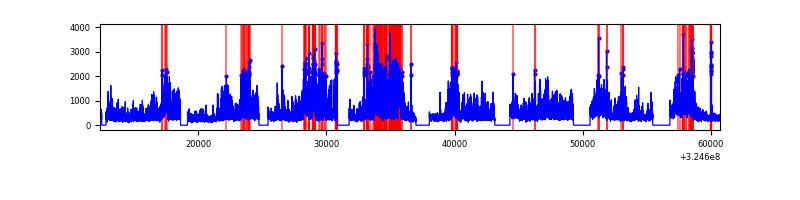 |
Top three noisy pixels from each quadrant. If the there are fewer than three noisy pixels in the level2.evt file, extra rows are filled as -1
| Pixel properties | Quadrant properties | ||||||
|---|---|---|---|---|---|---|---|
| Quadrant | DetID | PixID | Counts | Sigma | Mean | Median | Sigma |
| A | 0 | 29 | 2606 | 11.26 | 704 | 665 | 172.3 |
| A | 7 | 110 | 2071 | 8.16 | 704 | 665 | 172.3 |
| A | 9 | 19 | 1990 | 7.69 | 704 | 665 | 172.3 |
| B | 2 | 9 | 1994 | 10.24 | 672 | 646 | 131.7 |
| B | 5 | 255 | 1658 | 7.68 | 672 | 646 | 131.7 |
| B | 2 | 8 | 1649 | 7.62 | 672 | 646 | 131.7 |
| C | 1 | 81 | 1862 | 7.7 | 643 | 605 | 163.1 |
| C | 1 | 80 | 1856 | 7.67 | 643 | 605 | 163.1 |
| C | 12 | 241 | 1724 | 6.86 | 643 | 605 | 163.1 |
| D | 15 | 46 | 1601 | 6.17 | 631 | 576 | 166.0 |
| D | 10 | 189 | 1570 | 5.99 | 631 | 576 | 166.0 |
| D | 6 | 231 | 1545 | 5.84 | 631 | 576 | 166.0 |
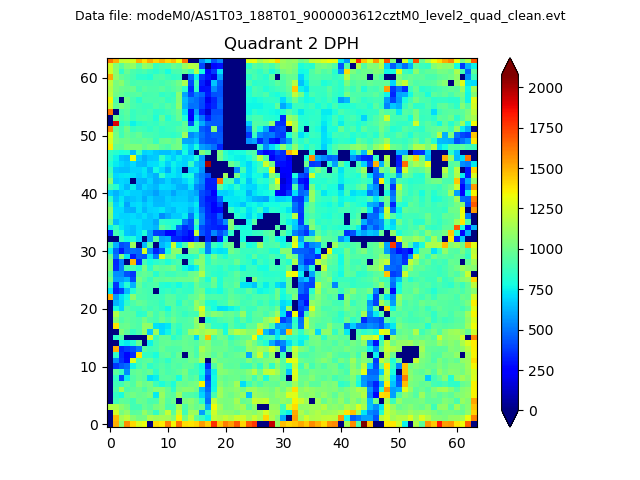
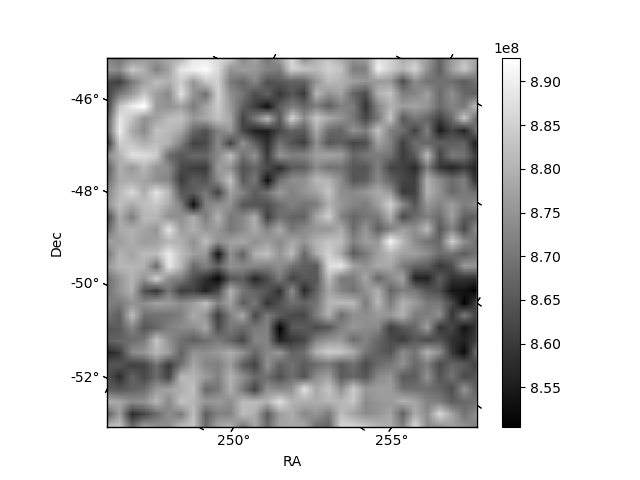
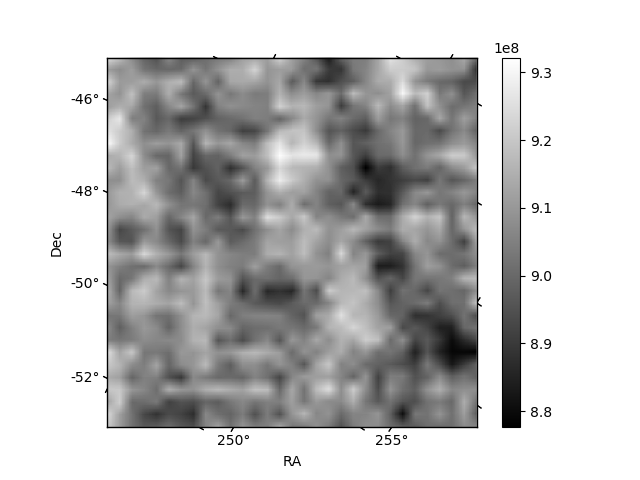
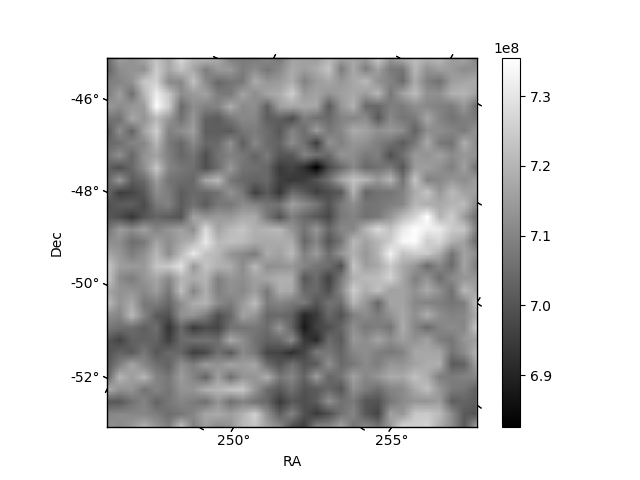
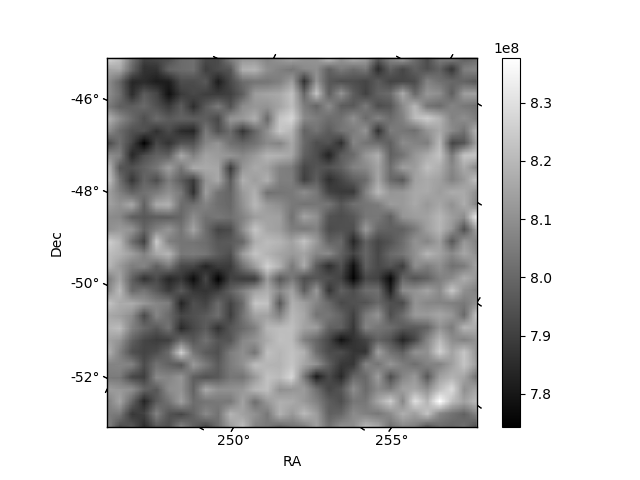
Histogram calculated using DETX and DETY for each event in the final _common_clean file
| Quadrant A | 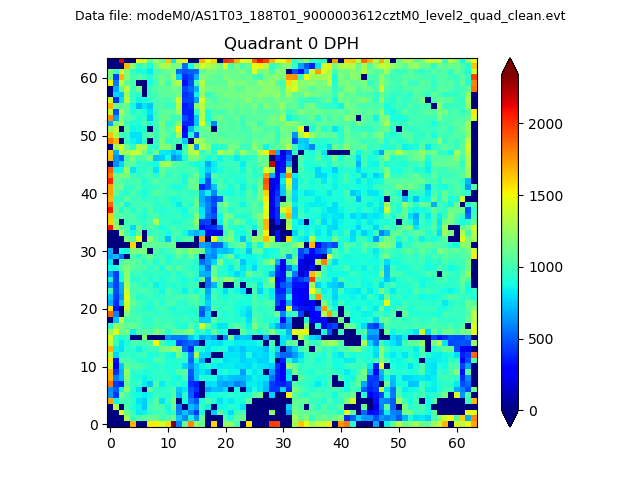 |
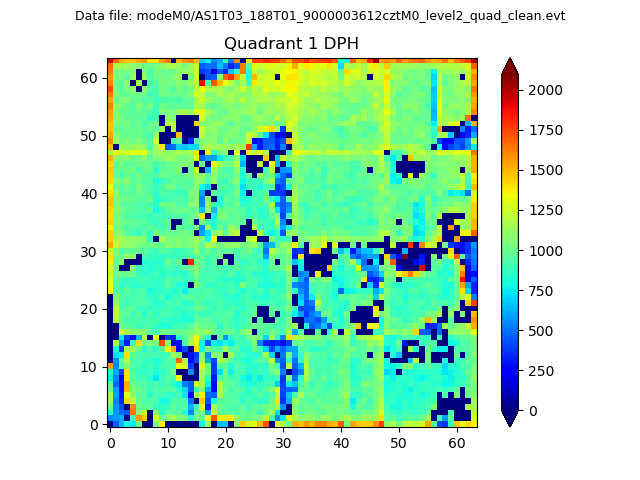 |
Quadrant B |
|---|---|---|---|
| Quadrant D | 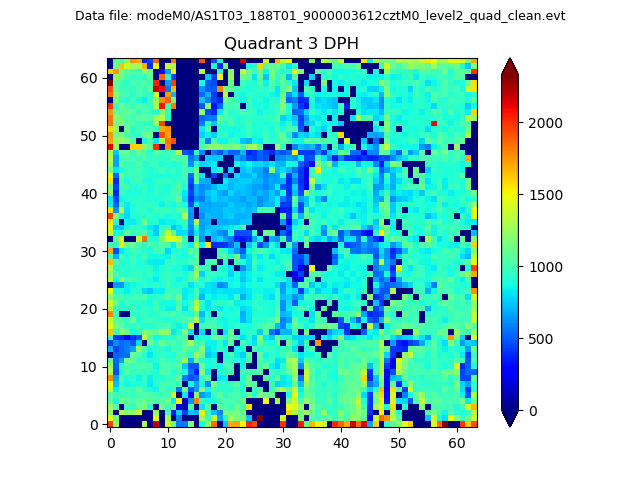 |
 |
Quadrant C |
| Plot type | Count rate plots | Images |
|---|---|---|
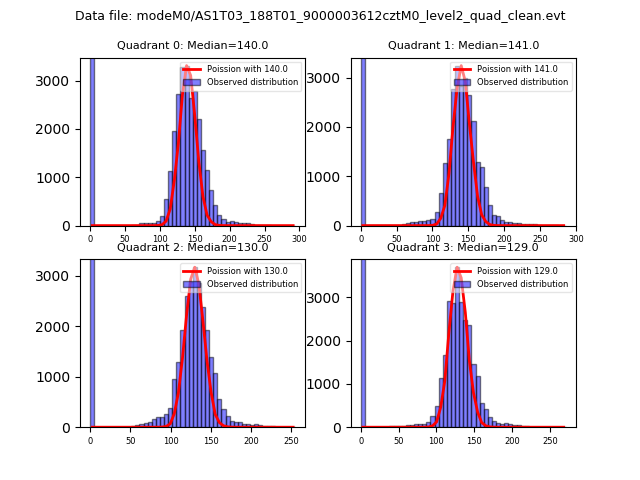
| Comparison with Poisson distribution Blue bars denote a histogram of data divided into 1 sec bins. Red curve is a Poisson curve with rate = median count rate of data. |
 |
 |
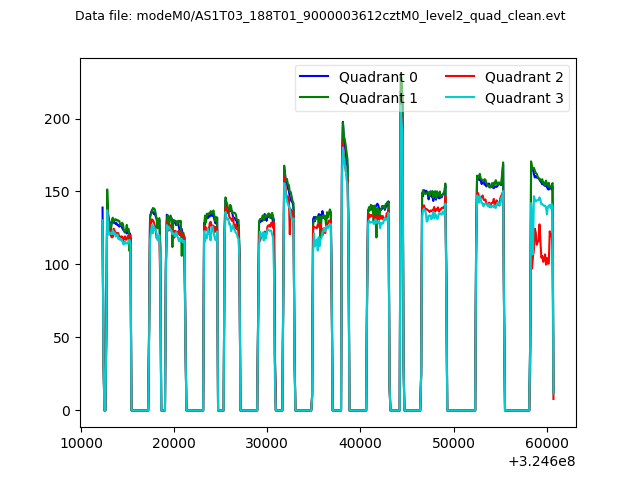
| Quadrant-wise count rates Data is divided into 100 sec bins |
 |
|
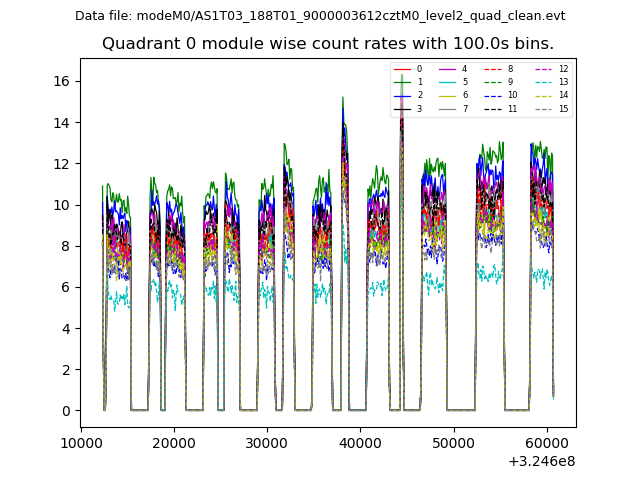
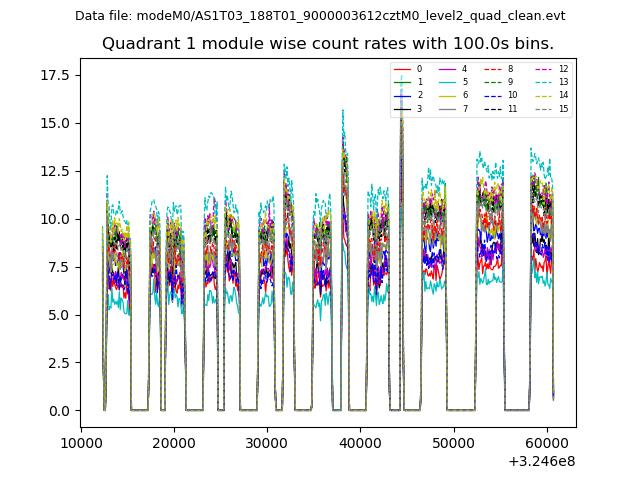
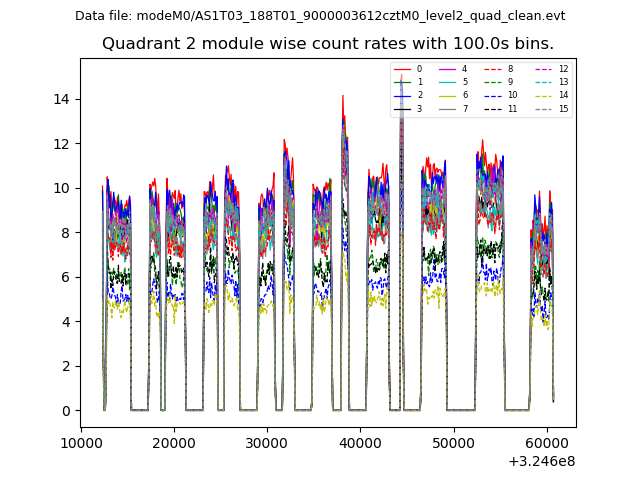
| Module-wise count rates for Quadrant A Data is divided into 100 sec bins |
 |
 |
| Module-wise count rates for Quadrant B Data is divided into 100 sec bins |
 |
 |
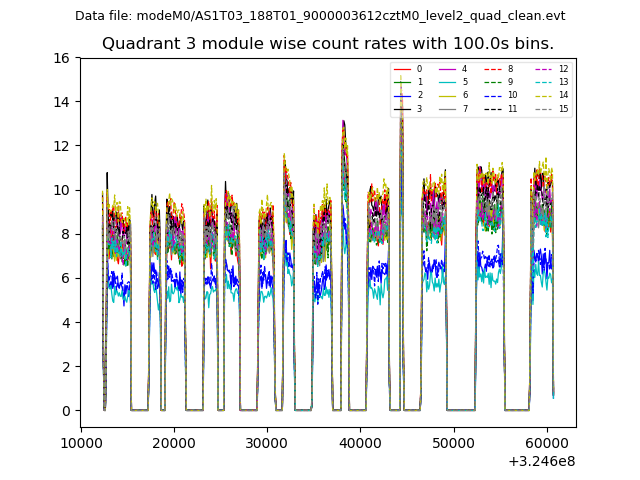
| Module-wise count rates for Quadrant C Data is divided into 100 sec bins |
 |
 |
| Module-wise count rates for Quadrant D Data is divided into 100 sec bins |
 |
 |
| Parameter | Plot |
|---|---|
| CZT HV Monitor | 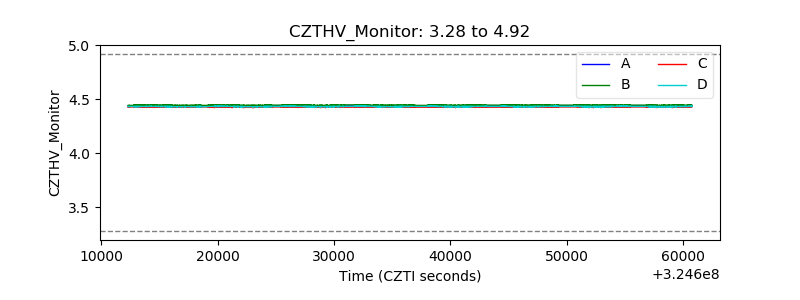 |
| D_VDD | 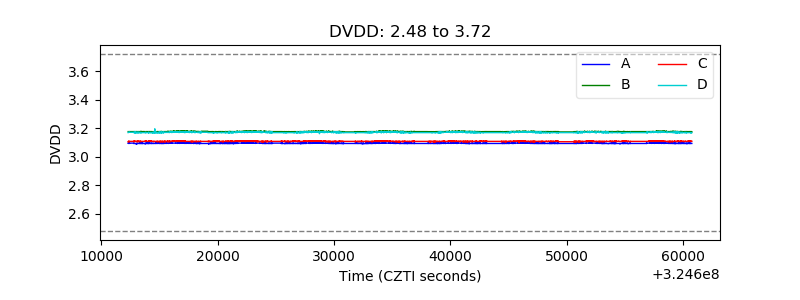 |
| Temperature 1 | 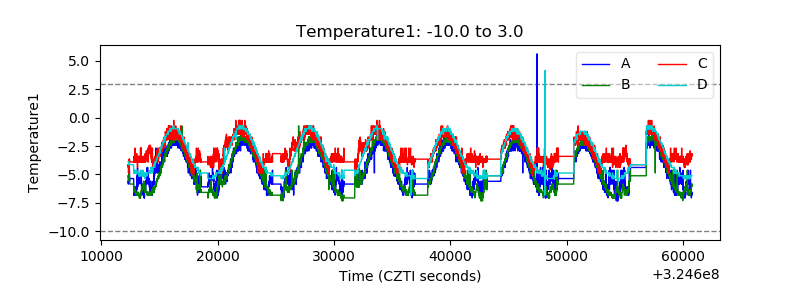 |
| Veto HV Monitor | 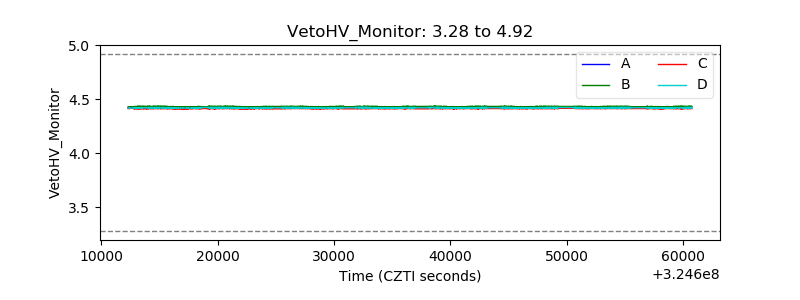 |
| Veto LLD | 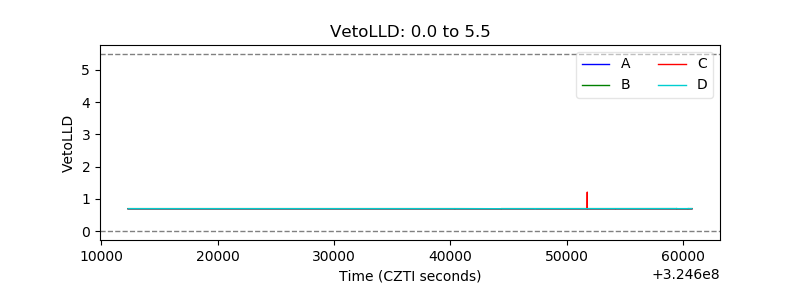 |
| Alpha Counter | 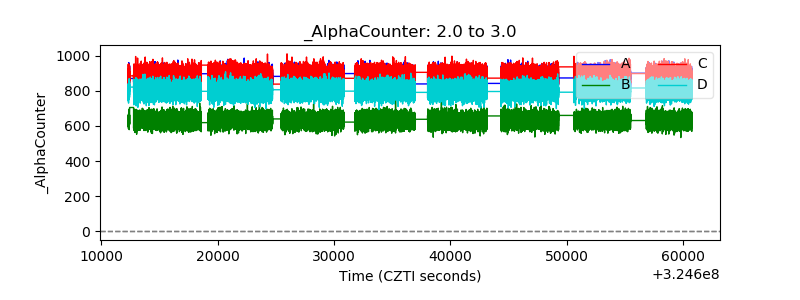 |
| _CPM_Rate | 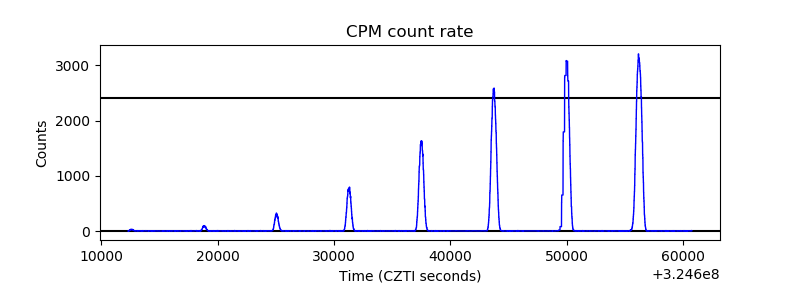 |
| CZT Counter | 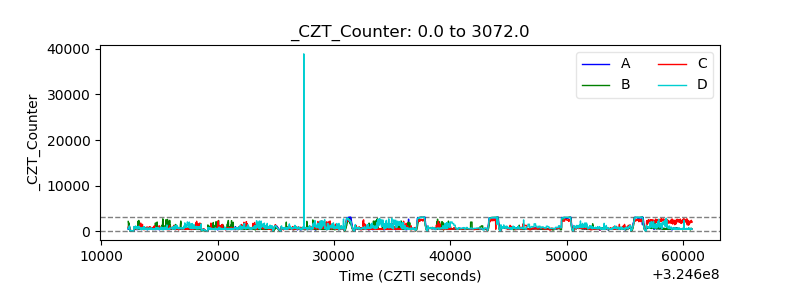 |
| +2.5 Volts monitor |  |
| +5 Volts monitor |  |
| _ROLL_ROT | 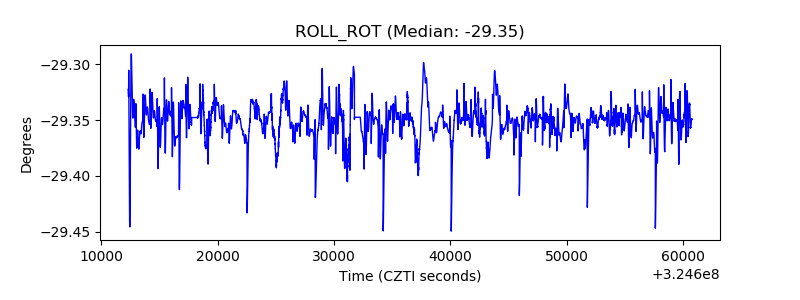 |
| _Roll_DEC | 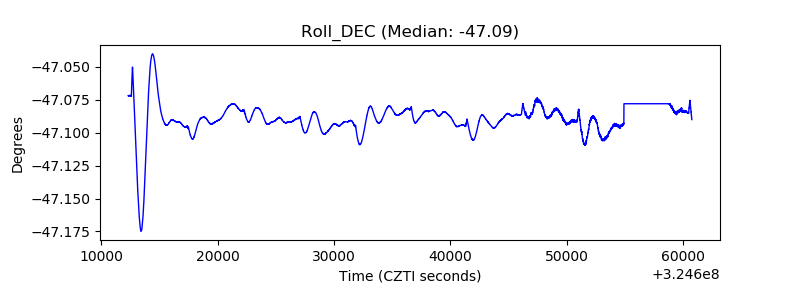 |
| _Roll_RA | 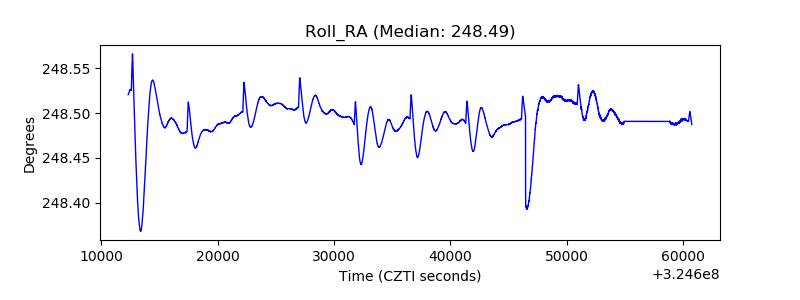 |
| Veto Counter | 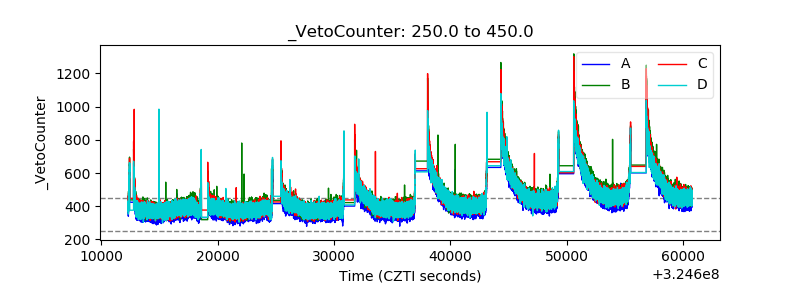 |