| Param | Original file | Final file |
|---|---|---|
| Filename | modeM0/AS1T03_188T01_9000003612_24587cztM0_level2.evt | modeM0/AS1T03_188T01_9000003612_24587cztM0_level2_quad_clean.evt |
| Size (bytes) | 607,429,440 | 102,695,040 |
| Size | 579.3 MB | 97.9 MB |
| Events in quadrant A | 3,355,929 | 673,246 |
| Events in quadrant B | 4,792,064 | 674,215 |
| Events in quadrant C | 4,870,599 | 635,935 |
| Events in quadrant D | 4,893,910 | 629,438 |
| Mode M0 | |||
|---|---|---|---|
| Quadrant | BADHDUFLAG | Total packets | Discarded packets |
| A | 0 | 14615 | 2 |
| B | 0 | 18812 | 2 |
| C | 0 | 19079 | 2 |
| D | 0 | 19380 | 2 |
| Mode M9 | |||
|---|---|---|---|
| Quadrant | BADHDUFLAG | Total packets | Discarded packets |
| A | 0 | 9 | 0 |
| B | 0 | 9 | 0 |
| C | 0 | 9 | 0 |
| D | 0 | 9 | 0 |
| Mode SS | |||
|---|---|---|---|
| Quadrant | BADHDUFLAG | Total packets | Discarded packets |
| A | 0 | 146 | 0 |
| B | 0 | 146 | 0 |
| C | 0 | 146 | 0 |
| D | 0 | 146 | 0 |
| Quadrant | Total seconds | Saturated seconds | Saturation percentage |
|---|---|---|---|
| A | 7142 | 71 | 0.994119% |
| B | 7142 | 505 | 7.070849% |
| C | 7142 | 303 | 4.242509% |
| D | 7142 | 129 | 1.806217% |
Noise dominated data is calculated using 1-second bins in cleaned event files. If a bin has >2000 counts, and if more than 50% of those come from <1% of pixels, then it is considered to be noise-dominated and hence unusable.
| Quadrant | # 1 sec bins | Bins with >0 counts | Bins with >2000 counts | High rate bins dominated by noise | Noise dominated (total time) | Noise dominated (detector-on time) | Marked lightcurve |
|---|---|---|---|---|---|---|---|
| A | 8032 | 7144 | 1 | 1 | 0.01% | 0.01% | 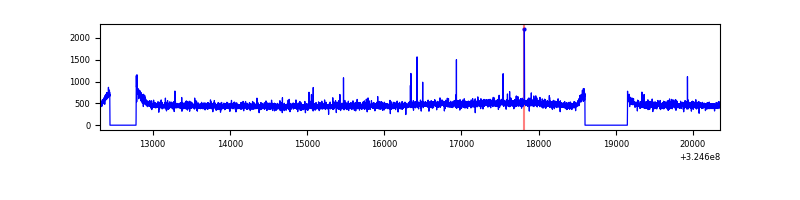 |
| B | 8032 | 7144 | 242 | 242 | 3.01% | 3.39% | 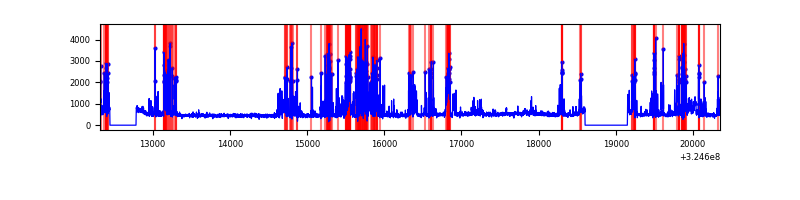 |
| C | 8032 | 7144 | 42 | 42 | 0.52% | 0.59% | 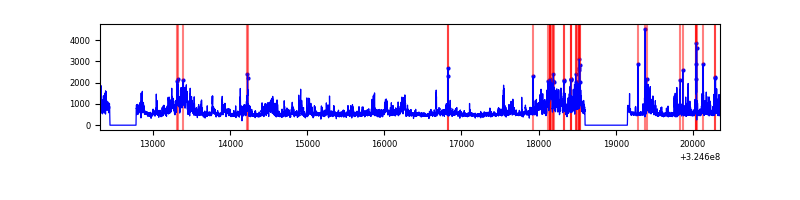 |
| D | 8032 | 7144 | 36 | 36 | 0.45% | 0.50% | 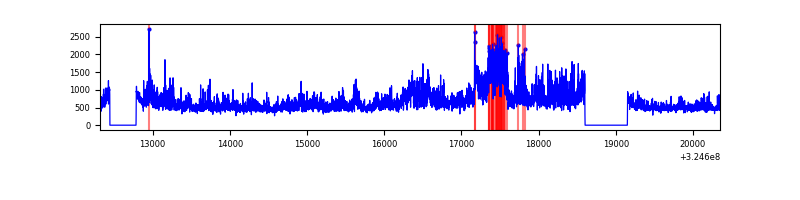 |
Top three noisy pixels from each quadrant. If the there are fewer than three noisy pixels in the level2.evt file, extra rows are filled as -1
| Pixel properties | Quadrant properties | ||||||
|---|---|---|---|---|---|---|---|
| Quadrant | DetID | PixID | Counts | Sigma | Mean | Median | Sigma |
| A | 6 | 16 | 22785 | 125.47 | 863 | 842 | 174.9 |
| A | 13 | 254 | 11079 | 58.53 | 863 | 842 | 174.9 |
| A | 3 | 137 | 7948 | 40.63 | 863 | 842 | 174.9 |
| B | 3 | 64 | 1460379 | 8932.58 | 845 | 822 | 163.4 |
| B | 12 | 111 | 19911 | 116.83 | 845 | 822 | 163.4 |
| B | 11 | 111 | 18153 | 106.07 | 845 | 822 | 163.4 |
| C | 7 | 247 | 1100505 | 5659.93 | 830 | 836 | 194.3 |
| C | 2 | 16 | 375241 | 1927.04 | 830 | 836 | 194.3 |
| C | 14 | 238 | 132078 | 675.49 | 830 | 836 | 194.3 |
| D | 8 | 195 | 1643573 | 7982.28 | 843 | 819 | 205.8 |
| D | 1 | 52 | 58012 | 277.91 | 843 | 819 | 205.8 |
| D | 2 | 234 | 30437 | 143.92 | 843 | 819 | 205.8 |
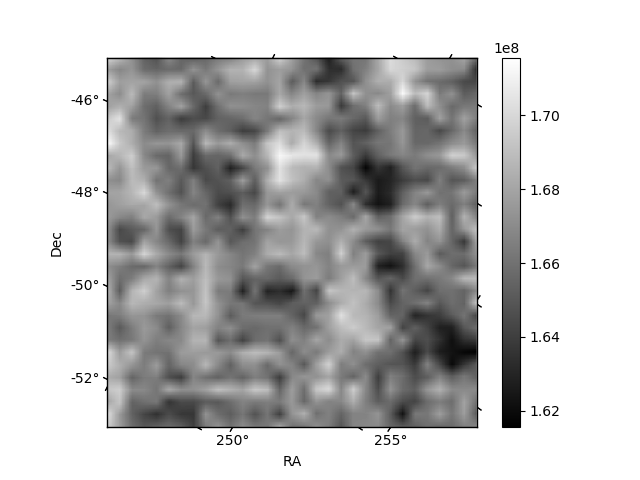
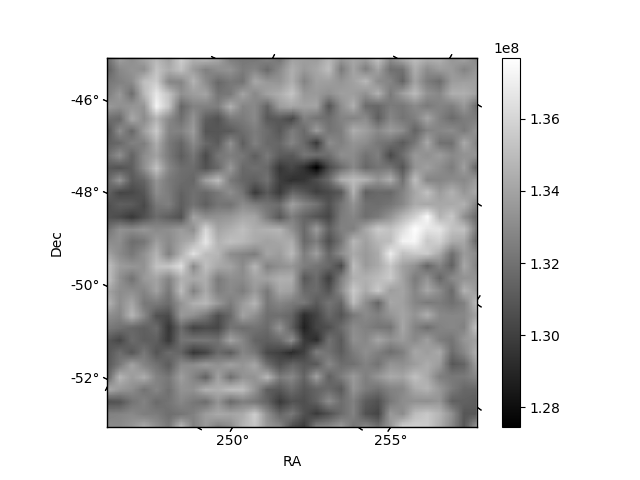
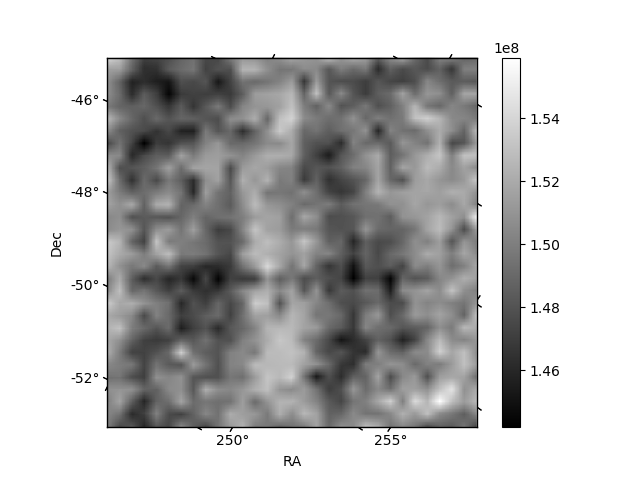
Histogram calculated using DETX and DETY for each event in the final _common_clean file
| Quadrant A | 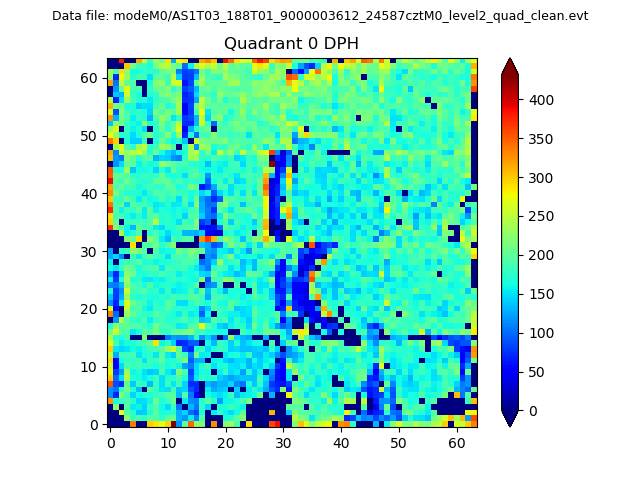 |
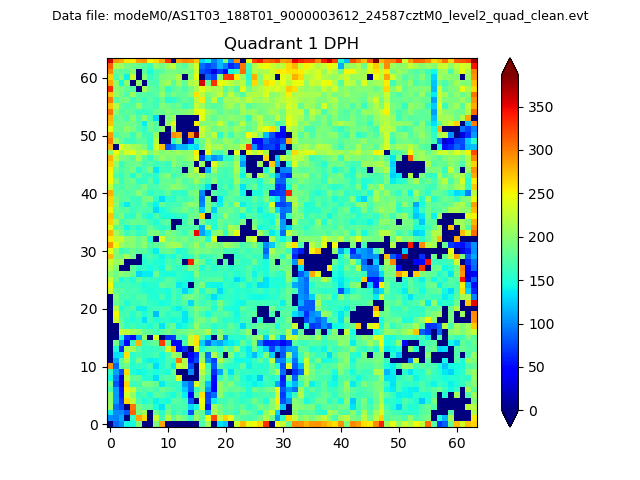 |
Quadrant B |
|---|---|---|---|
| Quadrant D |  |
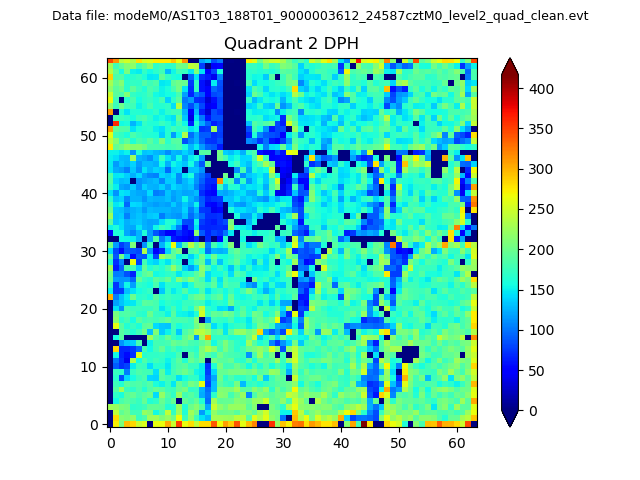 |
Quadrant C |
| Plot type | Count rate plots | Images |
|---|---|---|
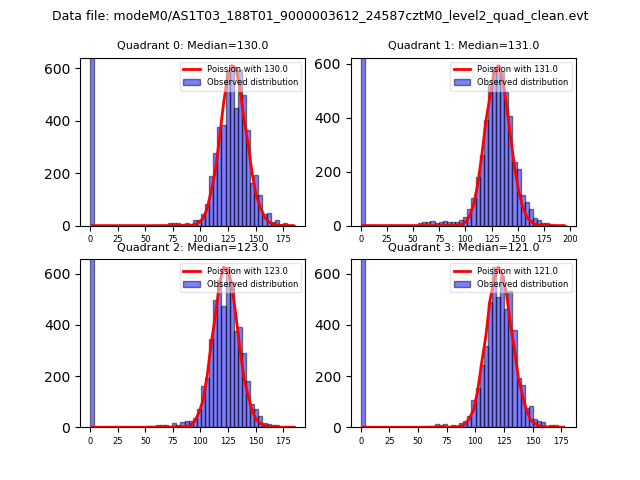
| Comparison with Poisson distribution Blue bars denote a histogram of data divided into 1 sec bins. Red curve is a Poisson curve with rate = median count rate of data. |
 |
 |
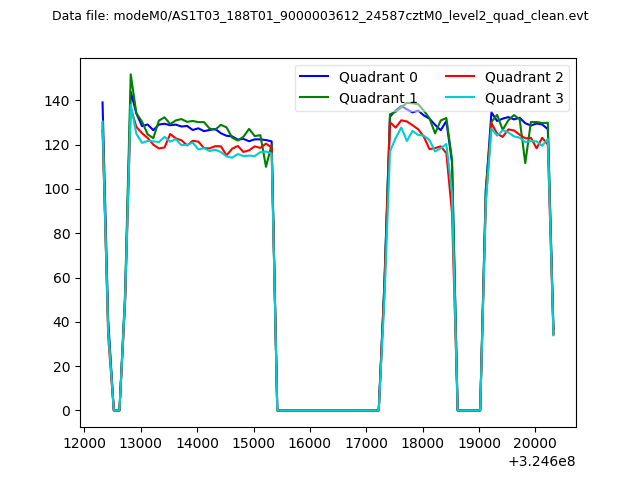
| Quadrant-wise count rates Data is divided into 100 sec bins |
 |
|
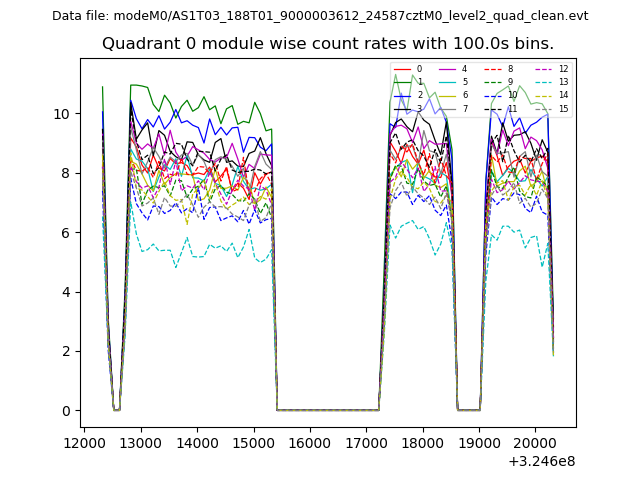
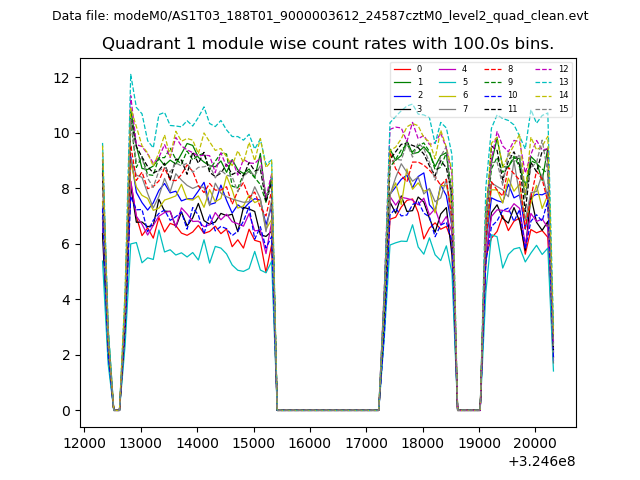
| Module-wise count rates for Quadrant A Data is divided into 100 sec bins |
 |
 |
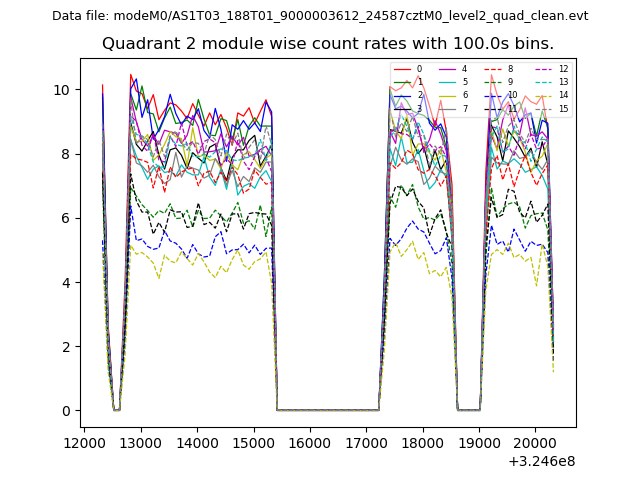
| Module-wise count rates for Quadrant B Data is divided into 100 sec bins |
 |
 |
| Module-wise count rates for Quadrant C Data is divided into 100 sec bins |
 |
 |
| Module-wise count rates for Quadrant D Data is divided into 100 sec bins |
 |
 |
| Parameter | Plot |
|---|---|
| CZT HV Monitor | 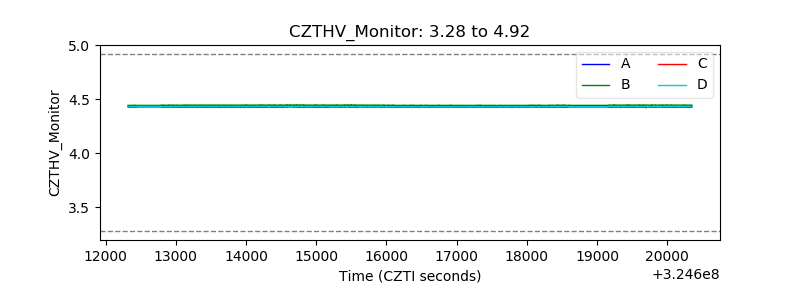 |
| D_VDD | 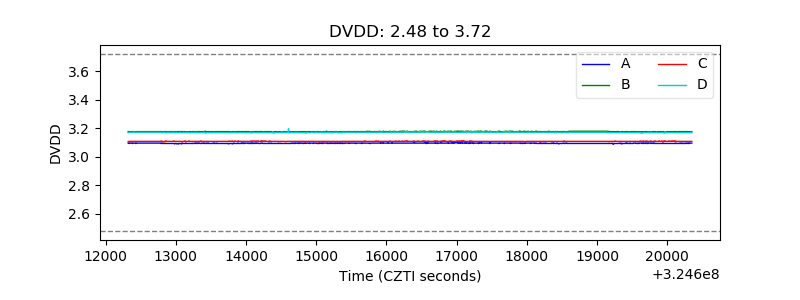 |
| Temperature 1 | 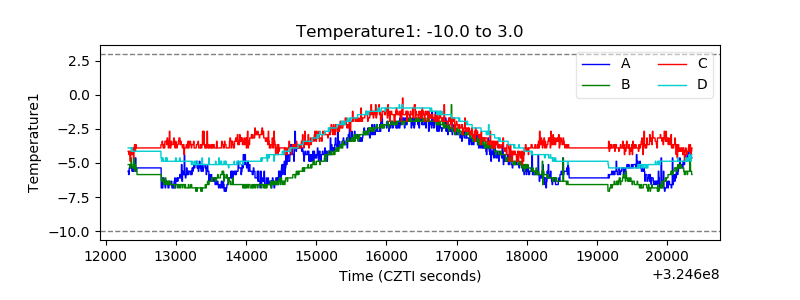 |
| Veto HV Monitor | 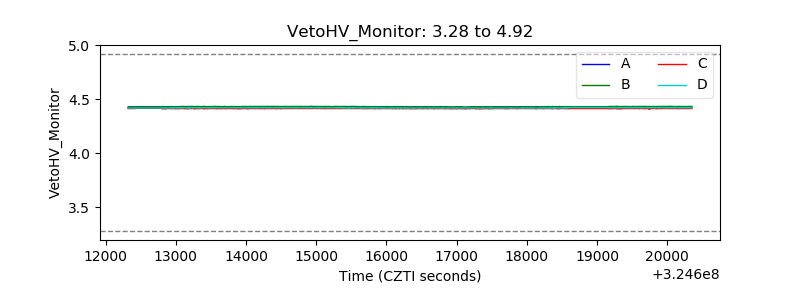 |
| Veto LLD |  |
| Alpha Counter |  |
| _CPM_Rate | 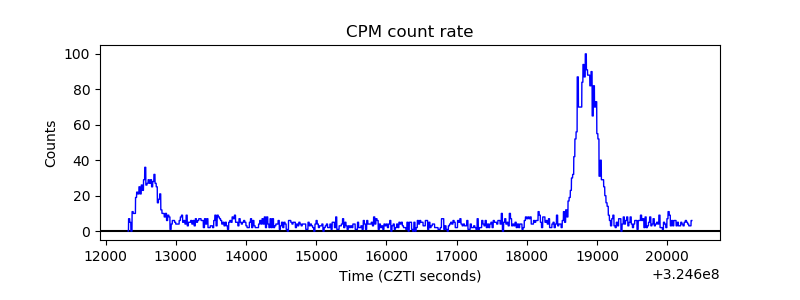 |
| CZT Counter | 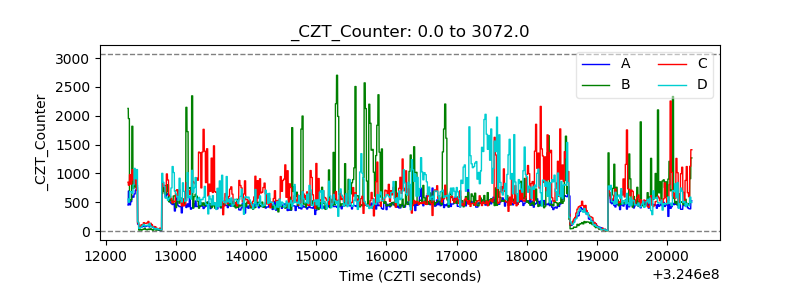 |
| +2.5 Volts monitor |  |
| +5 Volts monitor | 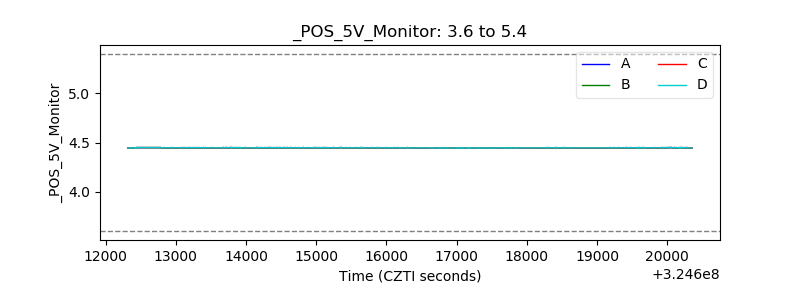 |
| _ROLL_ROT |  |
| _Roll_DEC |  |
| _Roll_RA | 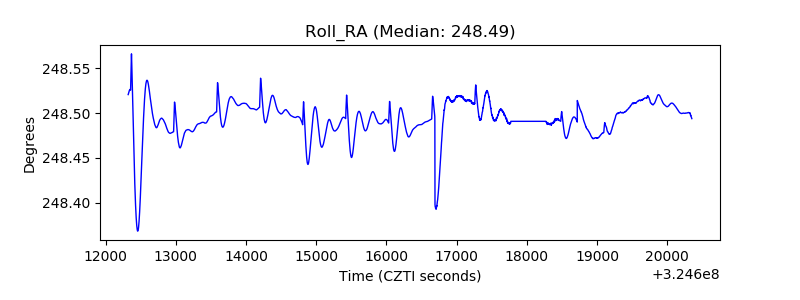 |
| Veto Counter | 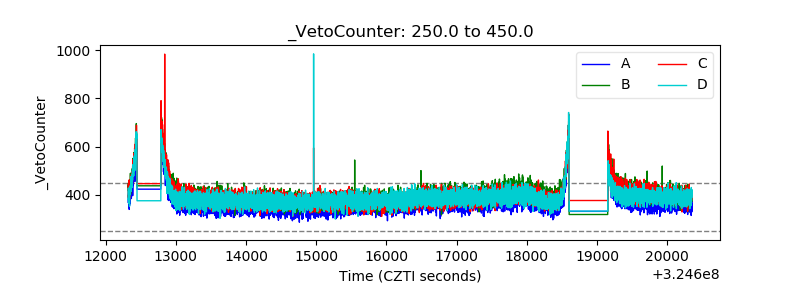 |