| Param | Original file | Final file |
|---|---|---|
| Filename | modeM0/AS1T03_188T01_9000003612_24590cztM0_level2.evt | modeM0/AS1T03_188T01_9000003612_24590cztM0_level2_quad_clean.evt |
| Size (bytes) | 555,082,560 | 83,888,640 |
| Size | 529.4 MB | 80.0 MB |
| Events in quadrant A | 3,517,043 | 536,289 |
| Events in quadrant B | 4,184,029 | 538,104 |
| Events in quadrant C | 3,784,993 | 507,218 |
| Events in quadrant D | 4,877,605 | 498,438 |
| Mode M0 | |||
|---|---|---|---|
| Quadrant | BADHDUFLAG | Total packets | Discarded packets |
| A | 0 | 14720 | 2 |
| B | 0 | 16798 | 2 |
| C | 0 | 15626 | 2 |
| D | 0 | 19061 | 2 |
| Mode M9 | |||
|---|---|---|---|
| Quadrant | BADHDUFLAG | Total packets | Discarded packets |
| A | 0 | 13 | 0 |
| B | 0 | 14 | 0 |
| C | 0 | 14 | 0 |
| D | 0 | 14 | 0 |
| Mode SS | |||
|---|---|---|---|
| Quadrant | BADHDUFLAG | Total packets | Discarded packets |
| A | 0 | 134 | 0 |
| B | 0 | 134 | 0 |
| C | 0 | 134 | 0 |
| D | 0 | 134 | 0 |
| Quadrant | Total seconds | Saturated seconds | Saturation percentage |
|---|---|---|---|
| A | 6601 | 84 | 1.272534% |
| B | 6600 | 269 | 4.075758% |
| C | 6600 | 167 | 2.530303% |
| D | 6600 | 155 | 2.348485% |
Noise dominated data is calculated using 1-second bins in cleaned event files. If a bin has >2000 counts, and if more than 50% of those come from <1% of pixels, then it is considered to be noise-dominated and hence unusable.
| Quadrant | # 1 sec bins | Bins with >0 counts | Bins with >2000 counts | High rate bins dominated by noise | Noise dominated (total time) | Noise dominated (detector-on time) | Marked lightcurve |
|---|---|---|---|---|---|---|---|
| A | 7781 | 6601 | 0 | 0 | 0.00% | 0.00% | 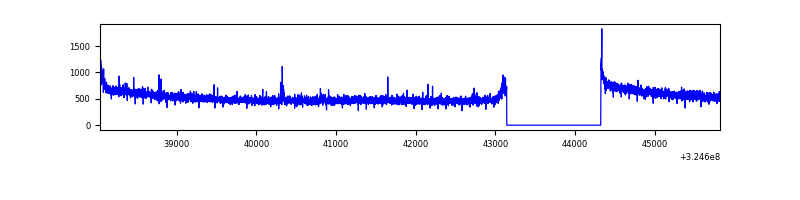 |
| B | 7780 | 6600 | 106 | 106 | 1.36% | 1.61% | 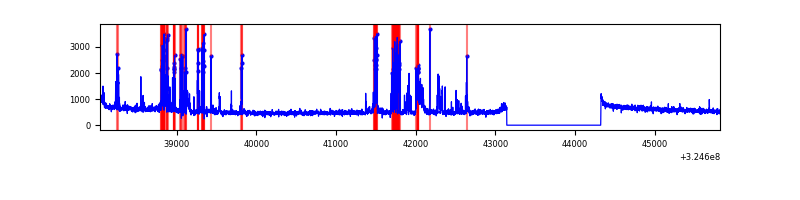 |
| C | 7780 | 6600 | 18 | 18 | 0.23% | 0.27% | 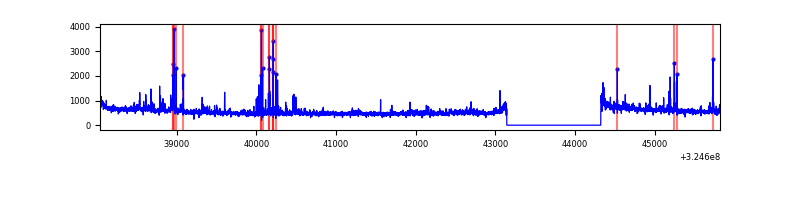 |
| D | 7780 | 6600 | 70 | 70 | 0.90% | 1.06% | 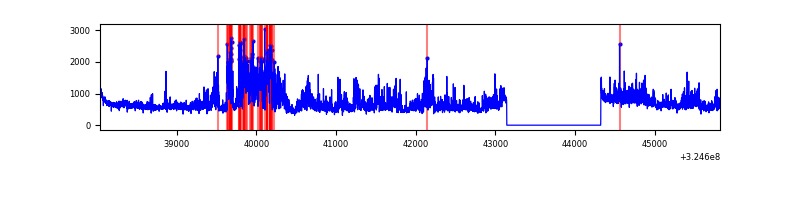 |
Top three noisy pixels from each quadrant. If the there are fewer than three noisy pixels in the level2.evt file, extra rows are filled as -1
| Pixel properties | Quadrant properties | ||||||
|---|---|---|---|---|---|---|---|
| Quadrant | DetID | PixID | Counts | Sigma | Mean | Median | Sigma |
| A | 6 | 16 | 11709 | 60.83 | 907 | 891 | 177.8 |
| A | 13 | 254 | 11230 | 58.14 | 907 | 891 | 177.8 |
| A | 10 | 255 | 10835 | 55.92 | 907 | 891 | 177.8 |
| B | 3 | 64 | 687782 | 4144.13 | 885 | 865 | 165.8 |
| B | 12 | 111 | 19259 | 110.97 | 885 | 865 | 165.8 |
| B | 7 | 202 | 17391 | 99.7 | 885 | 865 | 165.8 |
| C | 2 | 16 | 159011 | 807.69 | 853 | 860 | 195.8 |
| C | 7 | 247 | 151391 | 768.78 | 853 | 860 | 195.8 |
| C | 14 | 238 | 139116 | 706.09 | 853 | 860 | 195.8 |
| D | 8 | 195 | 1143336 | 5488.94 | 871 | 845 | 208.1 |
| D | 5 | 222 | 266527 | 1276.43 | 871 | 845 | 208.1 |
| D | 1 | 52 | 113413 | 540.82 | 871 | 845 | 208.1 |
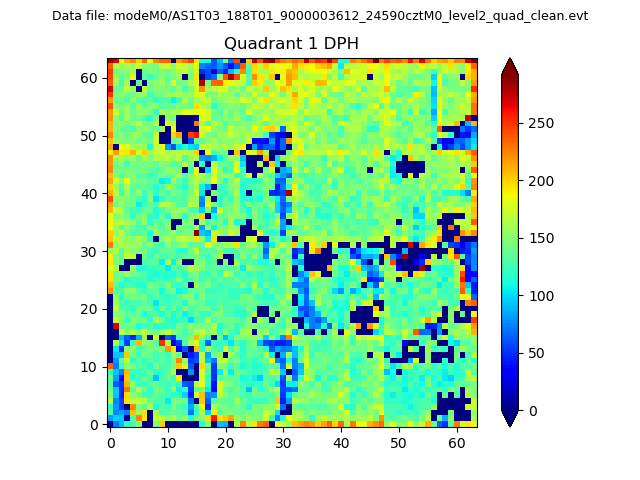
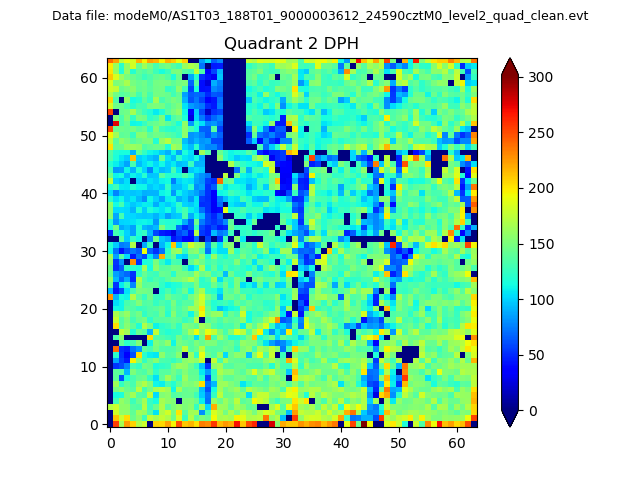
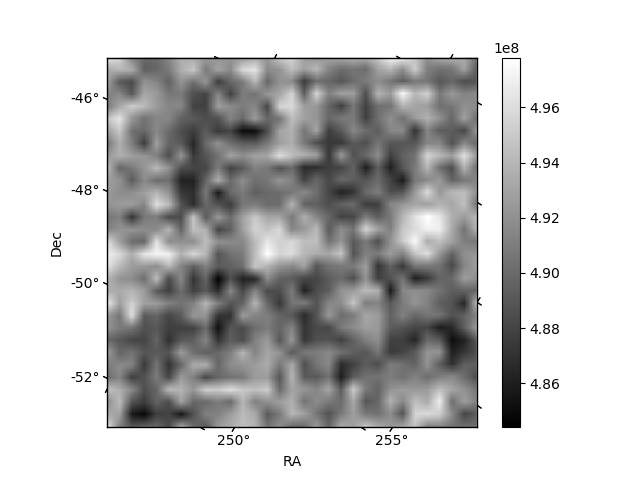
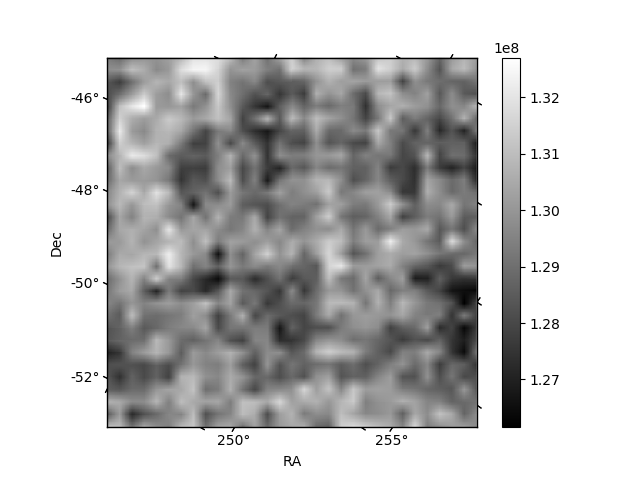
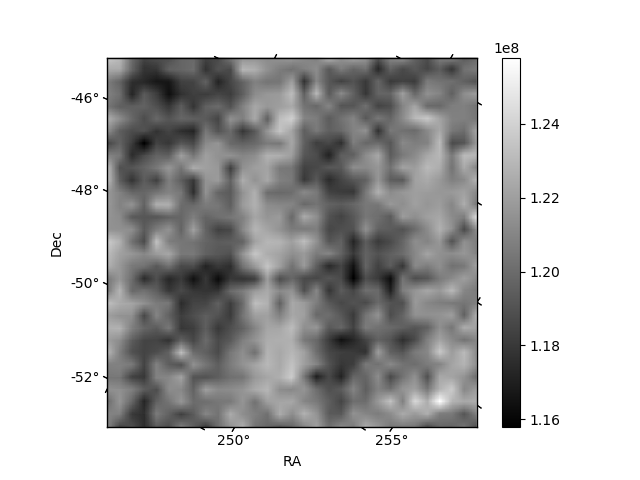
Histogram calculated using DETX and DETY for each event in the final _common_clean file
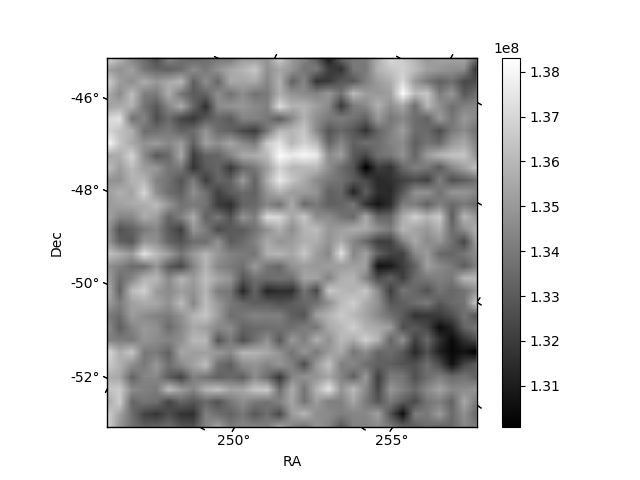
| Quadrant A |  |
 |
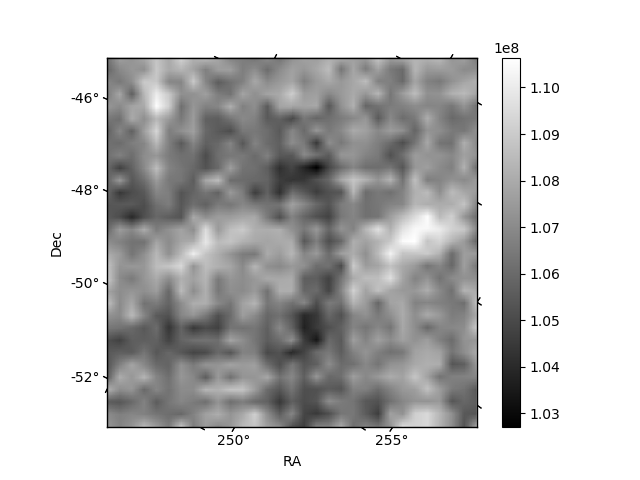
Quadrant B |
|---|---|---|---|
| Quadrant D | 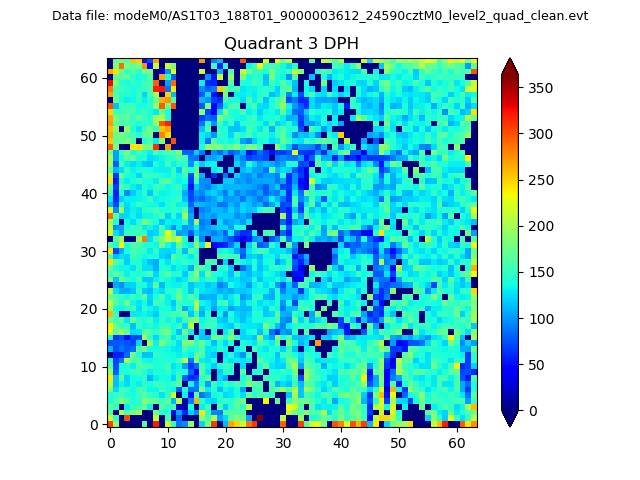 |
 |
Quadrant C |
| Plot type | Count rate plots | Images |
|---|---|---|
| Comparison with Poisson distribution Blue bars denote a histogram of data divided into 1 sec bins. Red curve is a Poisson curve with rate = median count rate of data. |
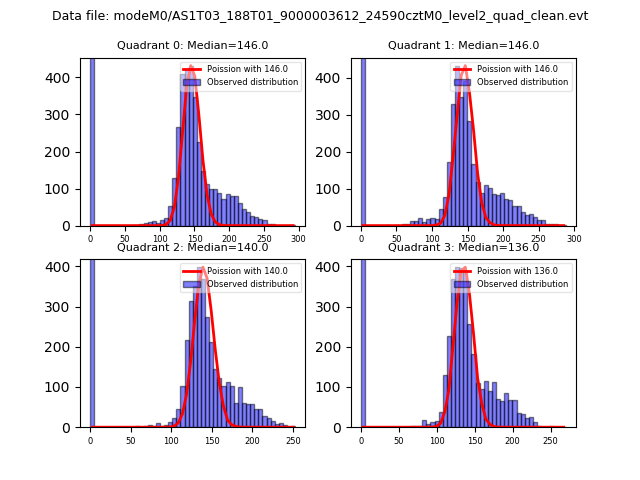 |
 |
| Quadrant-wise count rates Data is divided into 100 sec bins |
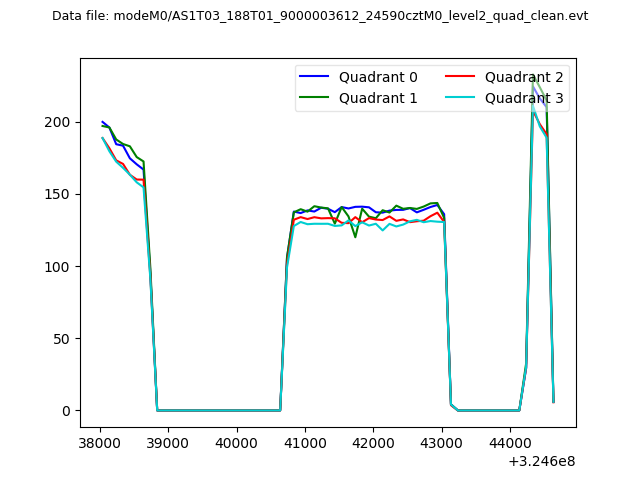 |
|
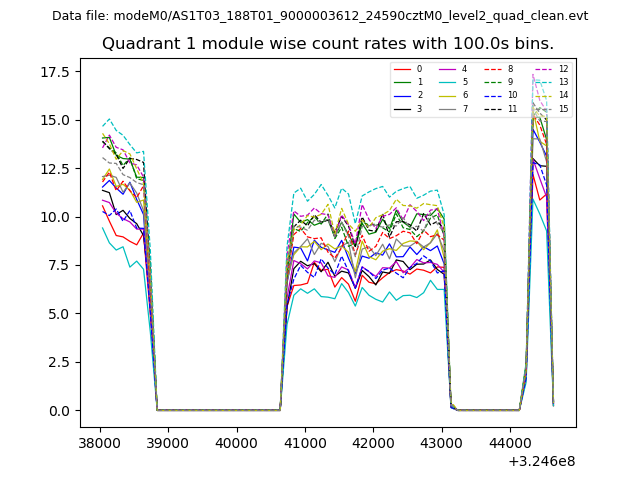
| Module-wise count rates for Quadrant A Data is divided into 100 sec bins |
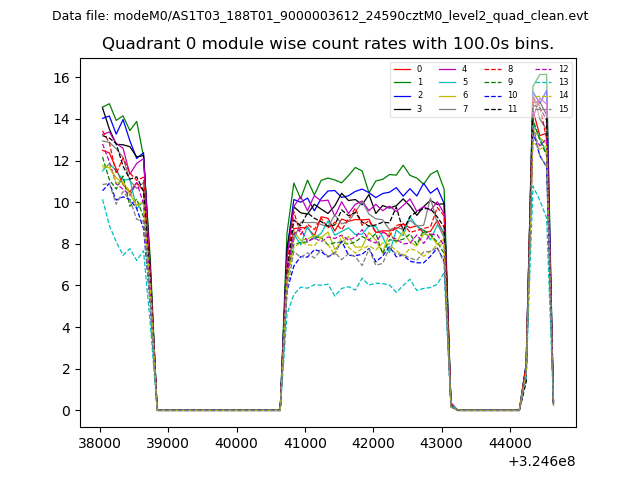 |
 |
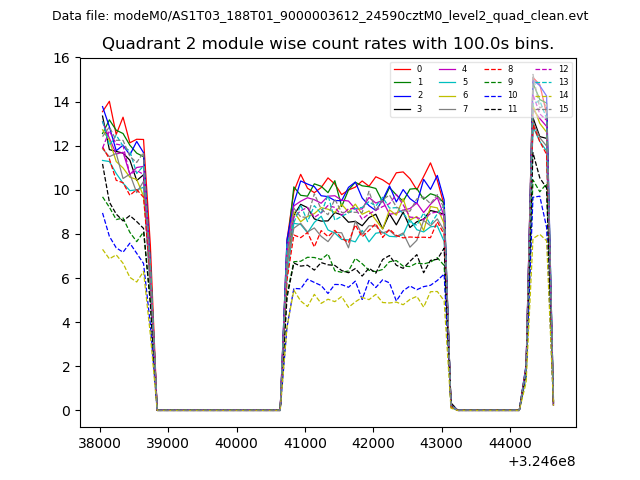
| Module-wise count rates for Quadrant B Data is divided into 100 sec bins |
 |
 |
| Module-wise count rates for Quadrant C Data is divided into 100 sec bins |
 |
 |
| Module-wise count rates for Quadrant D Data is divided into 100 sec bins |
 |
 |
| Parameter | Plot |
|---|---|
| CZT HV Monitor |  |
| D_VDD | 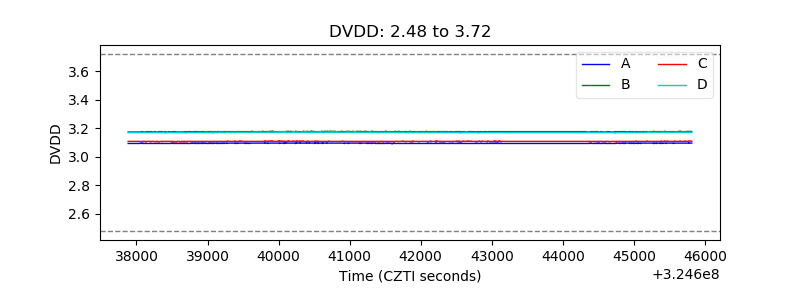 |
| Temperature 1 |  |
| Veto HV Monitor | 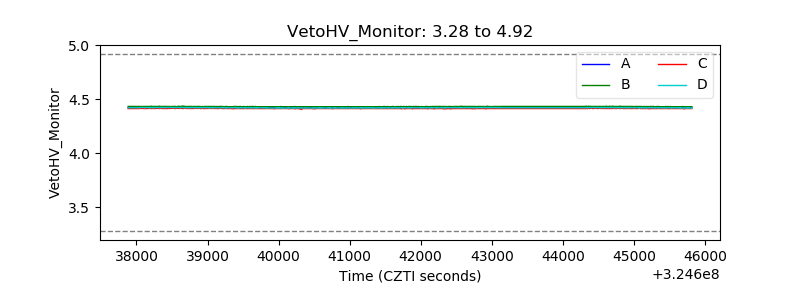 |
| Veto LLD |  |
| Alpha Counter | 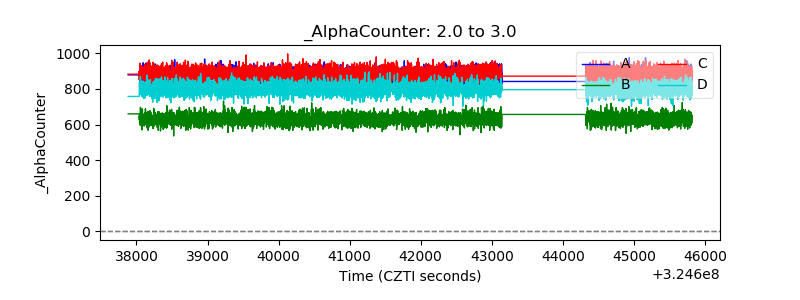 |
| _CPM_Rate | 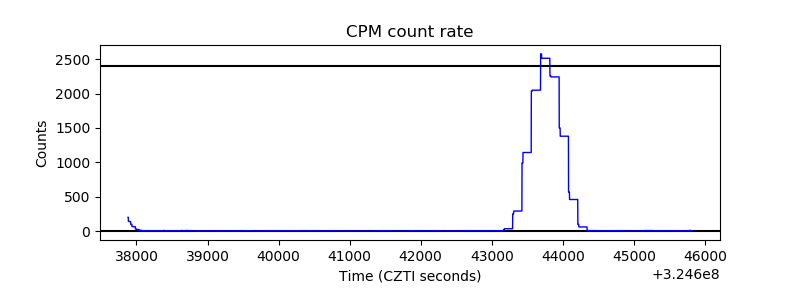 |
| CZT Counter | 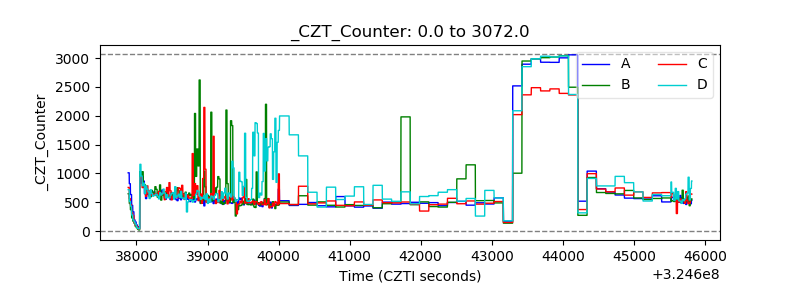 |
| +2.5 Volts monitor |  |
| +5 Volts monitor | 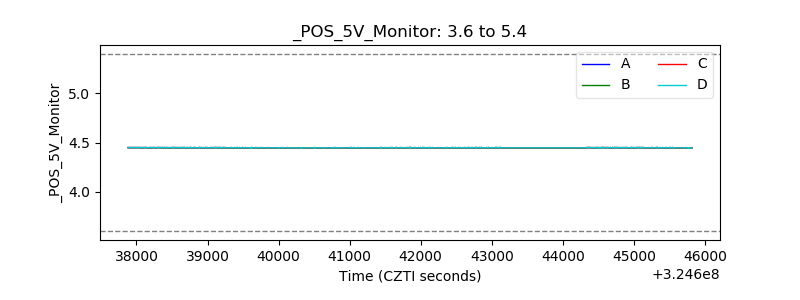 |
| _ROLL_ROT |  |
| _Roll_DEC | 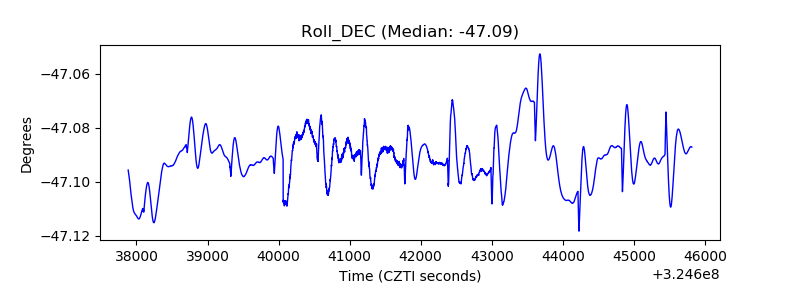 |
| _Roll_RA | 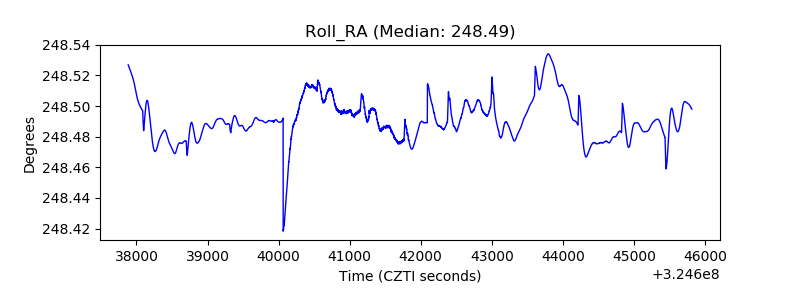 |
| Veto Counter | 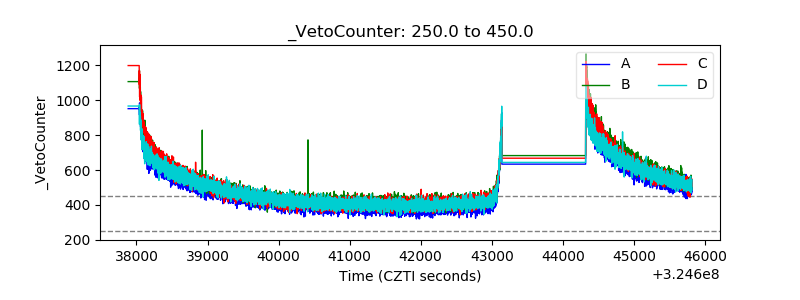 |