| Param | Original file | Final file |
|---|---|---|
| Filename | modeM0/AS1T03_188T01_9000003612_24592cztM0_level2.evt | modeM0/AS1T03_188T01_9000003612_24592cztM0_level2_quad_clean.evt |
| Size (bytes) | 624,211,200 | 74,105,280 |
| Size | 595.3 MB | 70.7 MB |
| Events in quadrant A | 3,489,967 | 470,341 |
| Events in quadrant B | 3,601,081 | 475,816 |
| Events in quadrant C | 6,021,525 | 435,532 |
| Events in quadrant D | 5,373,670 | 430,815 |
| Mode M0 | |||
|---|---|---|---|
| Quadrant | BADHDUFLAG | Total packets | Discarded packets |
| A | 0 | 14375 | 1 |
| B | 0 | 14678 | 1 |
| C | 0 | 21993 | 7 |
| D | 0 | 20215 | 1 |
| Mode M9 | |||
|---|---|---|---|
| Quadrant | BADHDUFLAG | Total packets | Discarded packets |
| A | 0 | 14 | 0 |
| B | 0 | 14 | 0 |
| C | 0 | 14 | 0 |
| D | 0 | 14 | 0 |
| Mode SS | |||
|---|---|---|---|
| Quadrant | BADHDUFLAG | Total packets | Discarded packets |
| A | 0 | 124 | 0 |
| B | 0 | 124 | 0 |
| C | 0 | 124 | 0 |
| D | 0 | 124 | 0 |
| Quadrant | Total seconds | Saturated seconds | Saturation percentage |
|---|---|---|---|
| A | 6184 | 89 | 1.439198% |
| B | 6185 | 106 | 1.713824% |
| C | 6184 | 1553 | 25.113195% |
| D | 6184 | 205 | 3.315006% |
Noise dominated data is calculated using 1-second bins in cleaned event files. If a bin has >2000 counts, and if more than 50% of those come from <1% of pixels, then it is considered to be noise-dominated and hence unusable.
| Quadrant | # 1 sec bins | Bins with >0 counts | Bins with >2000 counts | High rate bins dominated by noise | Noise dominated (total time) | Noise dominated (detector-on time) | Marked lightcurve |
|---|---|---|---|---|---|---|---|
| A | 7529 | 6185 | 0 | 0 | 0.00% | 0.00% | 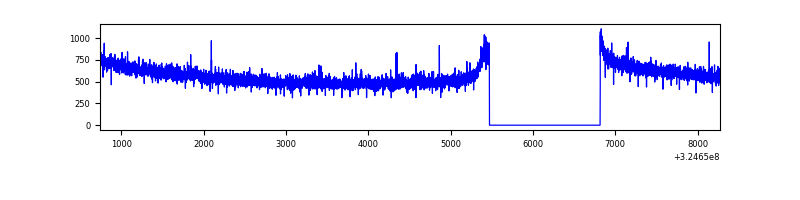 |
| B | 7530 | 6185 | 1 | 1 | 0.01% | 0.02% | 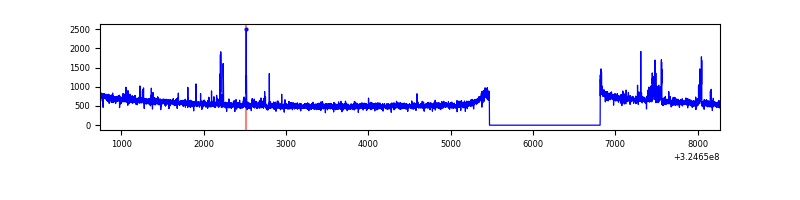 |
| C | 7529 | 6185 | 1132 | 1132 | 15.04% | 18.30% | 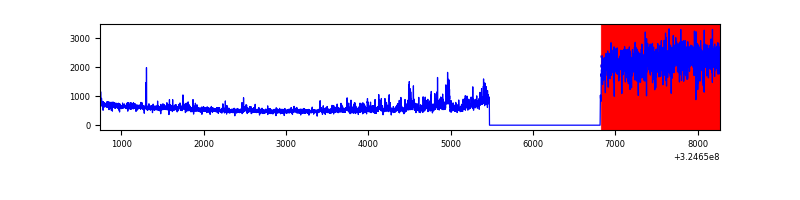 |
| D | 7529 | 6185 | 93 | 93 | 1.24% | 1.50% | 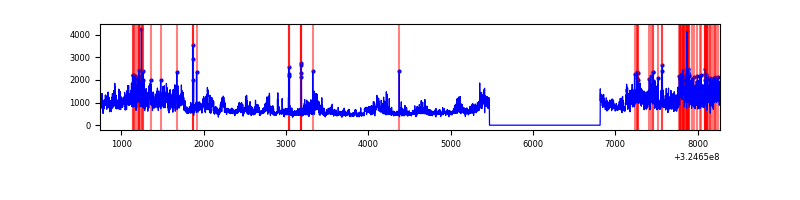 |
Top three noisy pixels from each quadrant. If the there are fewer than three noisy pixels in the level2.evt file, extra rows are filled as -1
| Pixel properties | Quadrant properties | ||||||
|---|---|---|---|---|---|---|---|
| Quadrant | DetID | PixID | Counts | Sigma | Mean | Median | Sigma |
| A | 13 | 254 | 10415 | 53.91 | 903 | 890 | 176.7 |
| A | 0 | 226 | 7905 | 39.7 | 903 | 890 | 176.7 |
| A | 10 | 255 | 7456 | 37.16 | 903 | 890 | 176.7 |
| B | 0 | 190 | 53797 | 326.6 | 893 | 878 | 162.0 |
| B | 3 | 64 | 49668 | 301.12 | 893 | 878 | 162.0 |
| B | 12 | 111 | 18206 | 106.94 | 893 | 878 | 162.0 |
| C | 7 | 247 | 2885311 | 16550.13 | 765 | 772 | 174.3 |
| C | 14 | 238 | 126402 | 720.81 | 765 | 772 | 174.3 |
| C | 2 | 16 | 9512 | 50.15 | 765 | 772 | 174.3 |
| D | 8 | 195 | 1629546 | 8175.21 | 850 | 828 | 199.2 |
| D | 1 | 52 | 509608 | 2553.78 | 850 | 828 | 199.2 |
| D | 2 | 234 | 27604 | 134.4 | 850 | 828 | 199.2 |
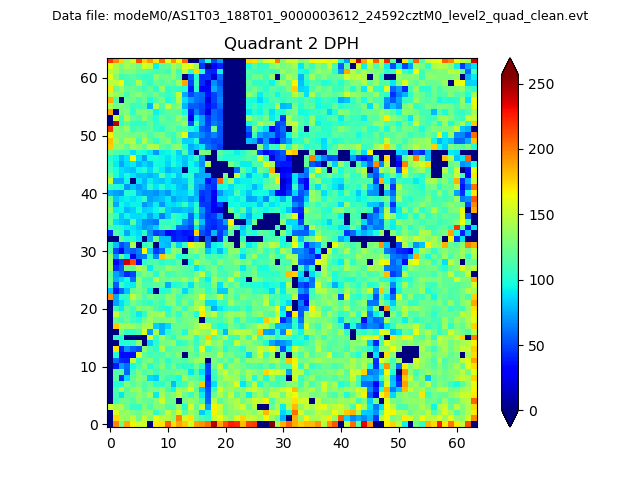
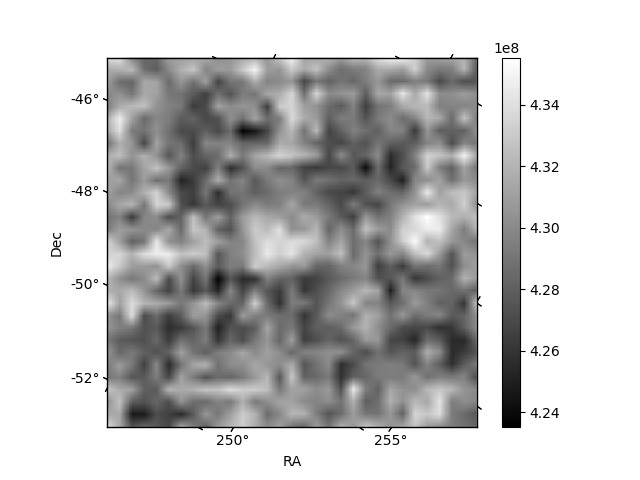
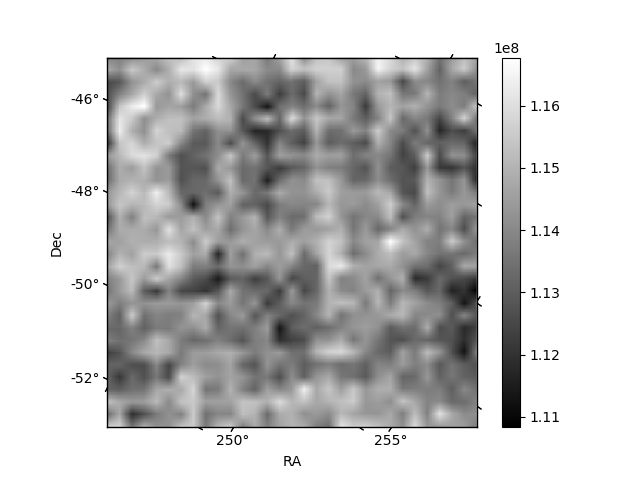
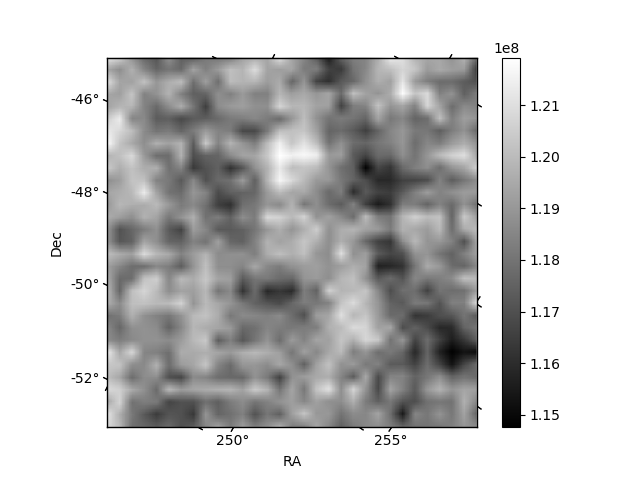
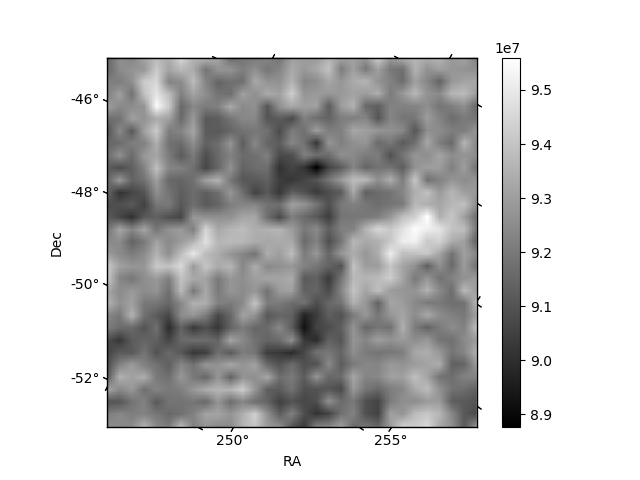
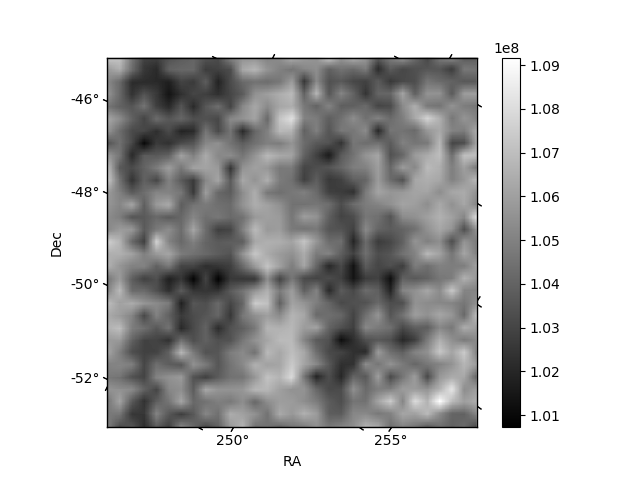
Histogram calculated using DETX and DETY for each event in the final _common_clean file
| Quadrant A | 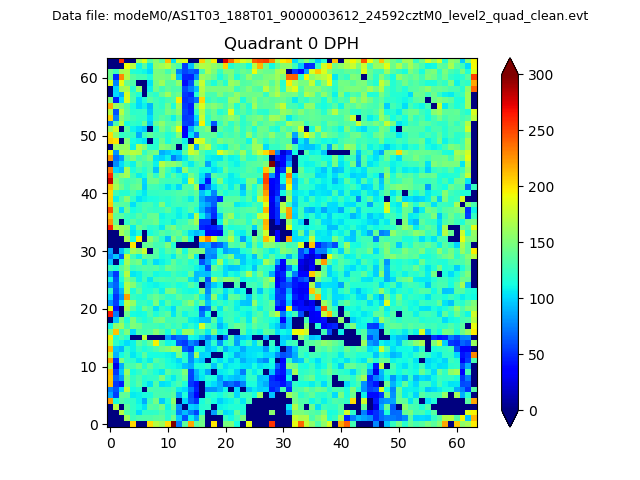 |
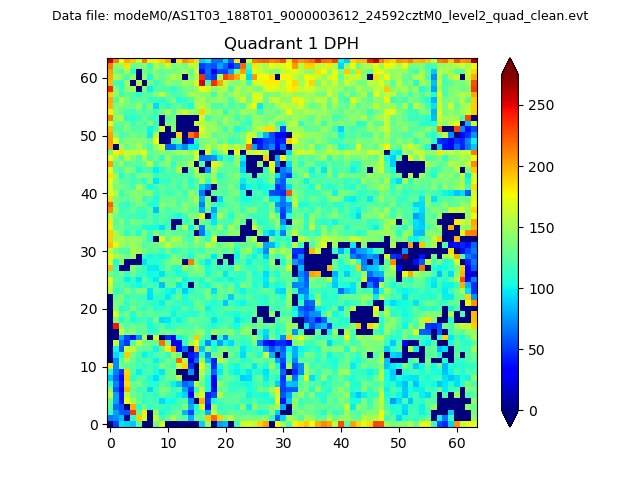 |
Quadrant B |
|---|---|---|---|
| Quadrant D | 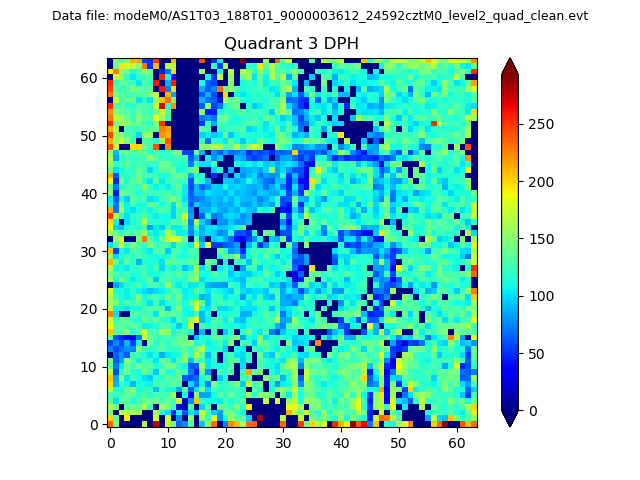 |
 |
Quadrant C |
| Plot type | Count rate plots | Images |
|---|---|---|
| Comparison with Poisson distribution Blue bars denote a histogram of data divided into 1 sec bins. Red curve is a Poisson curve with rate = median count rate of data. |
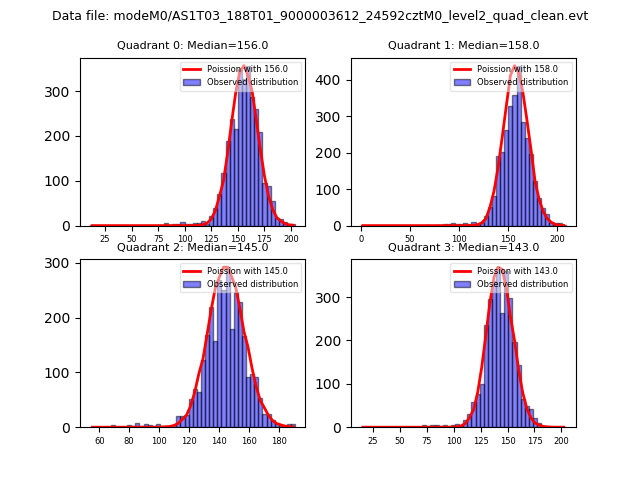 |
 |
| Quadrant-wise count rates Data is divided into 100 sec bins |
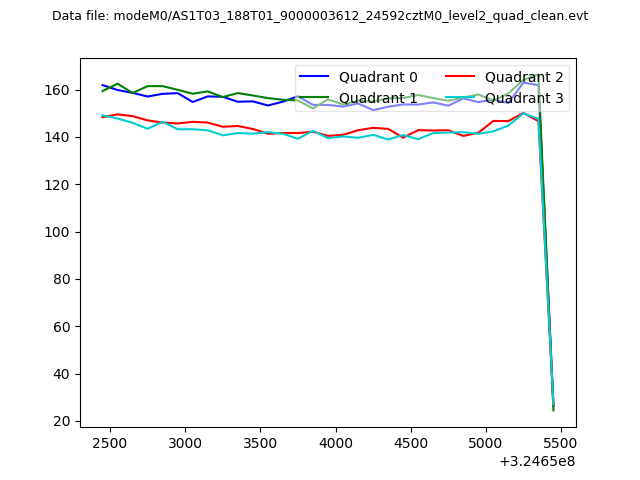 |
|
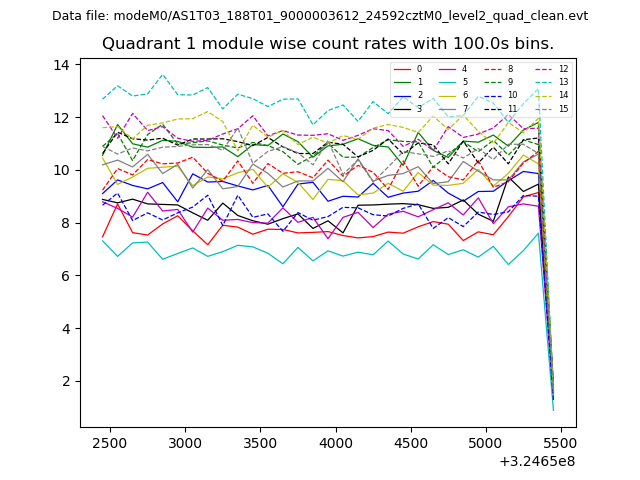
| Module-wise count rates for Quadrant A Data is divided into 100 sec bins |
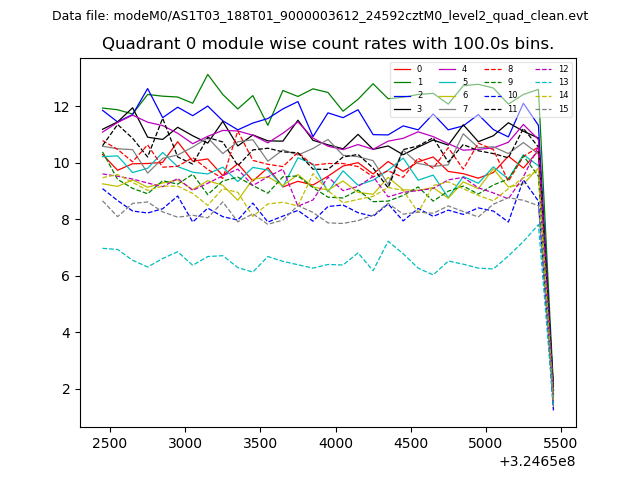 |
 |
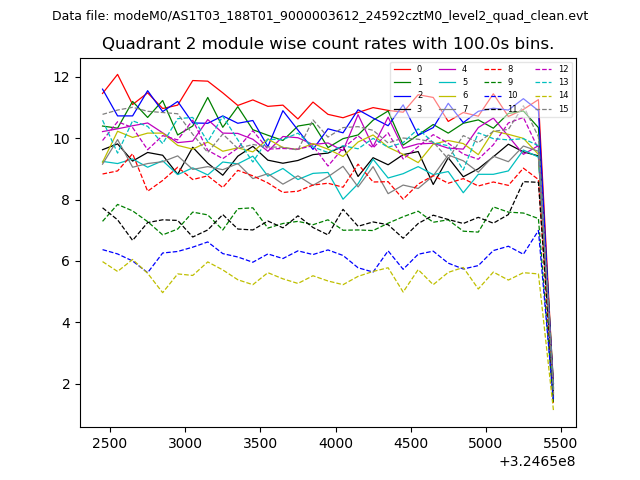
| Module-wise count rates for Quadrant B Data is divided into 100 sec bins |
 |
 |
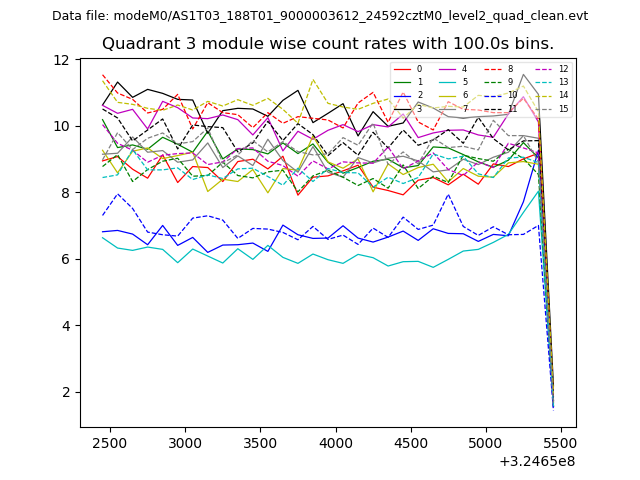
| Module-wise count rates for Quadrant C Data is divided into 100 sec bins |
 |
 |
| Module-wise count rates for Quadrant D Data is divided into 100 sec bins |
 |
 |
| Parameter | Plot |
|---|---|
| CZT HV Monitor | 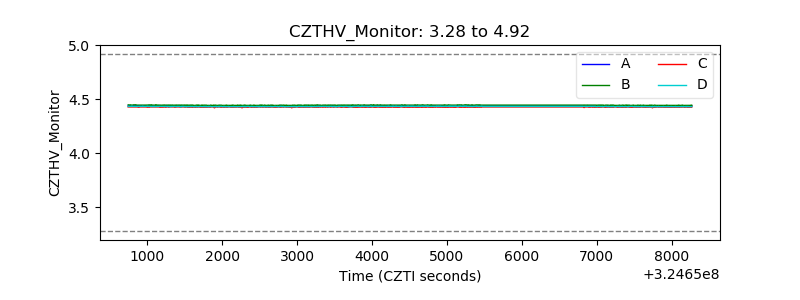 |
| D_VDD | 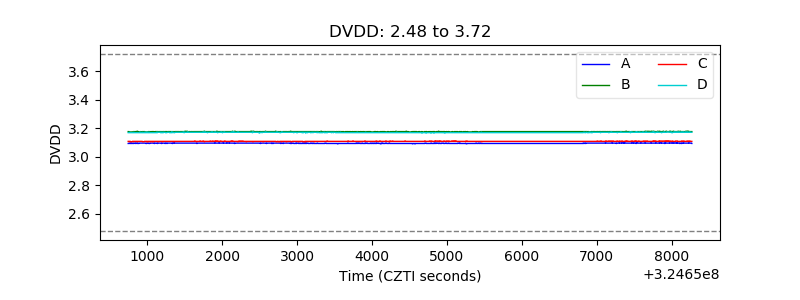 |
| Temperature 1 | 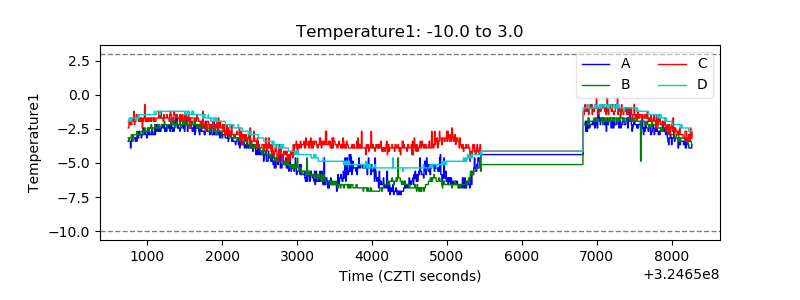 |
| Veto HV Monitor | 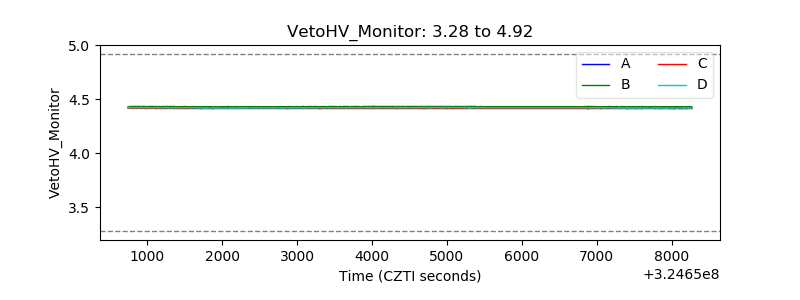 |
| Veto LLD | 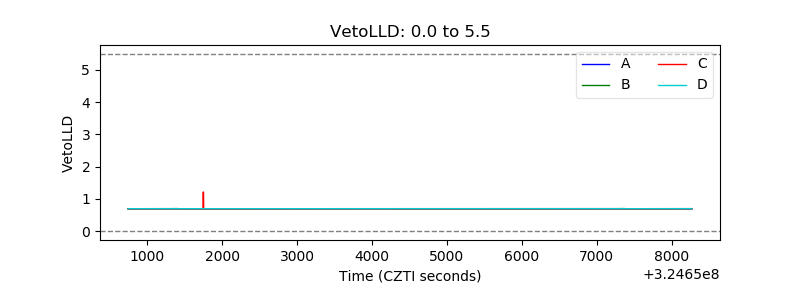 |
| Alpha Counter | 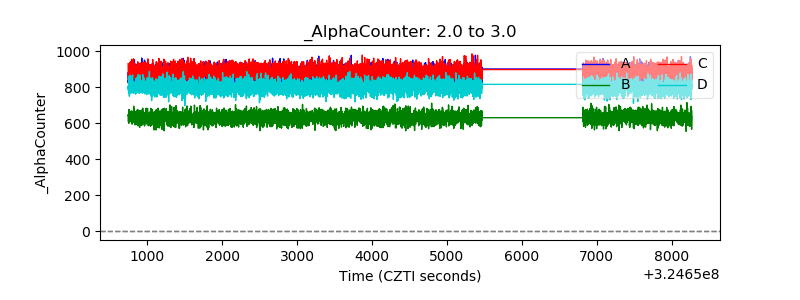 |
| _CPM_Rate | 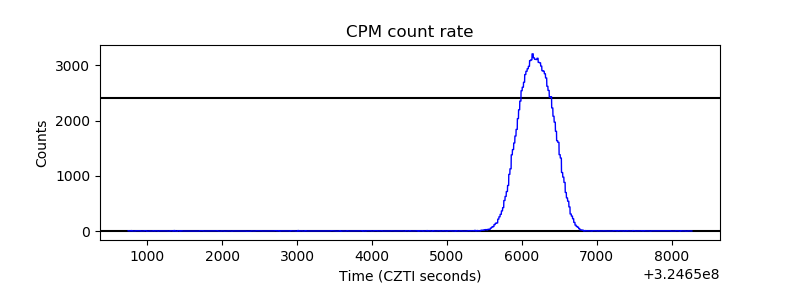 |
| CZT Counter | 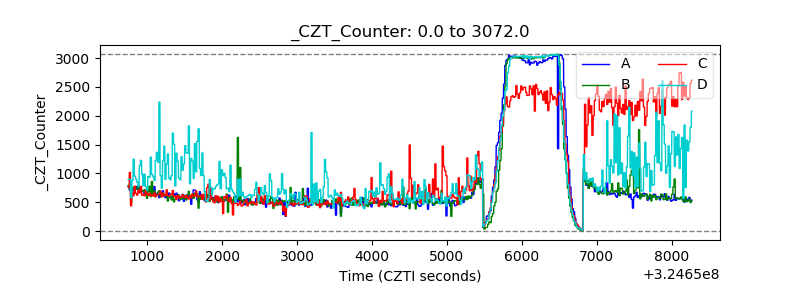 |
| +2.5 Volts monitor |  |
| +5 Volts monitor | 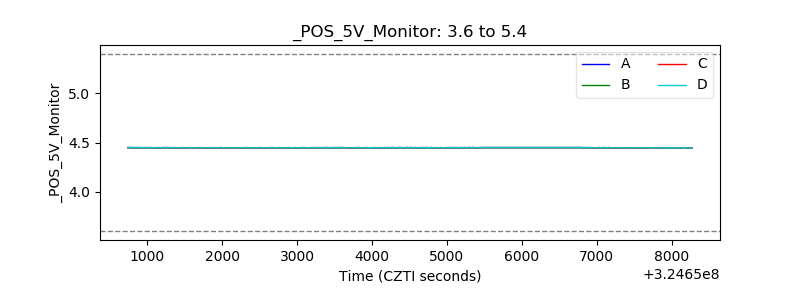 |
| _ROLL_ROT | 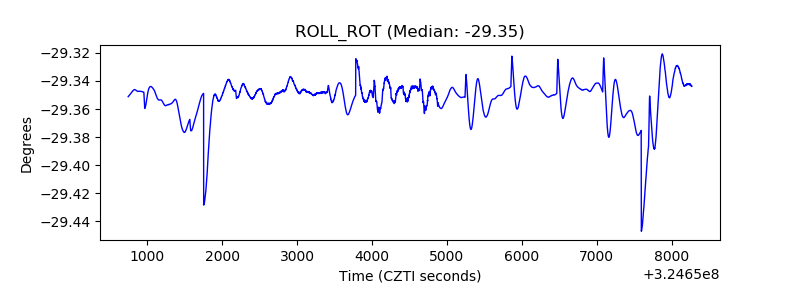 |
| _Roll_DEC | 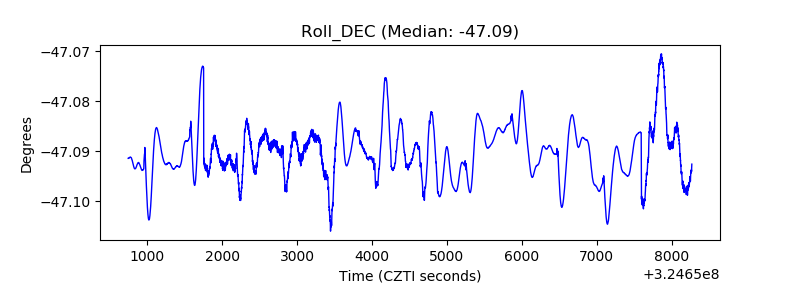 |
| _Roll_RA | 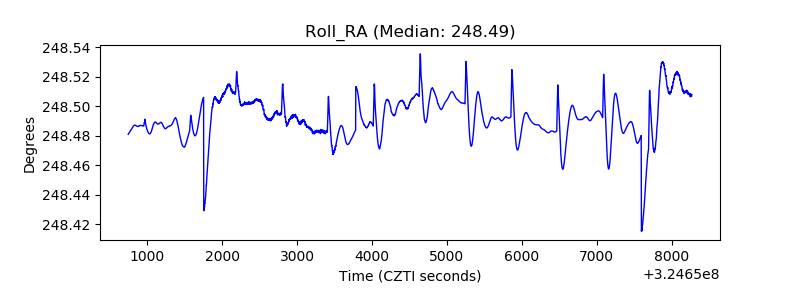 |
| Veto Counter | 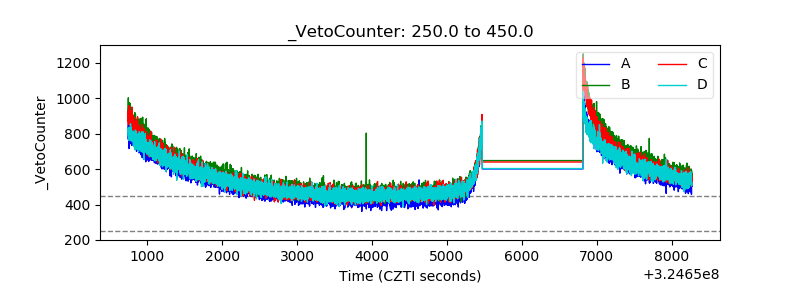 |