| Param | Original file | Final file |
|---|---|---|
| Filename | modeM0/AS1T03_188T01_9000003612_24593cztM0_level2.evt | modeM0/AS1T03_188T01_9000003612_24593cztM0_level2_quad_clean.evt |
| Size (bytes) | 520,974,720 | 54,377,280 |
| Size | 496.8 MB | 51.9 MB |
| Events in quadrant A | 1,967,946 | 383,409 |
| Events in quadrant B | 2,061,486 | 388,254 |
| Events in quadrant C | 8,136,995 | 269,090 |
| Events in quadrant D | 3,358,316 | 341,517 |
| Mode M0 | |||
|---|---|---|---|
| Quadrant | BADHDUFLAG | Total packets | Discarded packets |
| A | 0 | 8217 | 0 |
| B | 0 | 8396 | 0 |
| C | 0 | 26704 | 0 |
| D | 0 | 12404 | 0 |
| Mode SS | |||
|---|---|---|---|
| Quadrant | BADHDUFLAG | Total packets | Discarded packets |
| A | 0 | 74 | 0 |
| B | 0 | 74 | 0 |
| C | 0 | 74 | 0 |
| D | 0 | 74 | 0 |
| Quadrant | Total seconds | Saturated seconds | Saturation percentage |
|---|---|---|---|
| A | 3724 | 2 | 0.053706% |
| B | 3724 | 8 | 0.214823% |
| C | 3724 | 3056 | 82.062299% |
| D | 3724 | 161 | 4.323308% |
Noise dominated data is calculated using 1-second bins in cleaned event files. If a bin has >2000 counts, and if more than 50% of those come from <1% of pixels, then it is considered to be noise-dominated and hence unusable.
| Quadrant | # 1 sec bins | Bins with >0 counts | Bins with >2000 counts | High rate bins dominated by noise | Noise dominated (total time) | Noise dominated (detector-on time) | Marked lightcurve |
|---|---|---|---|---|---|---|---|
| A | 3724 | 3724 | 0 | 0 | 0.00% | 0.00% | 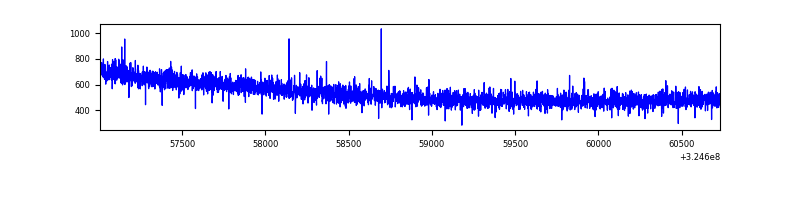 |
| B | 3724 | 3724 | 0 | 0 | 0.00% | 0.00% | 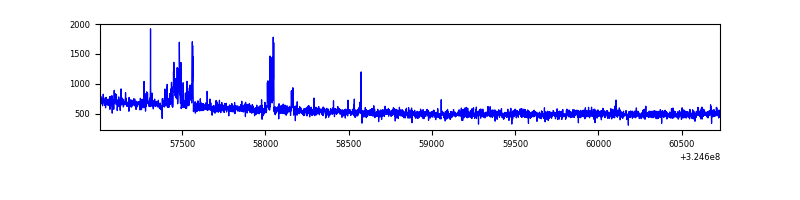 |
| C | 3724 | 3724 | 2752 | 2752 | 73.90% | 73.90% | 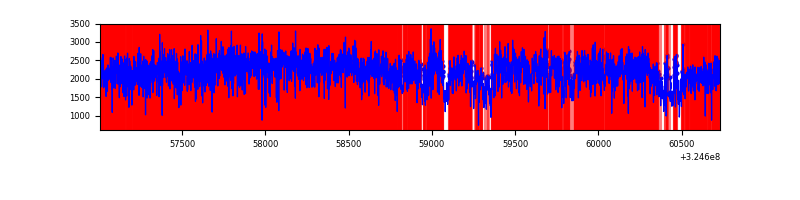 |
| D | 3724 | 3724 | 160 | 160 | 4.30% | 4.30% | 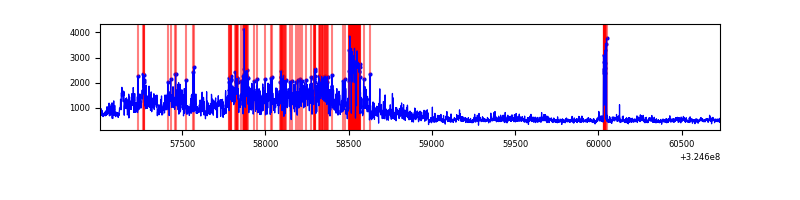 |
Top three noisy pixels from each quadrant. If the there are fewer than three noisy pixels in the level2.evt file, extra rows are filled as -1
| Pixel properties | Quadrant properties | ||||||
|---|---|---|---|---|---|---|---|
| Quadrant | DetID | PixID | Counts | Sigma | Mean | Median | Sigma |
| A | 13 | 254 | 6715 | 61.23 | 510 | 502 | 101.5 |
| A | 0 | 226 | 4399 | 38.41 | 510 | 502 | 101.5 |
| A | 3 | 137 | 4009 | 34.56 | 510 | 502 | 101.5 |
| B | 0 | 190 | 41925 | 440.4 | 509 | 499 | 94.1 |
| B | 3 | 64 | 24202 | 251.99 | 509 | 499 | 94.1 |
| B | 7 | 202 | 10619 | 107.59 | 509 | 499 | 94.1 |
| C | 7 | 247 | 6617923 | 78768.59 | 367 | 370 | 84.0 |
| C | 14 | 238 | 57925 | 685.08 | 367 | 370 | 84.0 |
| C | 7 | 226 | 19769 | 230.91 | 367 | 370 | 84.0 |
| D | 8 | 195 | 1209786 | 10666.53 | 473 | 463 | 113.4 |
| D | 1 | 52 | 355721 | 3133.46 | 473 | 463 | 113.4 |
| D | 2 | 234 | 16015 | 137.17 | 473 | 463 | 113.4 |
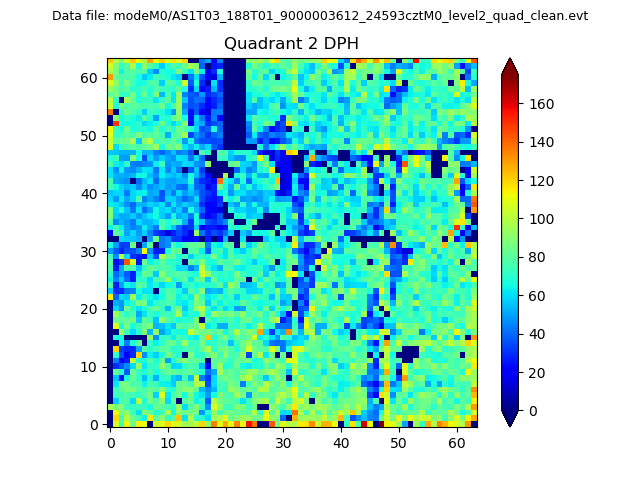
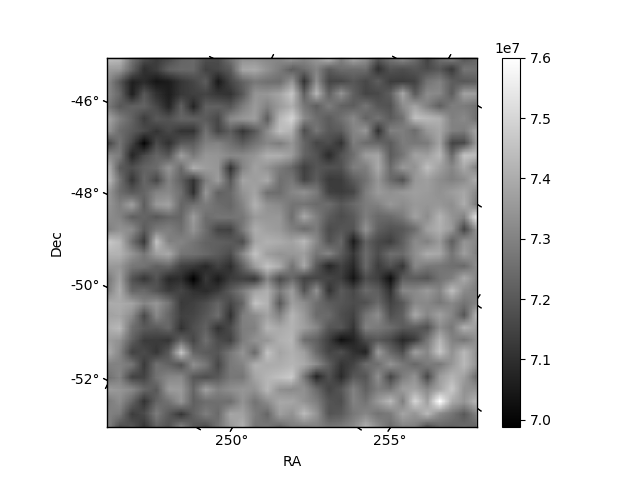
Histogram calculated using DETX and DETY for each event in the final _common_clean file
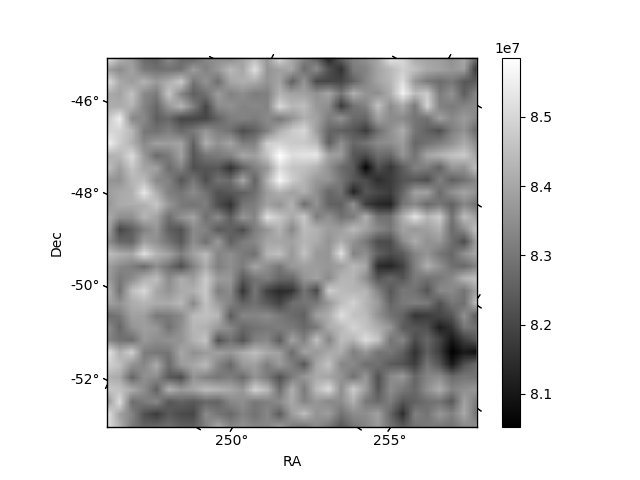
| Quadrant A | 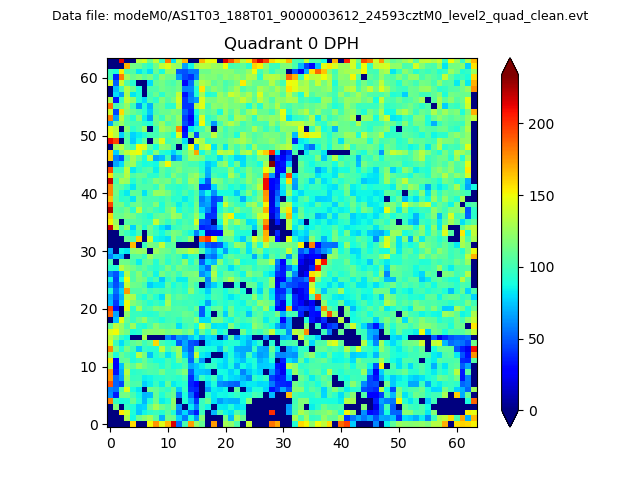 |
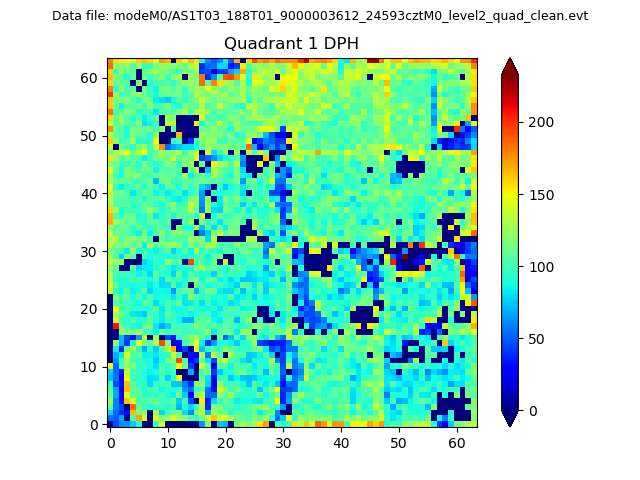 |
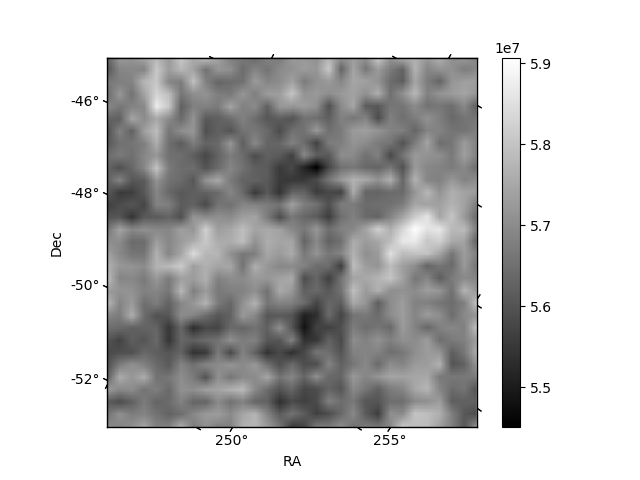
Quadrant B |
|---|---|---|---|
| Quadrant D | 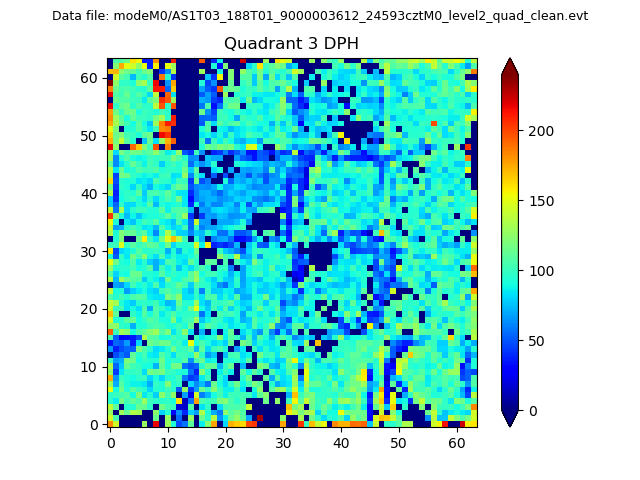 |
 |
Quadrant C |
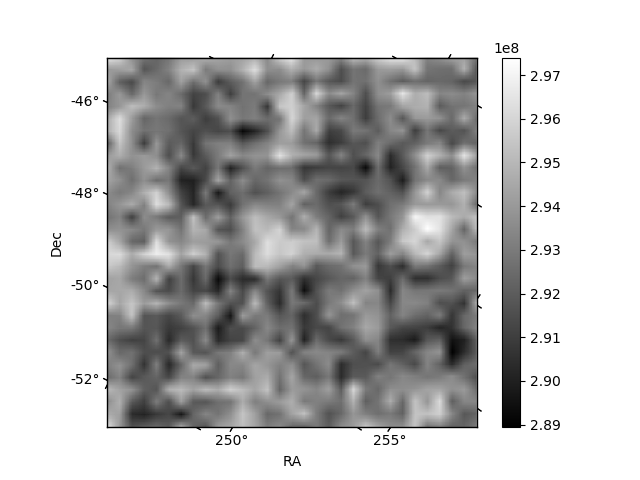
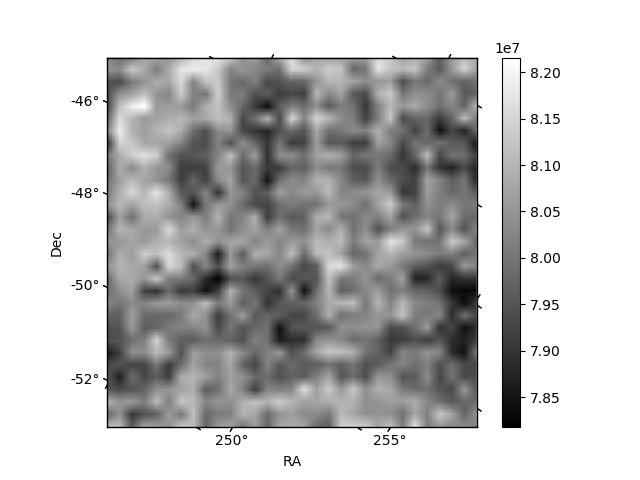
| Plot type | Count rate plots | Images |
|---|---|---|
| Comparison with Poisson distribution Blue bars denote a histogram of data divided into 1 sec bins. Red curve is a Poisson curve with rate = median count rate of data. |
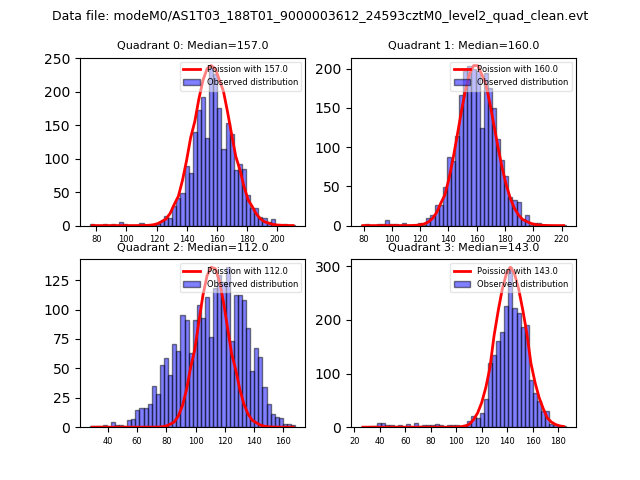 |
 |
| Quadrant-wise count rates Data is divided into 100 sec bins |
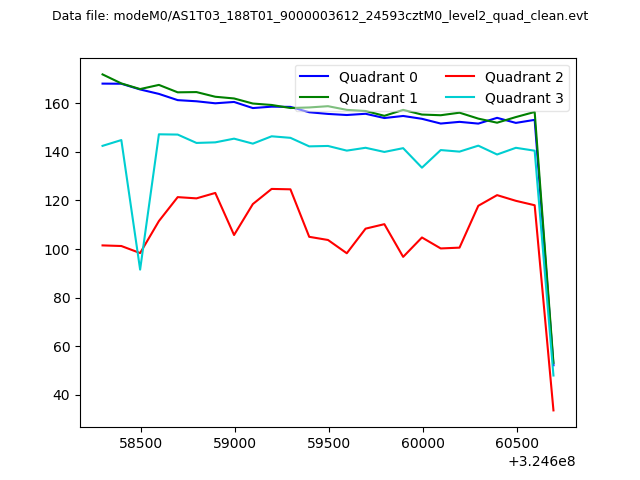 |
|
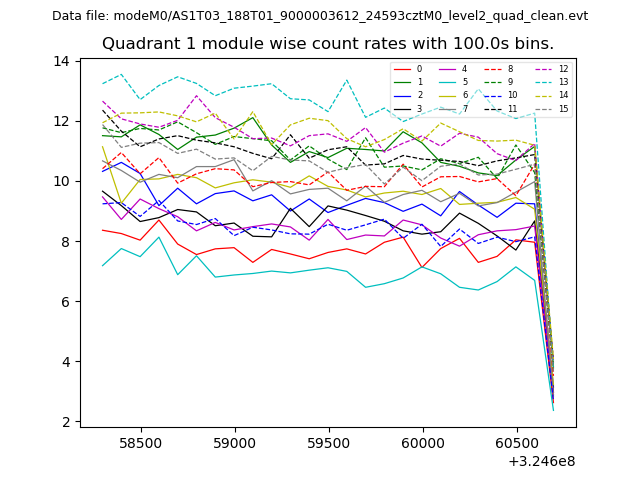
| Module-wise count rates for Quadrant A Data is divided into 100 sec bins |
 |
 |
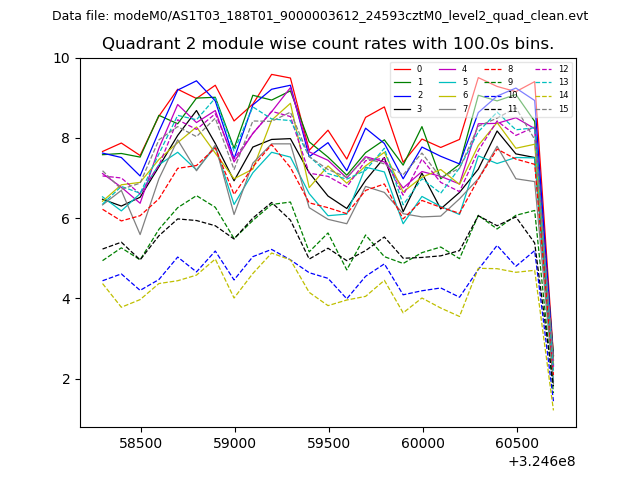
| Module-wise count rates for Quadrant B Data is divided into 100 sec bins |
 |
 |
| Module-wise count rates for Quadrant C Data is divided into 100 sec bins |
 |
 |
| Module-wise count rates for Quadrant D Data is divided into 100 sec bins |
 |
 |
| Parameter | Plot |
|---|---|
| CZT HV Monitor | 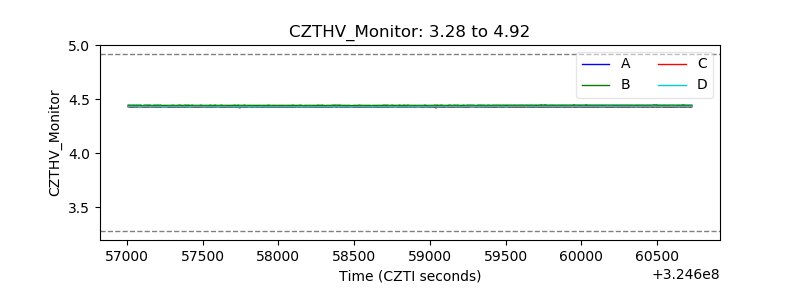 |
| D_VDD | 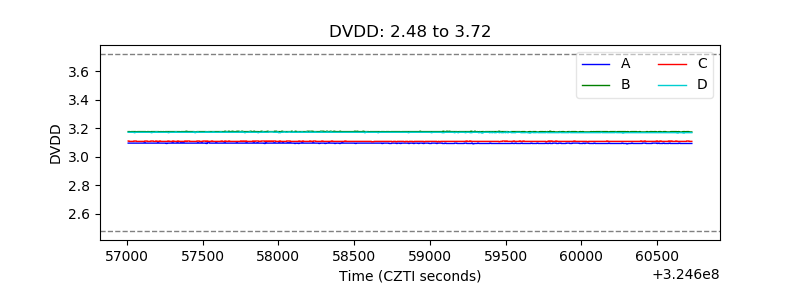 |
| Temperature 1 |  |
| Veto HV Monitor | 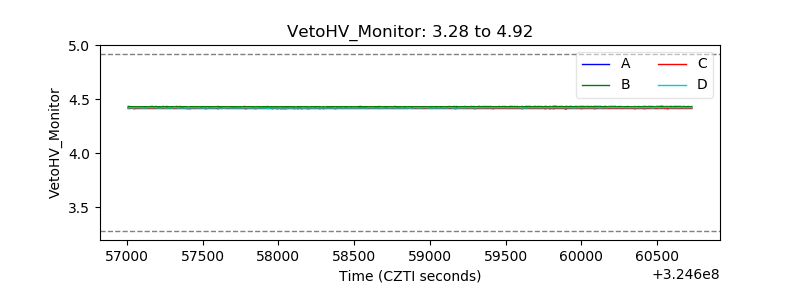 |
| Veto LLD | 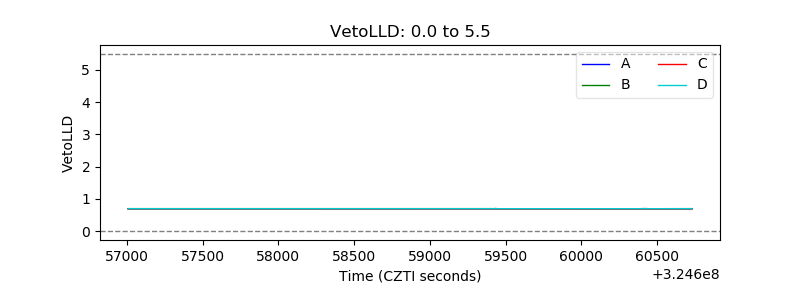 |
| Alpha Counter | 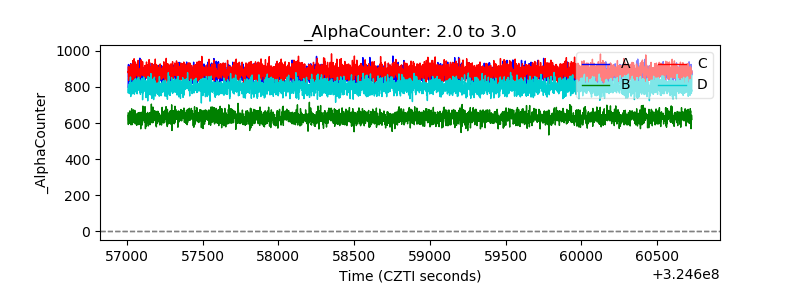 |
| _CPM_Rate | 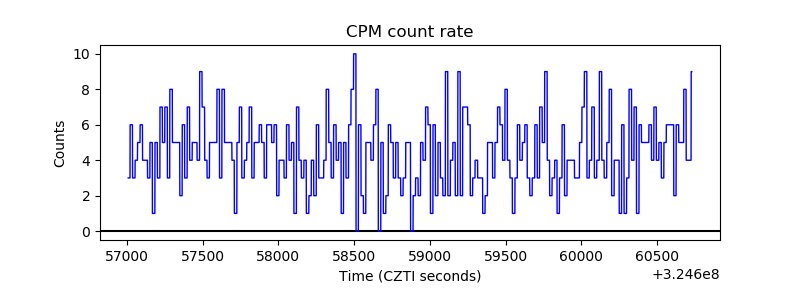 |
| CZT Counter | 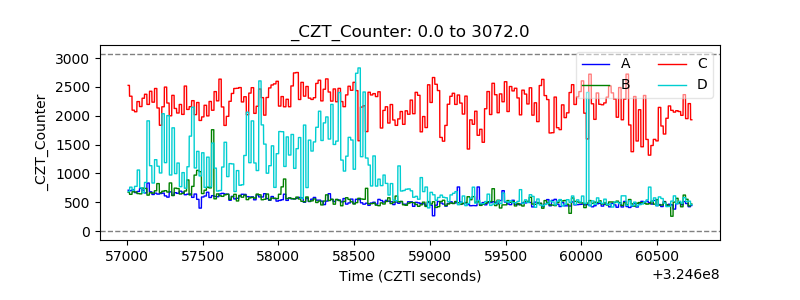 |
| +2.5 Volts monitor |  |
| +5 Volts monitor |  |
| _ROLL_ROT |  |
| _Roll_DEC |  |
| _Roll_RA | 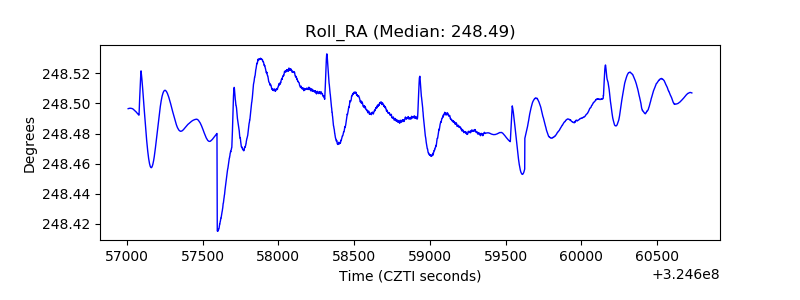 |
| Veto Counter |  |