| Param | Original file | Final file |
|---|---|---|
| Filename | modeM0/AS1T03_189T01_9000003614cztM0_level2.fits | modeM0/AS1T03_189T01_9000003614cztM0_level2_quad_clean.evt |
| Size (bytes) | 965,736,000 | 797,564,160 |
| Size | 921.0 MB | 760.6 MB |
| Events in quadrant A | 6,053,229 | 4,643,108 |
| Events in quadrant B | 5,718,622 | 4,586,160 |
| Events in quadrant C | 5,647,286 | 4,173,735 |
| Events in quadrant D | 5,091,776 | 4,016,527 |
| Mode M9 | |||
|---|---|---|---|
| Quadrant | BADHDUFLAG | Total packets | Discarded packets |
| A | 0 | 273 | 0 |
| B | 0 | 273 | 0 |
| C | 0 | 273 | 0 |
| D | 0 | 273 | 0 |
| Mode M0 | |||
|---|---|---|---|
| Quadrant | BADHDUFLAG | Total packets | Discarded packets |
| A | 0 | 198822 | 0 |
| B | 0 | 214121 | 0 |
| C | 0 | 274005 | 0 |
| D | 0 | 238640 | 0 |
| Mode SS | |||
|---|---|---|---|
| Quadrant | BADHDUFLAG | Total packets | Discarded packets |
| A | 0 | 1914 | 0 |
| B | 0 | 3700 | 0 |
| C | 0 | 3700 | 0 |
| D | 0 | 3700 | 0 |
| Quadrant | Total seconds | Saturated seconds | Saturation percentage |
|---|---|---|---|
| A | 93953 | 1128 | 1.200600% |
| B | 93956 | 2665 | 2.836434% |
| C | 93952 | 8347 | 8.884324% |
| D | 93952 | 3477 | 3.700826% |
Noise dominated data is calculated using 1-second bins in cleaned event files. If a bin has >2000 counts, and if more than 50% of those come from <1% of pixels, then it is considered to be noise-dominated and hence unusable.
| Quadrant | # 1 sec bins | Bins with >0 counts | Bins with >2000 counts | High rate bins dominated by noise | Noise dominated (total time) | Noise dominated (detector-on time) | Marked lightcurve |
|---|---|---|---|---|---|---|---|
| A | 107962 | 93948 | 0 | 0 | 0.00% | 0.00% |  |
| B | 107962 | 93943 | 0 | 0 | 0.00% | 0.00% |  |
| C | 107961 | 93942 | 0 | 0 | 0.00% | 0.00% |  |
| D | 107961 | 93868 | 0 | 0 | 0.00% | 0.00% |  |
Top three noisy pixels from each quadrant. If the there are fewer than three noisy pixels in the level2.evt file, extra rows are filled as -1
| Pixel properties | Quadrant properties | ||||||
|---|---|---|---|---|---|---|---|
| Quadrant | DetID | PixID | Counts | Sigma | Mean | Median | Sigma |
| A | 0 | 29 | 5699 | 11.1 | 1575 | 1484 | 379.8 |
| A | 7 | 110 | 4763 | 8.63 | 1575 | 1484 | 379.8 |
| A | 9 | 19 | 4386 | 7.64 | 1575 | 1484 | 379.8 |
| B | 2 | 9 | 4486 | 10.21 | 1513 | 1449 | 297.6 |
| B | 2 | 8 | 3823 | 7.98 | 1513 | 1449 | 297.6 |
| B | 5 | 128 | 3754 | 7.75 | 1513 | 1449 | 297.6 |
| C | 3 | 126 | 3855 | 6.52 | 1492 | 1399 | 376.7 |
| C | 9 | 209 | 3817 | 6.42 | 1492 | 1399 | 376.7 |
| C | 12 | 241 | 3815 | 6.41 | 1492 | 1399 | 376.7 |
| D | 3 | 14 | 3548 | 5.83 | 1452 | 1325 | 381.1 |
| D | 6 | 67 | 3540 | 5.81 | 1452 | 1325 | 381.1 |
| D | 10 | 189 | 3533 | 5.79 | 1452 | 1325 | 381.1 |
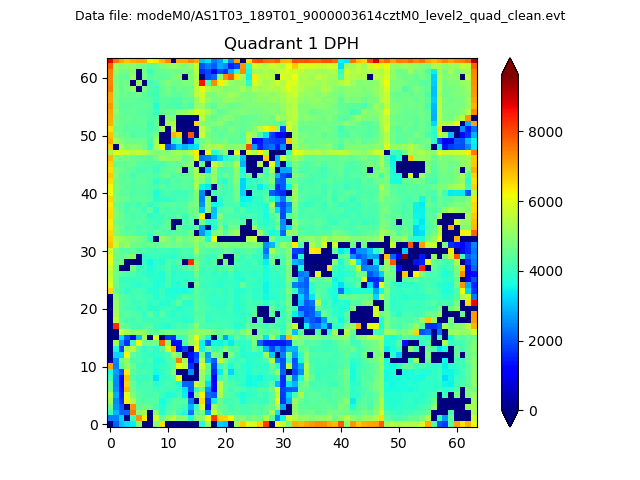
Histogram calculated using DETX and DETY for each event in the final _common_clean file
| Quadrant A |  |
 |
Quadrant B |
|---|---|---|---|
| Quadrant D | 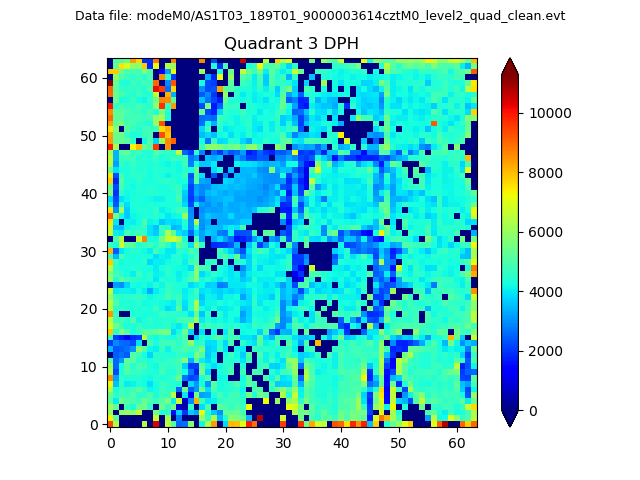 |
 |
Quadrant C |
| Plot type | Count rate plots | Images |
|---|---|---|
| Comparison with Poisson distribution Blue bars denote a histogram of data divided into 1 sec bins. Red curve is a Poisson curve with rate = median count rate of data. |
 |
 |
| Quadrant-wise count rates Data is divided into 100 sec bins |
 |
|
| Module-wise count rates for Quadrant A Data is divided into 100 sec bins |
 |
 |
| Module-wise count rates for Quadrant B Data is divided into 100 sec bins |
 |
 |
| Module-wise count rates for Quadrant C Data is divided into 100 sec bins |
 |
 |
| Module-wise count rates for Quadrant D Data is divided into 100 sec bins |
 |
 |
| Parameter | Plot |
|---|---|
| CZT HV Monitor |  |
| D_VDD |  |
| Temperature 1 |  |
| Veto HV Monitor |  |
| Veto LLD |  |
| Alpha Counter |  |
| _CPM_Rate |  |
| CZT Counter |  |
| +2.5 Volts monitor |  |
| +5 Volts monitor |  |
| _ROLL_ROT |  |
| _Roll_DEC |  |
| _Roll_RA |  |
| Veto Counter |  |