| Param | Original file | Final file |
|---|---|---|
| Filename | modeM0/AS1T03_189T01_9000003614_24593cztM0_level2.evt | modeM0/AS1T03_189T01_9000003614_24593cztM0_level2_quad_clean.evt |
| Size (bytes) | 175,403,520 | 25,223,040 |
| Size | 167.3 MB | 24.1 MB |
| Events in quadrant A | 771,841 | 184,994 |
| Events in quadrant B | 803,927 | 188,083 |
| Events in quadrant C | 2,159,469 | 149,091 |
| Events in quadrant D | 1,487,238 | 144,364 |
| Mode M9 | |||
|---|---|---|---|
| Quadrant | BADHDUFLAG | Total packets | Discarded packets |
| A | 0 | 9 | 0 |
| B | 0 | 9 | 0 |
| C | 0 | 9 | 0 |
| D | 0 | 9 | 0 |
| Mode M0 | |||
|---|---|---|---|
| Quadrant | BADHDUFLAG | Total packets | Discarded packets |
| A | 0 | 3161 | 1 |
| B | 0 | 3329 | 1 |
| C | 0 | 7299 | 1 |
| D | 0 | 5397 | 1 |
| Mode SS | |||
|---|---|---|---|
| Quadrant | BADHDUFLAG | Total packets | Discarded packets |
| A | 0 | 26 | 0 |
| B | 0 | 26 | 0 |
| C | 0 | 26 | 0 |
| D | 0 | 26 | 0 |
| Quadrant | Total seconds | Saturated seconds | Saturation percentage |
|---|---|---|---|
| A | 1284 | 9 | 0.700935% |
| B | 1284 | 11 | 0.856698% |
| C | 1284 | 689 | 53.660436% |
| D | 1284 | 277 | 21.573209% |
Noise dominated data is calculated using 1-second bins in cleaned event files. If a bin has >2000 counts, and if more than 50% of those come from <1% of pixels, then it is considered to be noise-dominated and hence unusable.
| Quadrant | # 1 sec bins | Bins with >0 counts | Bins with >2000 counts | High rate bins dominated by noise | Noise dominated (total time) | Noise dominated (detector-on time) | Marked lightcurve |
|---|---|---|---|---|---|---|---|
| A | 1284 | 1284 | 0 | 0 | 0.00% | 0.00% | 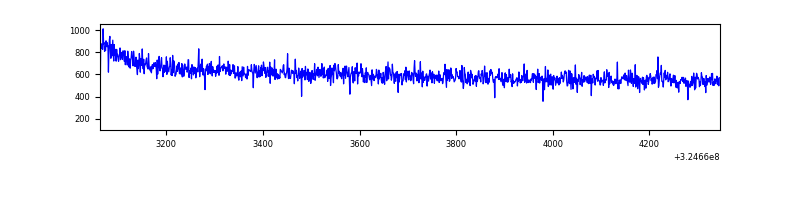 |
| B | 1284 | 1284 | 0 | 0 | 0.00% | 0.00% | 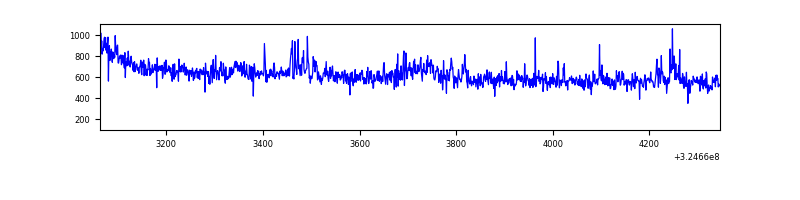 |
| C | 1284 | 1284 | 322 | 322 | 25.08% | 25.08% | 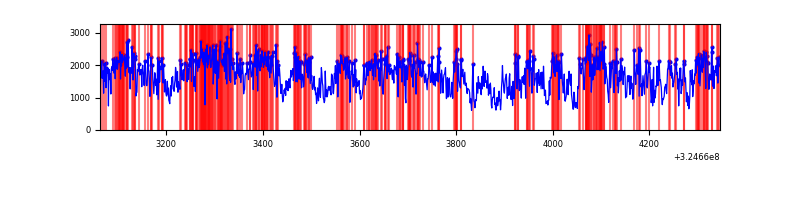 |
| D | 1284 | 1284 | 243 | 243 | 18.93% | 18.93% | 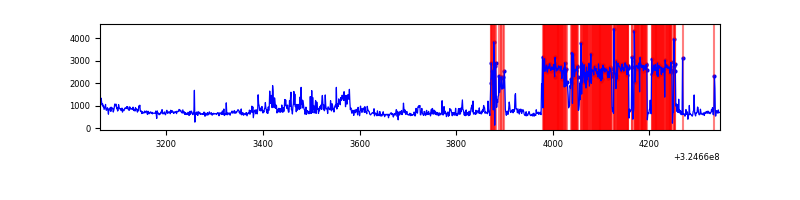 |
Top three noisy pixels from each quadrant. If the there are fewer than three noisy pixels in the level2.evt file, extra rows are filled as -1
| Pixel properties | Quadrant properties | ||||||
|---|---|---|---|---|---|---|---|
| Quadrant | DetID | PixID | Counts | Sigma | Mean | Median | Sigma |
| A | 13 | 254 | 2191 | 49.04 | 200 | 196 | 40.7 |
| A | 0 | 226 | 1712 | 37.26 | 200 | 196 | 40.7 |
| A | 3 | 137 | 1692 | 36.77 | 200 | 196 | 40.7 |
| B | 7 | 202 | 19625 | 506.52 | 197 | 193 | 38.4 |
| B | 0 | 190 | 12379 | 317.64 | 197 | 193 | 38.4 |
| B | 12 | 111 | 4114 | 102.21 | 197 | 193 | 38.4 |
| C | 7 | 247 | 1463753 | 35901.27 | 169 | 170 | 40.8 |
| C | 14 | 238 | 26990 | 657.89 | 169 | 170 | 40.8 |
| C | 0 | 239 | 4033 | 94.76 | 169 | 170 | 40.8 |
| D | 1 | 52 | 390212 | 9153.32 | 173 | 169 | 42.6 |
| D | 7 | 238 | 270945 | 6354.42 | 173 | 169 | 42.6 |
| D | 8 | 195 | 156926 | 3678.69 | 173 | 169 | 42.6 |
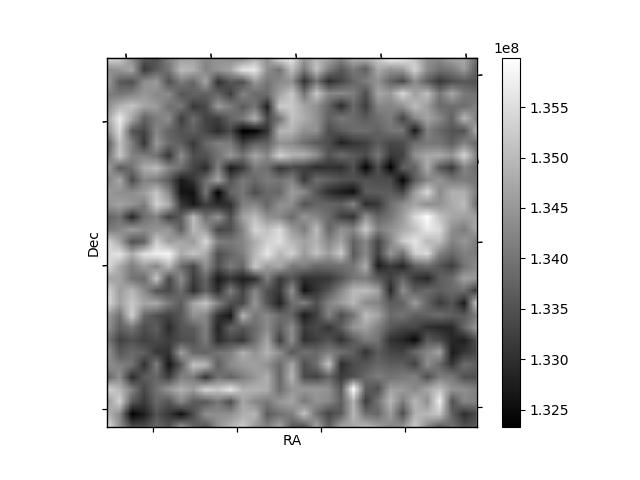
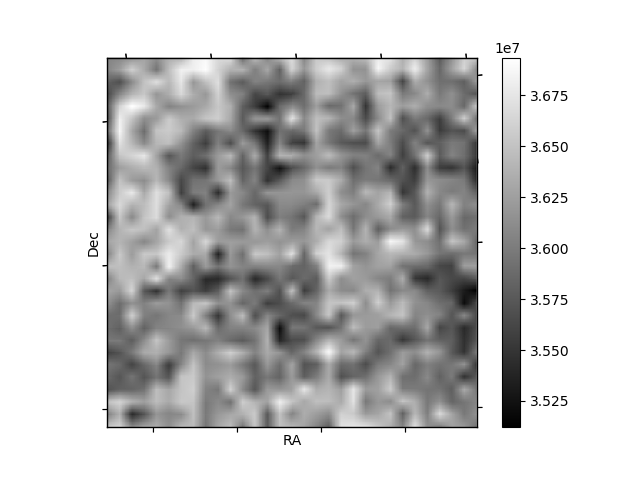
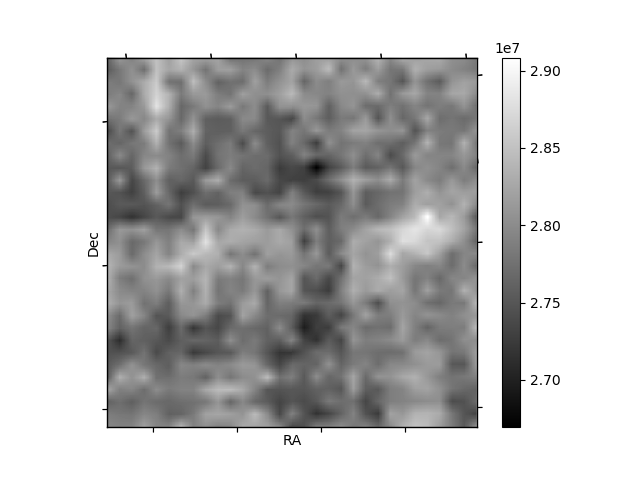
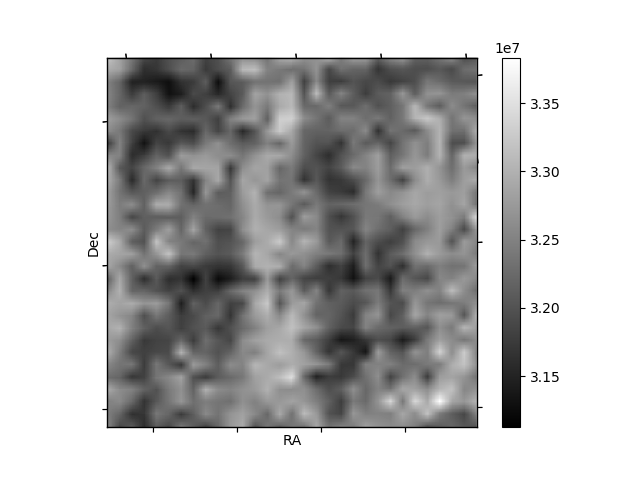
Histogram calculated using DETX and DETY for each event in the final _common_clean file
| Quadrant A | 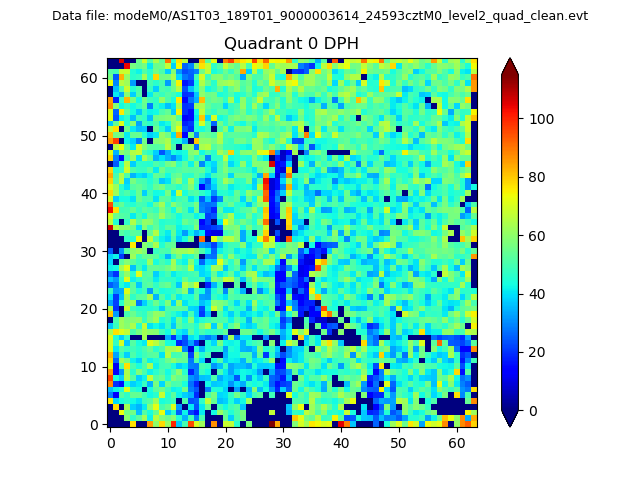 |
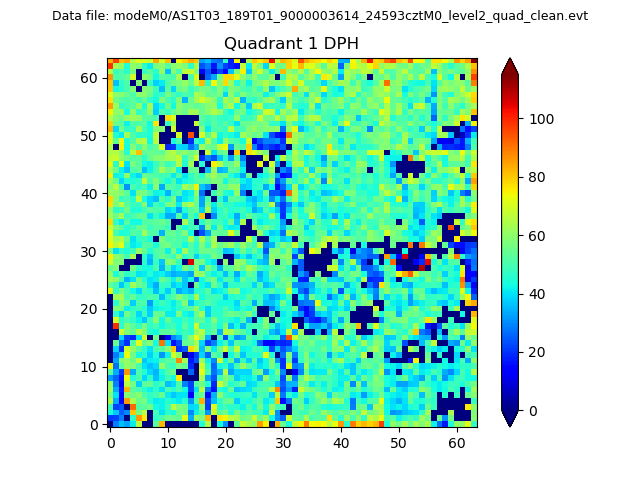 |
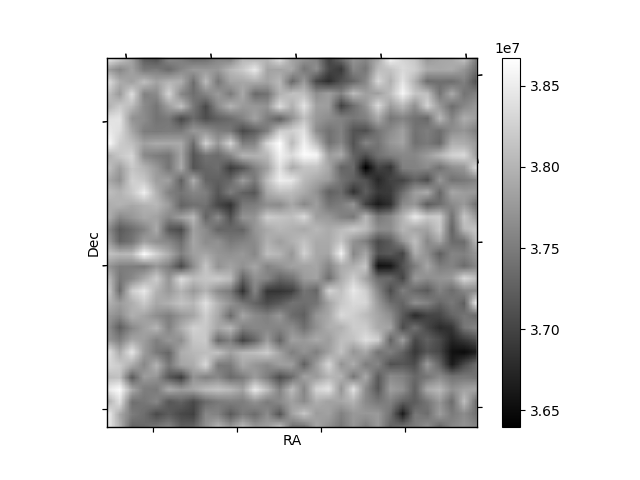
Quadrant B |
|---|---|---|---|
| Quadrant D | 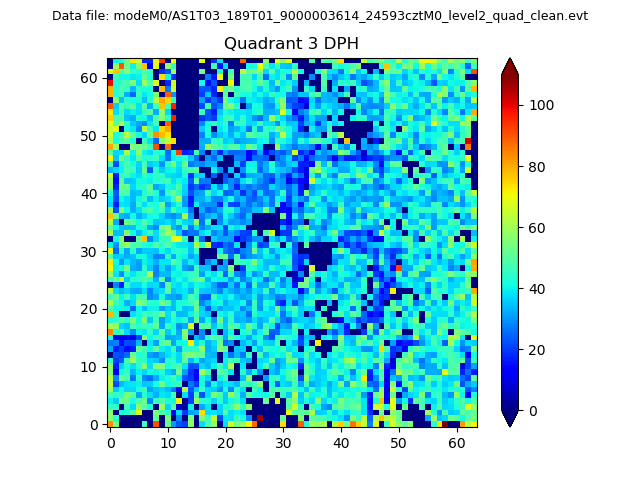 |
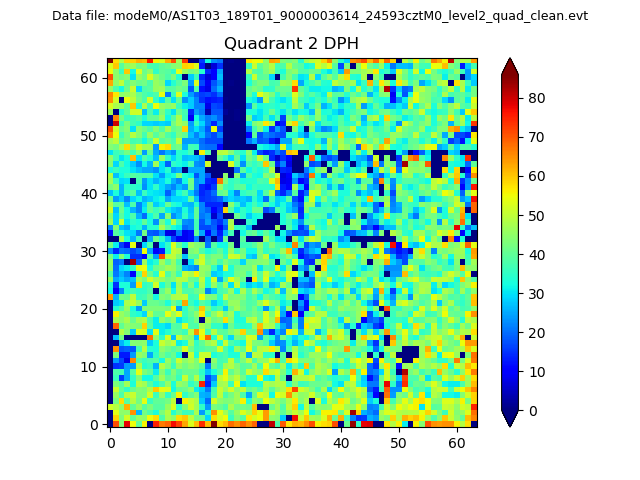 |
Quadrant C |
| Plot type | Count rate plots | Images |
|---|---|---|
| Comparison with Poisson distribution Blue bars denote a histogram of data divided into 1 sec bins. Red curve is a Poisson curve with rate = median count rate of data. |
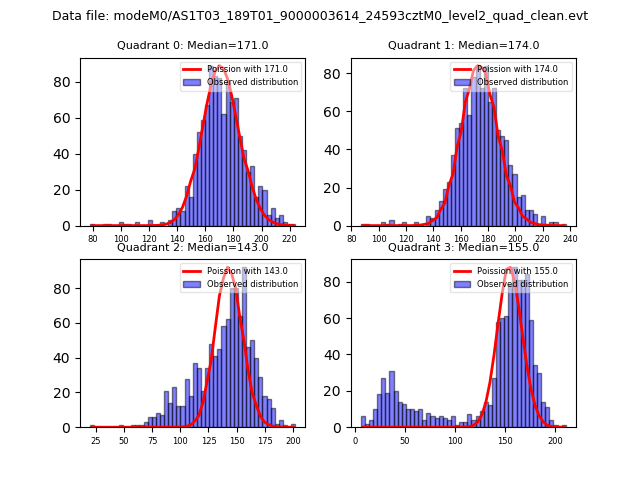 |
 |
| Quadrant-wise count rates Data is divided into 100 sec bins |
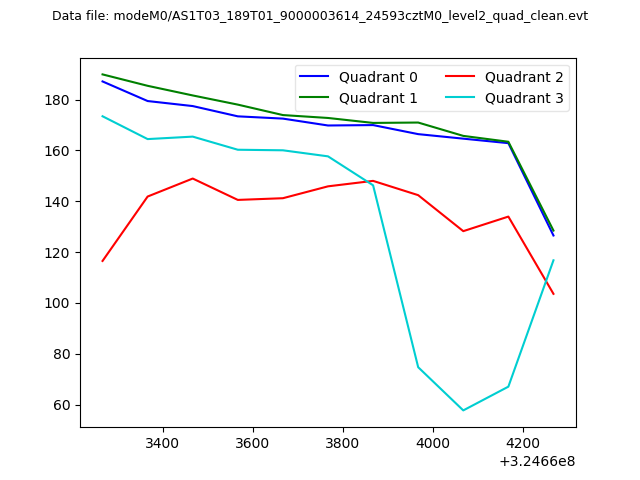 |
|
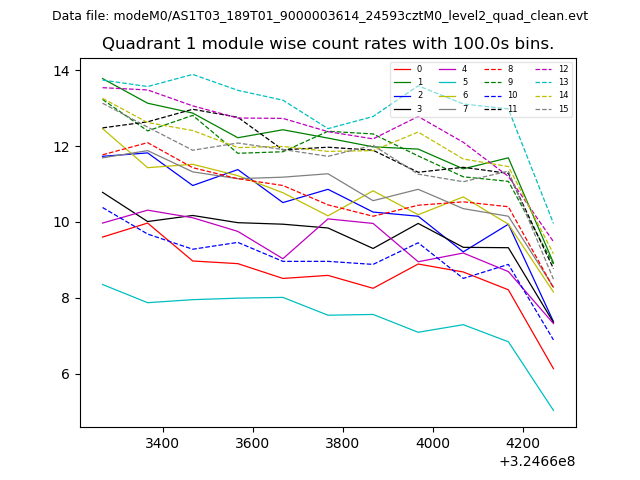
| Module-wise count rates for Quadrant A Data is divided into 100 sec bins |
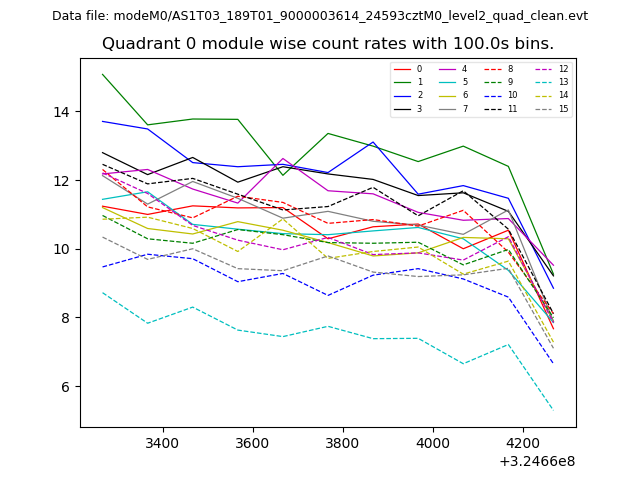 |
 |
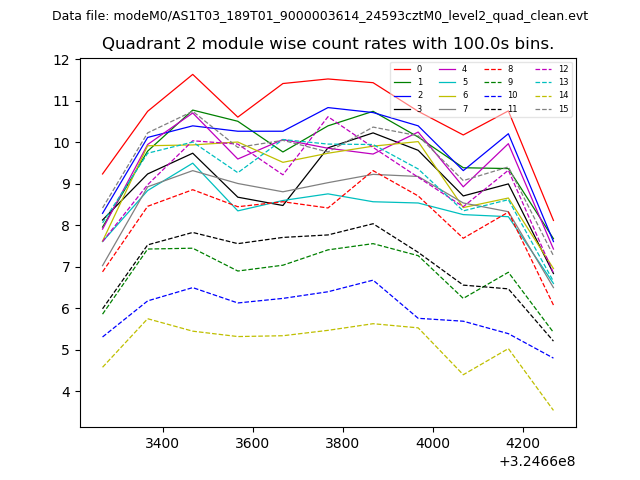
| Module-wise count rates for Quadrant B Data is divided into 100 sec bins |
 |
 |
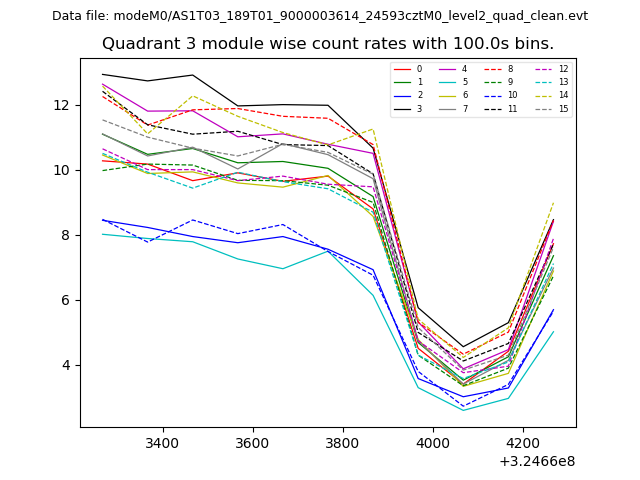
| Module-wise count rates for Quadrant C Data is divided into 100 sec bins |
 |
 |
| Module-wise count rates for Quadrant D Data is divided into 100 sec bins |
 |
 |
| Parameter | Plot |
|---|---|
| CZT HV Monitor | 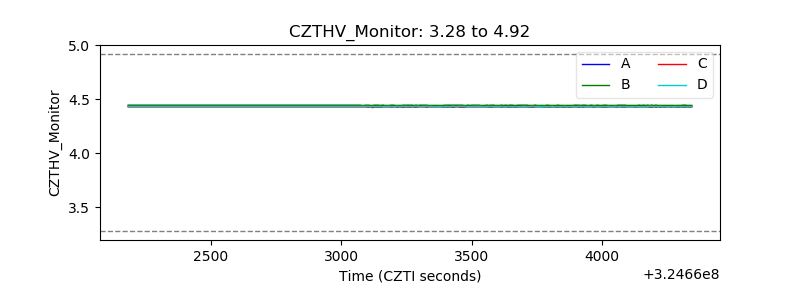 |
| D_VDD |  |
| Temperature 1 | 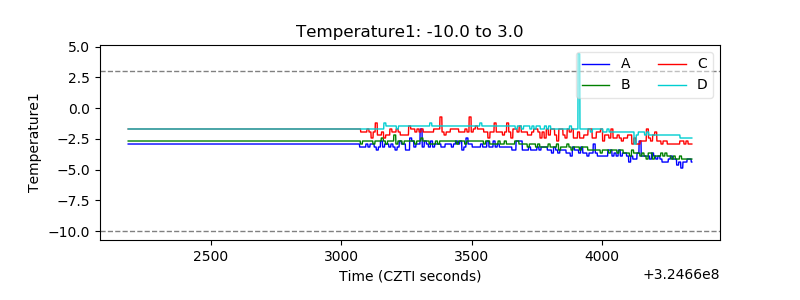 |
| Veto HV Monitor |  |
| Veto LLD | 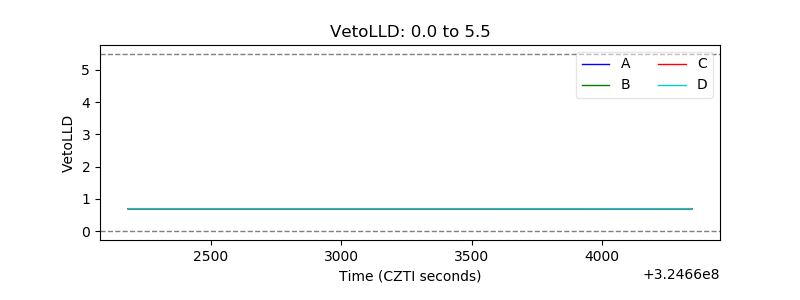 |
| Alpha Counter | 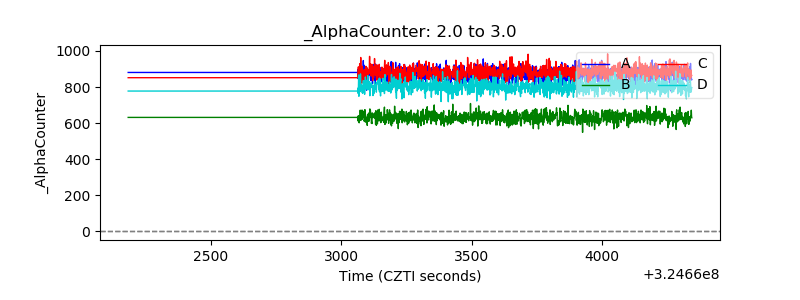 |
| _CPM_Rate | 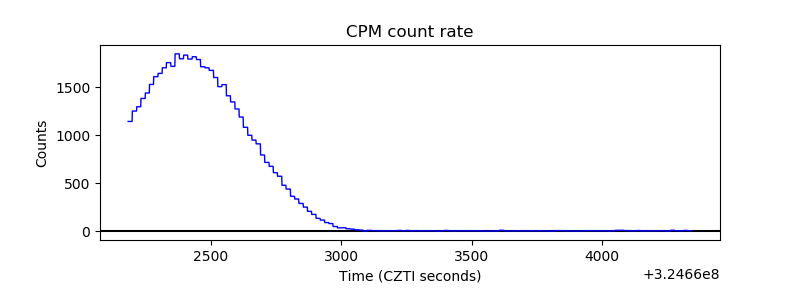 |
| CZT Counter | 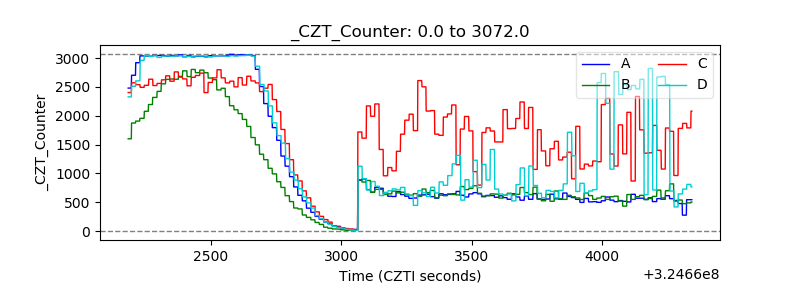 |
| +2.5 Volts monitor | 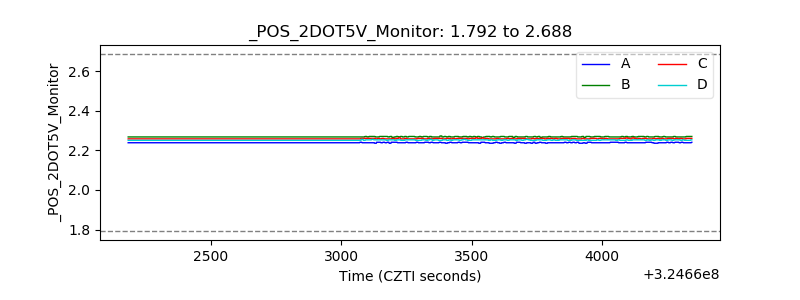 |
| +5 Volts monitor |  |
| _ROLL_ROT |  |
| _Roll_DEC | 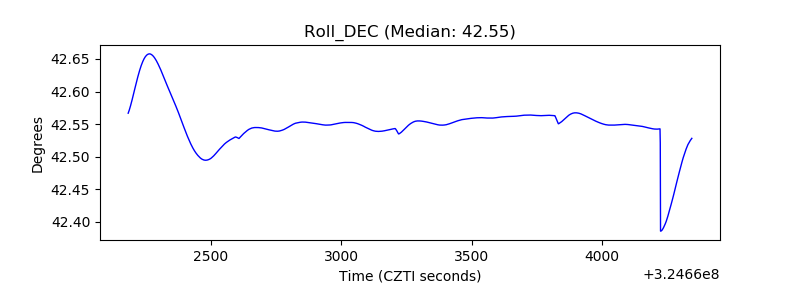 |
| _Roll_RA | 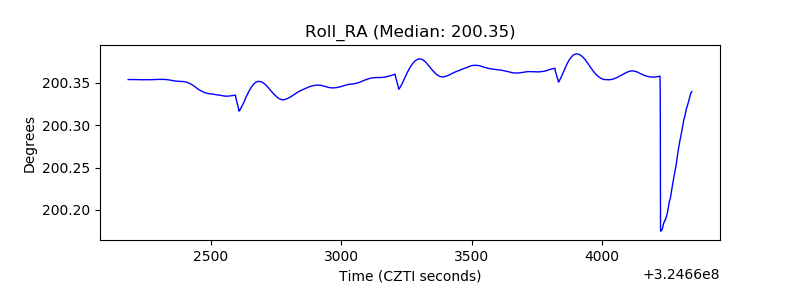 |
| Veto Counter | 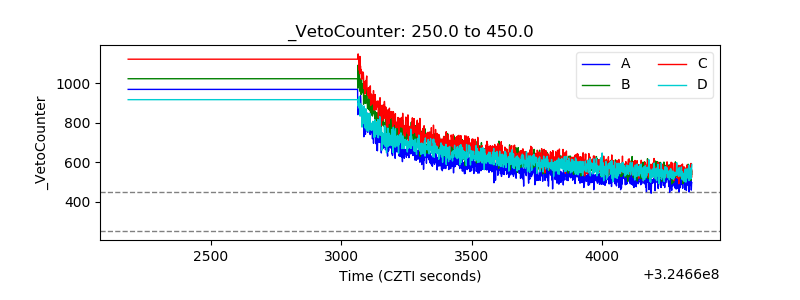 |