| Param | Original file | Final file |
|---|---|---|
| Filename | modeM0/AS1T03_189T01_9000003614_24594cztM0_level2.evt | modeM0/AS1T03_189T01_9000003614_24594cztM0_level2_quad_clean.evt |
| Size (bytes) | 801,296,640 | 108,492,480 |
| Size | 764.2 MB | 103.5 MB |
| Events in quadrant A | 3,303,143 | 776,859 |
| Events in quadrant B | 3,436,185 | 786,471 |
| Events in quadrant C | 11,893,457 | 591,830 |
| Events in quadrant D | 5,207,084 | 687,832 |
| Mode M9 | |||
|---|---|---|---|
| Quadrant | BADHDUFLAG | Total packets | Discarded packets |
| A | 0 | 21 | 0 |
| B | 0 | 22 | 0 |
| C | 0 | 22 | 0 |
| D | 0 | 22 | 0 |
| Mode M0 | |||
|---|---|---|---|
| Quadrant | BADHDUFLAG | Total packets | Discarded packets |
| A | 0 | 13771 | 3 |
| B | 0 | 14277 | 2 |
| C | 0 | 39734 | 2 |
| D | 0 | 19866 | 2 |
| Mode SS | |||
|---|---|---|---|
| Quadrant | BADHDUFLAG | Total packets | Discarded packets |
| A | 0 | 128 | 0 |
| B | 0 | 128 | 0 |
| C | 0 | 128 | 0 |
| D | 0 | 128 | 0 |
| Quadrant | Total seconds | Saturated seconds | Saturation percentage |
|---|---|---|---|
| A | 6325 | 82 | 1.296443% |
| B | 6325 | 105 | 1.660079% |
| C | 6325 | 4015 | 63.478261% |
| D | 6325 | 528 | 8.347826% |
Noise dominated data is calculated using 1-second bins in cleaned event files. If a bin has >2000 counts, and if more than 50% of those come from <1% of pixels, then it is considered to be noise-dominated and hence unusable.
| Quadrant | # 1 sec bins | Bins with >0 counts | Bins with >2000 counts | High rate bins dominated by noise | Noise dominated (total time) | Noise dominated (detector-on time) | Marked lightcurve |
|---|---|---|---|---|---|---|---|
| A | 7560 | 6326 | 0 | 0 | 0.00% | 0.00% | 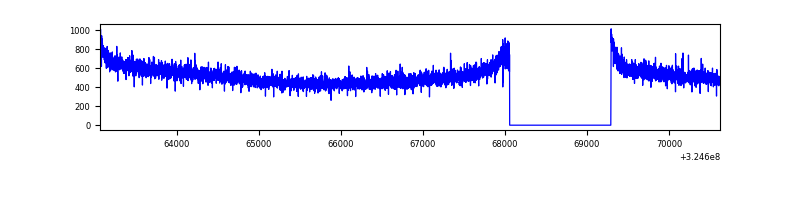 |
| B | 7560 | 6326 | 2 | 2 | 0.03% | 0.03% | 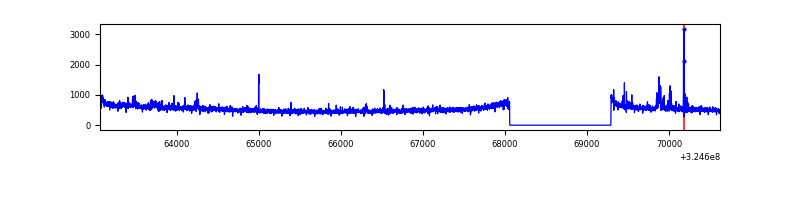 |
| C | 7560 | 6326 | 2966 | 2966 | 39.23% | 46.89% | 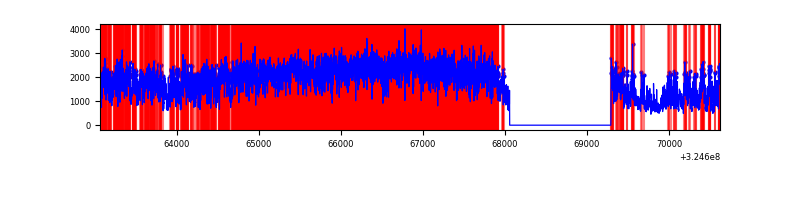 |
| D | 7560 | 6326 | 425 | 425 | 5.62% | 6.72% | 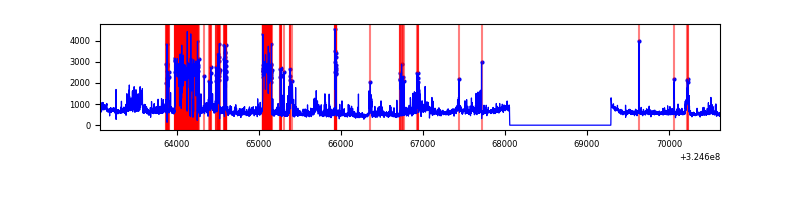 |
Top three noisy pixels from each quadrant. If the there are fewer than three noisy pixels in the level2.evt file, extra rows are filled as -1
| Pixel properties | Quadrant properties | ||||||
|---|---|---|---|---|---|---|---|
| Quadrant | DetID | PixID | Counts | Sigma | Mean | Median | Sigma |
| A | 13 | 254 | 10156 | 55.03 | 856 | 842 | 169.2 |
| A | 0 | 226 | 7262 | 37.93 | 856 | 842 | 169.2 |
| A | 3 | 137 | 7251 | 37.87 | 856 | 842 | 169.2 |
| B | 0 | 190 | 69617 | 436.15 | 849 | 830 | 157.7 |
| B | 7 | 202 | 39110 | 242.72 | 849 | 830 | 157.7 |
| B | 12 | 111 | 18989 | 115.14 | 849 | 830 | 157.7 |
| C | 7 | 247 | 8990426 | 56156.95 | 692 | 696 | 160.1 |
| C | 14 | 238 | 108175 | 671.4 | 692 | 696 | 160.1 |
| C | 2 | 16 | 51048 | 314.54 | 692 | 696 | 160.1 |
| D | 1 | 52 | 1045784 | 5498.54 | 804 | 783 | 190.1 |
| D | 7 | 238 | 666320 | 3501.9 | 804 | 783 | 190.1 |
| D | 8 | 195 | 445245 | 2338.65 | 804 | 783 | 190.1 |
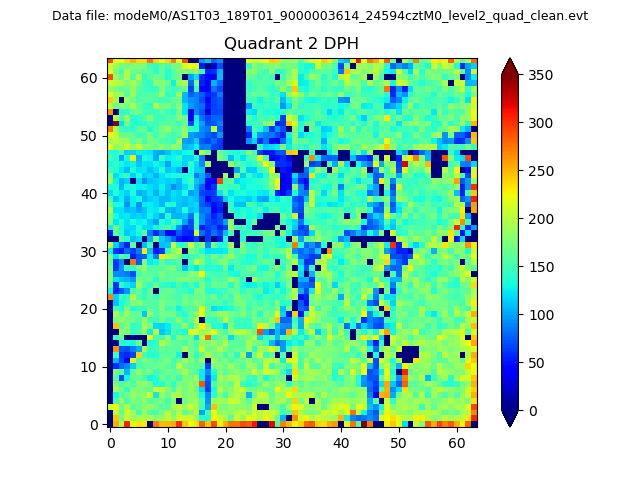
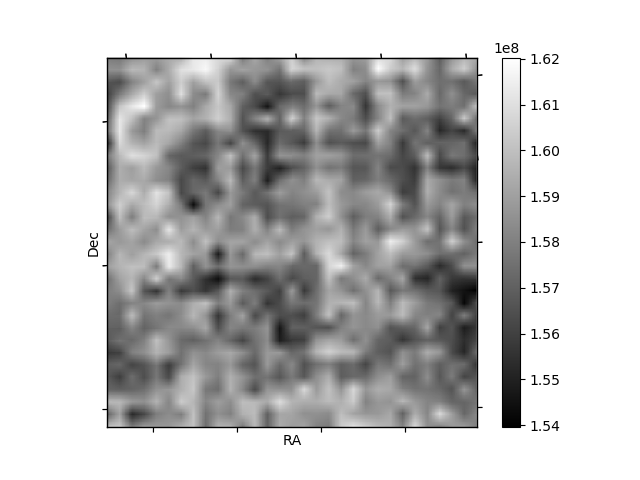
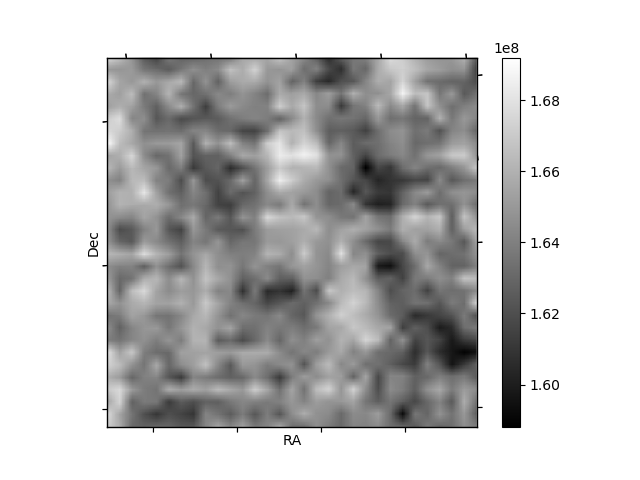
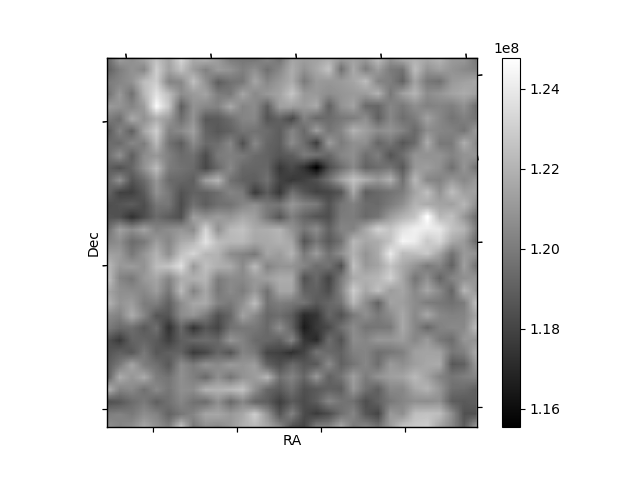
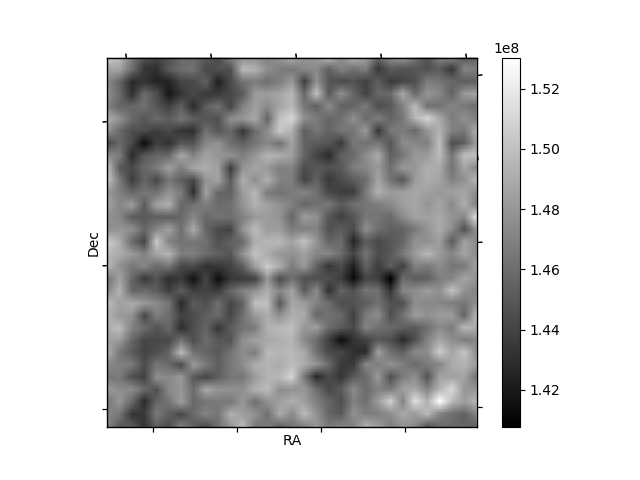
Histogram calculated using DETX and DETY for each event in the final _common_clean file
| Quadrant A | 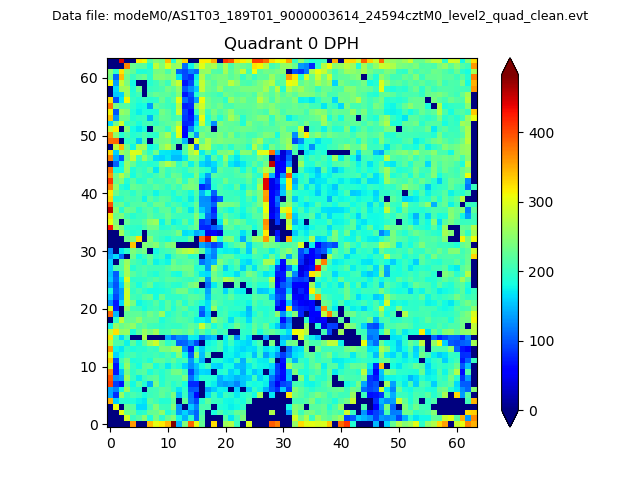 |
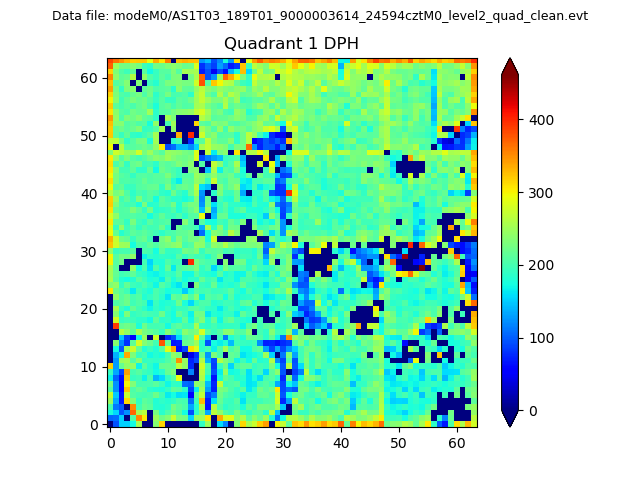 |
Quadrant B |
|---|---|---|---|
| Quadrant D | 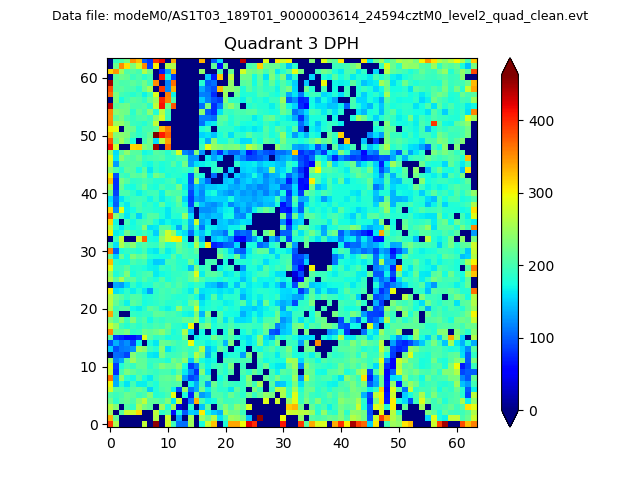 |
 |
Quadrant C |
| Plot type | Count rate plots | Images |
|---|---|---|
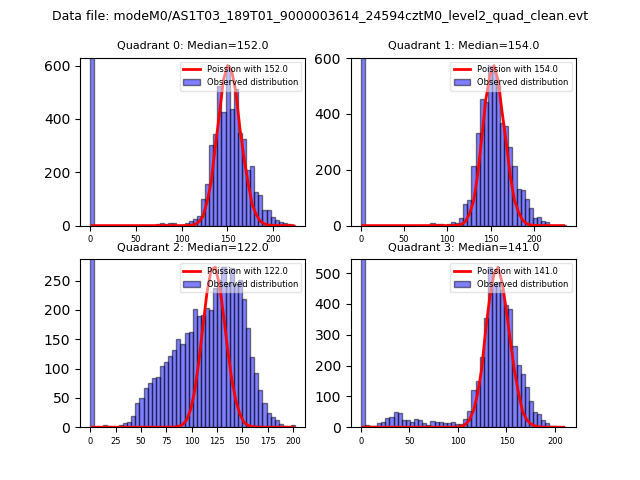
| Comparison with Poisson distribution Blue bars denote a histogram of data divided into 1 sec bins. Red curve is a Poisson curve with rate = median count rate of data. |
 |
 |
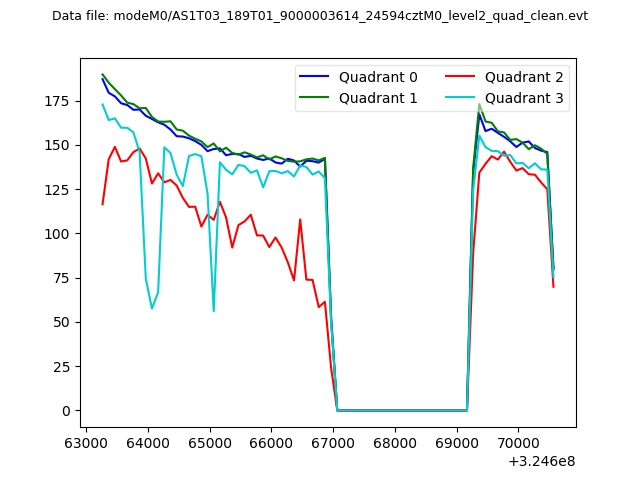
| Quadrant-wise count rates Data is divided into 100 sec bins |
 |
|
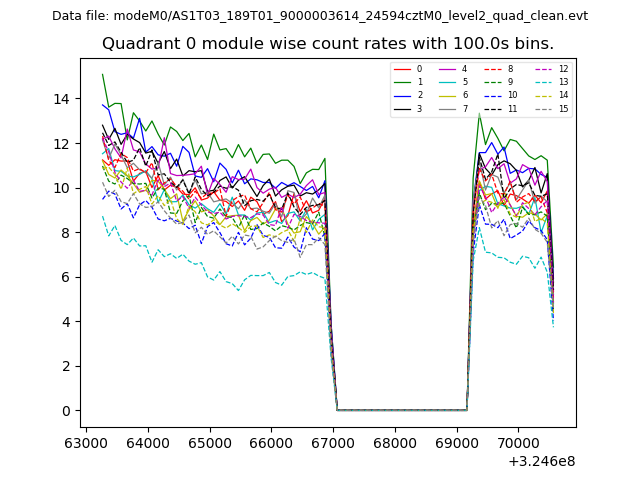
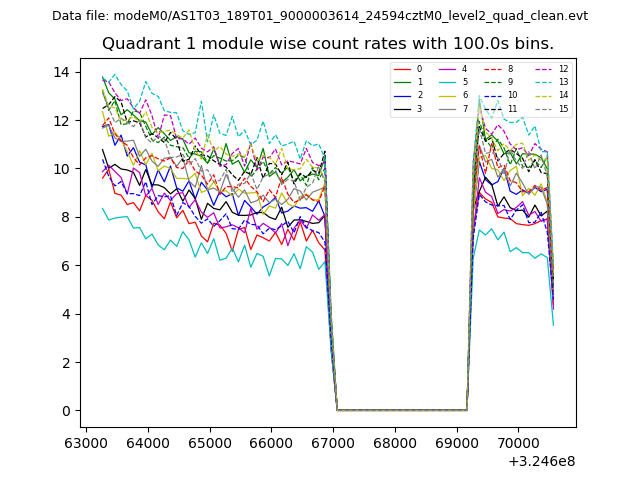
| Module-wise count rates for Quadrant A Data is divided into 100 sec bins |
 |
 |
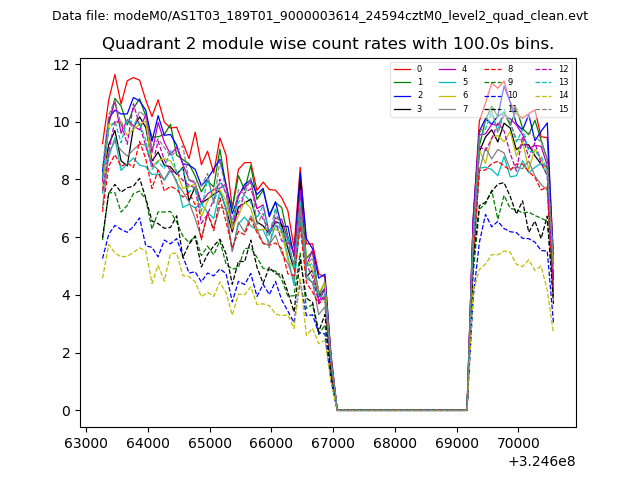
| Module-wise count rates for Quadrant B Data is divided into 100 sec bins |
 |
 |
| Module-wise count rates for Quadrant C Data is divided into 100 sec bins |
 |
 |
| Module-wise count rates for Quadrant D Data is divided into 100 sec bins |
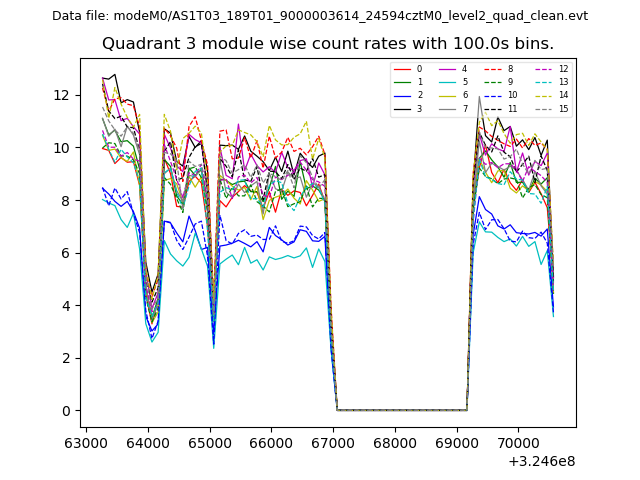 |
 |
| Parameter | Plot |
|---|---|
| CZT HV Monitor | 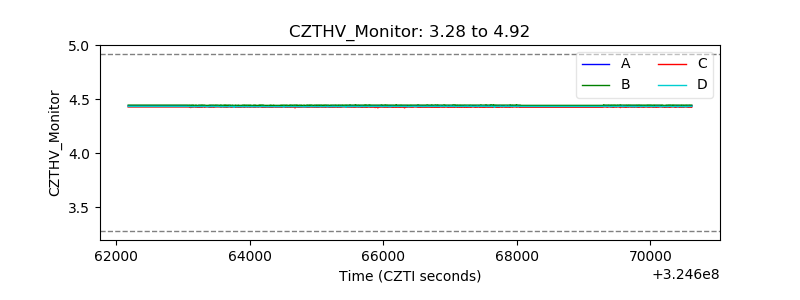 |
| D_VDD | 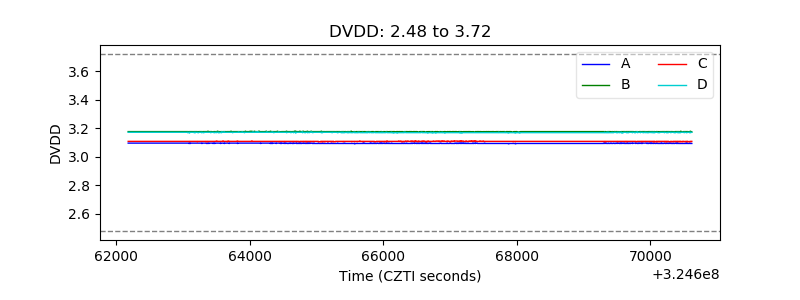 |
| Temperature 1 | 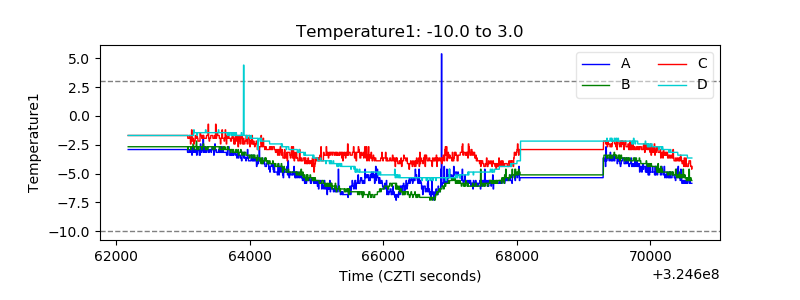 |
| Veto HV Monitor | 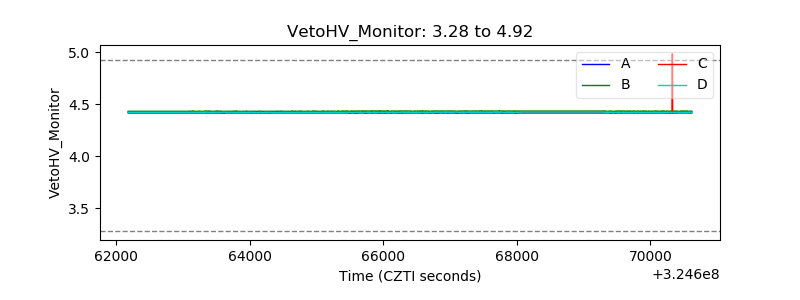 |
| Veto LLD | 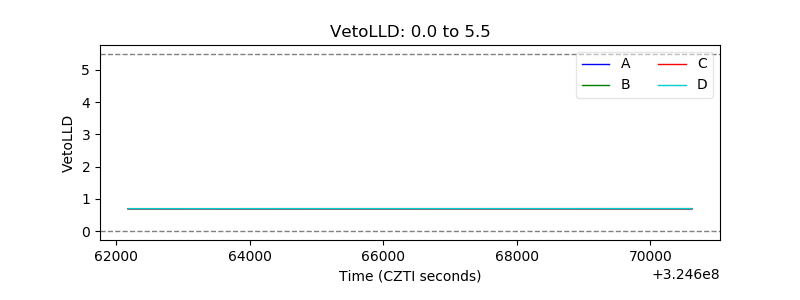 |
| Alpha Counter | 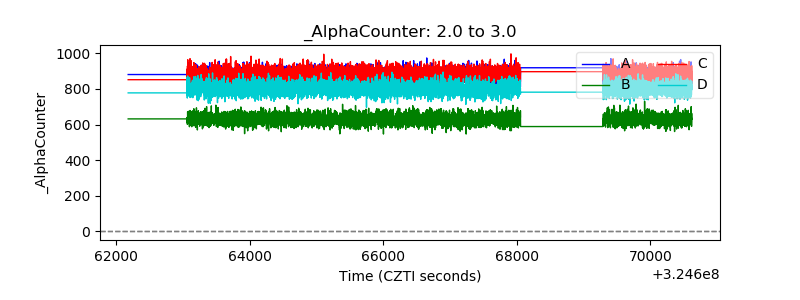 |
| _CPM_Rate | 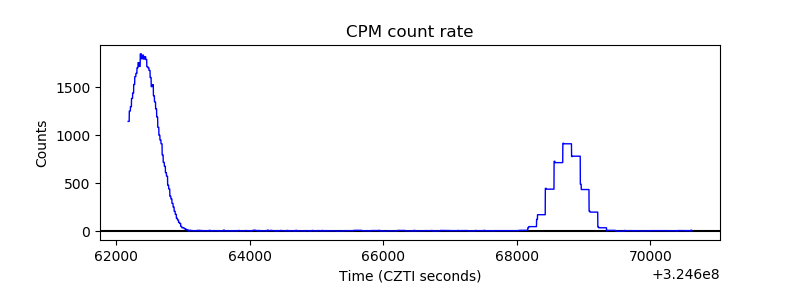 |
| CZT Counter | 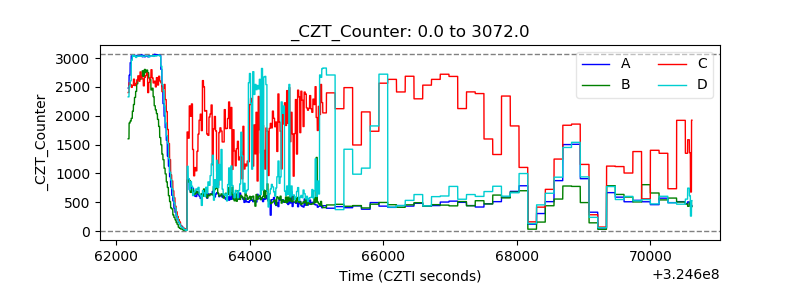 |
| +2.5 Volts monitor |  |
| +5 Volts monitor |  |
| _ROLL_ROT | 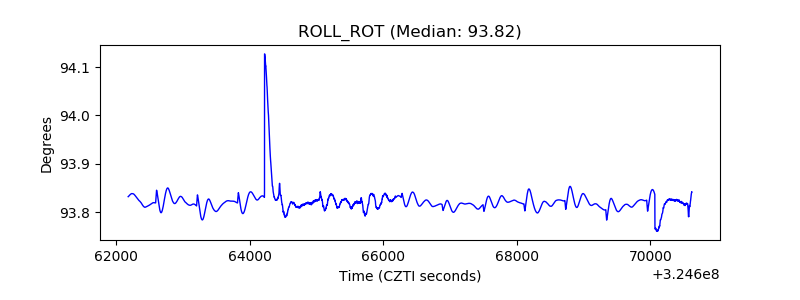 |
| _Roll_DEC | 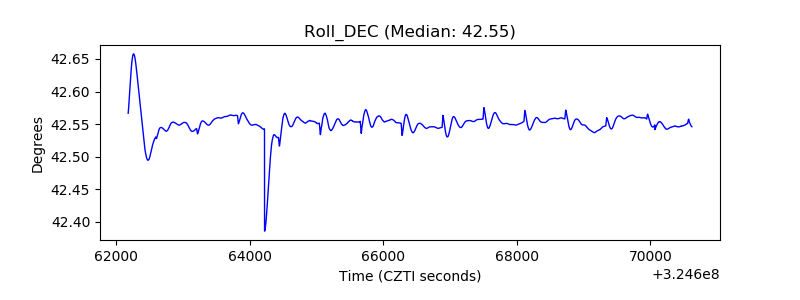 |
| _Roll_RA | 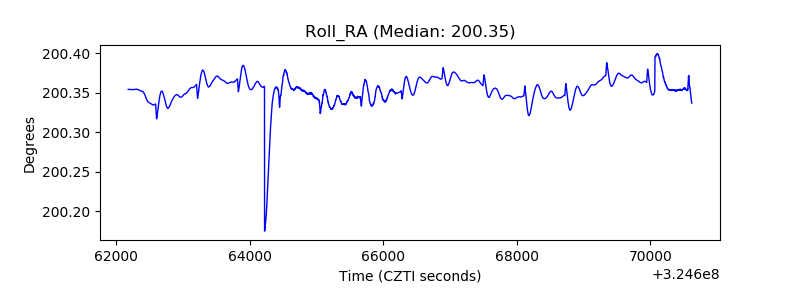 |
| Veto Counter | 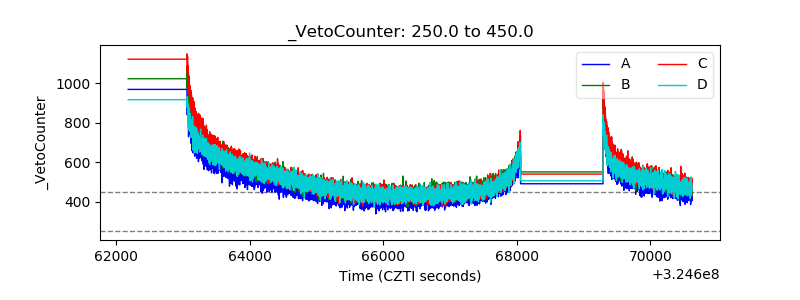 |