| Param | Original file | Final file |
|---|---|---|
| Filename | modeM0/AS1T03_189T01_9000003614_24595cztM0_level2.evt | modeM0/AS1T03_189T01_9000003614_24595cztM0_level2_quad_clean.evt |
| Size (bytes) | 652,037,760 | 104,607,360 |
| Size | 621.8 MB | 99.8 MB |
| Events in quadrant A | 3,425,684 | 701,620 |
| Events in quadrant B | 3,535,696 | 709,958 |
| Events in quadrant C | 6,986,404 | 640,432 |
| Events in quadrant D | 5,334,104 | 636,825 |
| Mode M9 | |||
|---|---|---|---|
| Quadrant | BADHDUFLAG | Total packets | Discarded packets |
| A | 0 | 22 | 0 |
| B | 0 | 22 | 0 |
| C | 0 | 22 | 0 |
| D | 0 | 22 | 0 |
| Mode M0 | |||
|---|---|---|---|
| Quadrant | BADHDUFLAG | Total packets | Discarded packets |
| A | 0 | 14541 | 2 |
| B | 0 | 14838 | 2 |
| C | 0 | 25368 | 2 |
| D | 0 | 20344 | 2 |
| Mode SS | |||
|---|---|---|---|
| Quadrant | BADHDUFLAG | Total packets | Discarded packets |
| A | 0 | 140 | 0 |
| B | 0 | 140 | 0 |
| C | 0 | 140 | 0 |
| D | 0 | 140 | 0 |
| Quadrant | Total seconds | Saturated seconds | Saturation percentage |
|---|---|---|---|
| A | 6878 | 96 | 1.395755% |
| B | 6878 | 129 | 1.875545% |
| C | 6878 | 846 | 12.300087% |
| D | 6878 | 757 | 11.006106% |
Noise dominated data is calculated using 1-second bins in cleaned event files. If a bin has >2000 counts, and if more than 50% of those come from <1% of pixels, then it is considered to be noise-dominated and hence unusable.
| Quadrant | # 1 sec bins | Bins with >0 counts | Bins with >2000 counts | High rate bins dominated by noise | Noise dominated (total time) | Noise dominated (detector-on time) | Marked lightcurve |
|---|---|---|---|---|---|---|---|
| A | 9043 | 6880 | 1 | 1 | 0.01% | 0.01% | 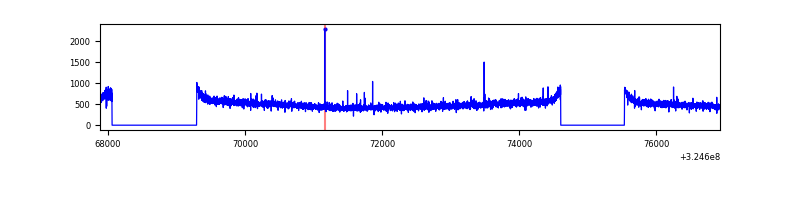 |
| B | 9043 | 6880 | 2 | 2 | 0.02% | 0.03% | 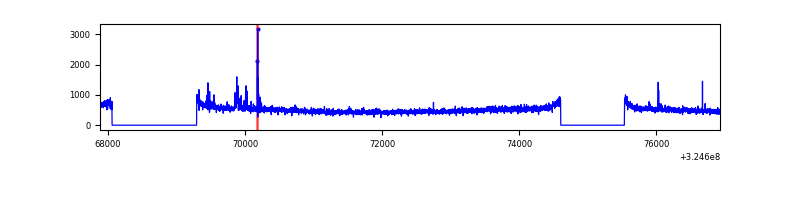 |
| C | 9043 | 6880 | 375 | 375 | 4.15% | 5.45% | 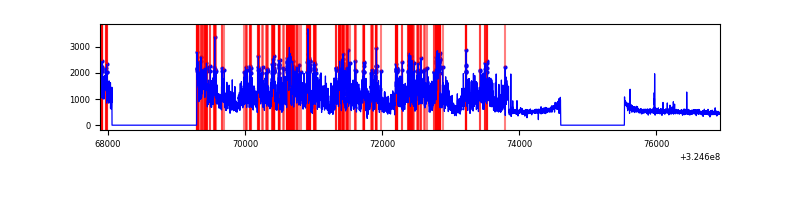 |
| D | 9043 | 6880 | 562 | 562 | 6.21% | 8.17% |  |
Top three noisy pixels from each quadrant. If the there are fewer than three noisy pixels in the level2.evt file, extra rows are filled as -1
| Pixel properties | Quadrant properties | ||||||
|---|---|---|---|---|---|---|---|
| Quadrant | DetID | PixID | Counts | Sigma | Mean | Median | Sigma |
| A | 10 | 255 | 11276 | 58.74 | 886 | 867 | 177.2 |
| A | 13 | 254 | 10423 | 53.93 | 886 | 867 | 177.2 |
| A | 3 | 137 | 7921 | 39.81 | 886 | 867 | 177.2 |
| B | 0 | 190 | 62977 | 370.85 | 881 | 857 | 167.5 |
| B | 7 | 202 | 24095 | 138.73 | 881 | 857 | 167.5 |
| B | 12 | 111 | 20417 | 116.77 | 881 | 857 | 167.5 |
| C | 7 | 247 | 3517390 | 18232.9 | 830 | 834 | 192.9 |
| C | 14 | 238 | 131046 | 675.13 | 830 | 834 | 192.9 |
| C | 2 | 16 | 58714 | 300.1 | 830 | 834 | 192.9 |
| D | 1 | 52 | 1966321 | 9930.45 | 826 | 804 | 197.9 |
| D | 8 | 195 | 171720 | 863.52 | 826 | 804 | 197.9 |
| D | 1 | 255 | 69190 | 345.51 | 826 | 804 | 197.9 |
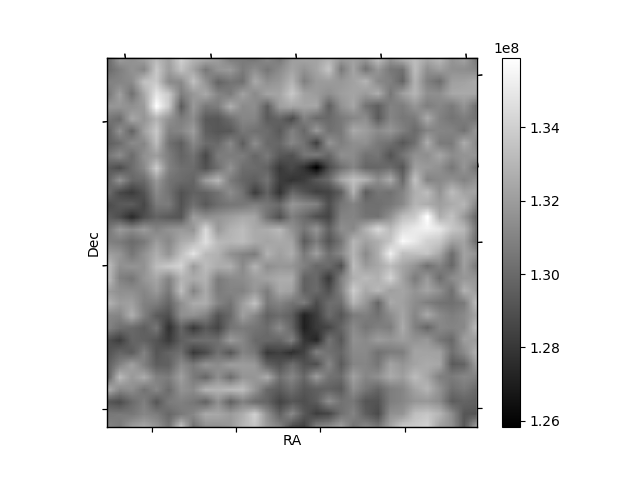
Histogram calculated using DETX and DETY for each event in the final _common_clean file
| Quadrant A |  |
 |
Quadrant B |
|---|---|---|---|
| Quadrant D | 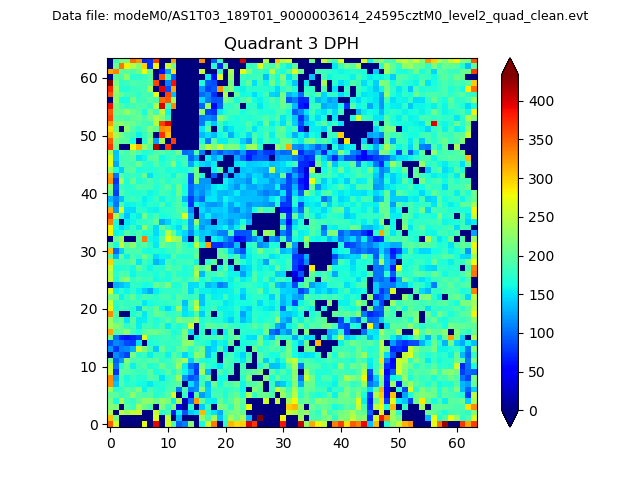 |
 |
Quadrant C |
| Plot type | Count rate plots | Images |
|---|---|---|
| Comparison with Poisson distribution Blue bars denote a histogram of data divided into 1 sec bins. Red curve is a Poisson curve with rate = median count rate of data. |
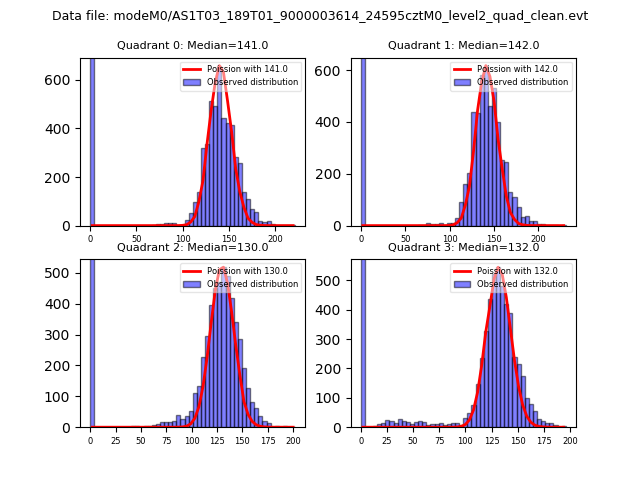 |
 |
| Quadrant-wise count rates Data is divided into 100 sec bins |
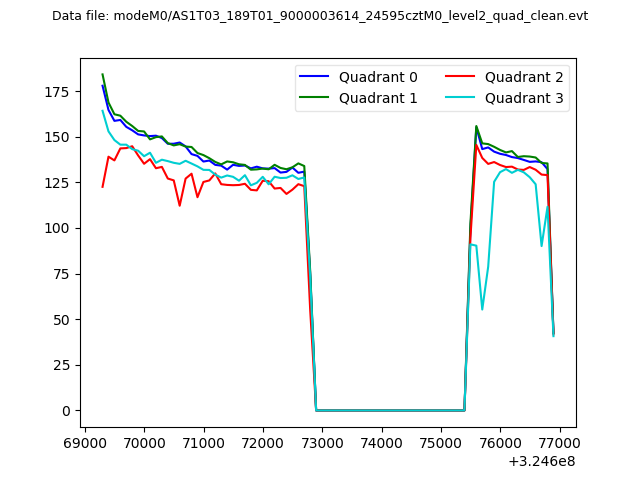 |
|
| Module-wise count rates for Quadrant A Data is divided into 100 sec bins |
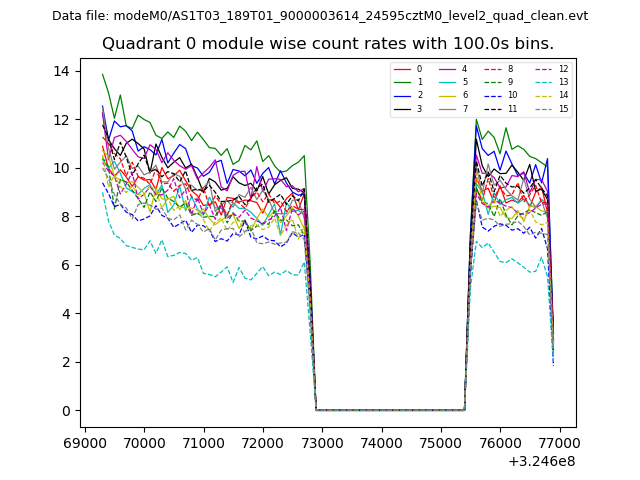 |
 |
| Module-wise count rates for Quadrant B Data is divided into 100 sec bins |
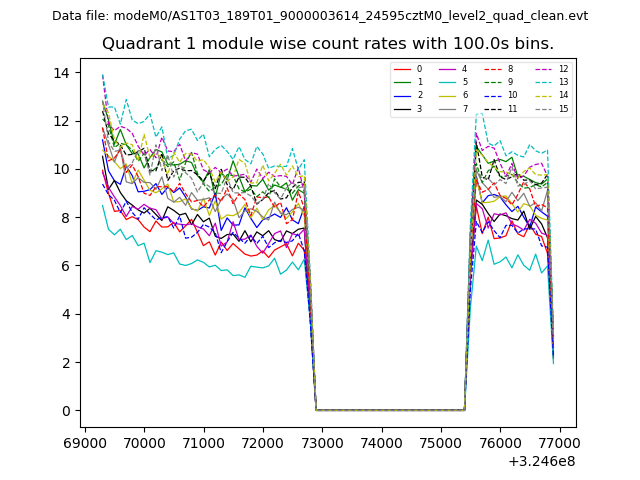 |
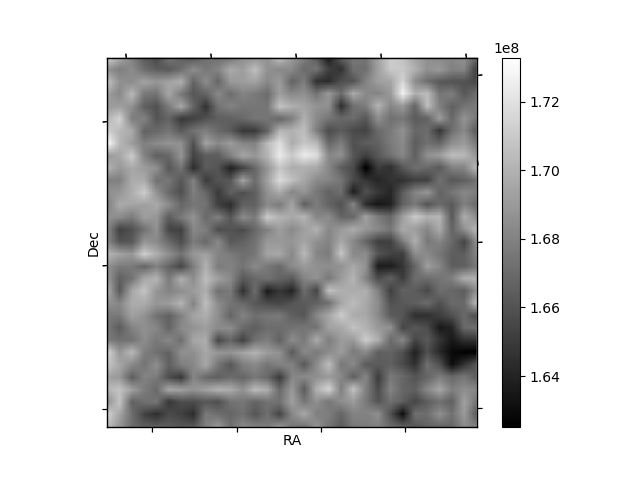 |
| Module-wise count rates for Quadrant C Data is divided into 100 sec bins |
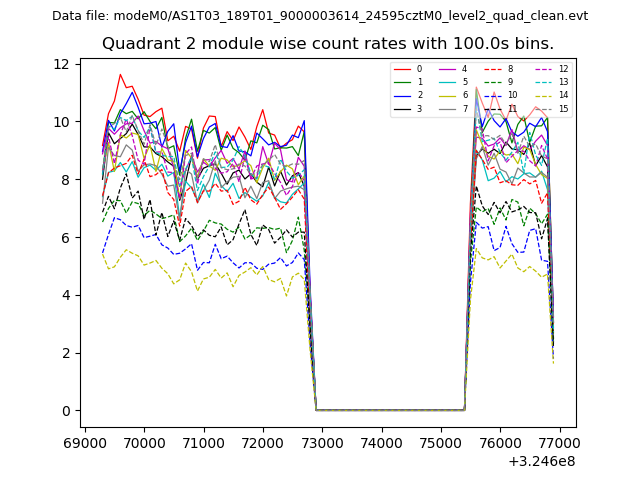 |
 |
| Module-wise count rates for Quadrant D Data is divided into 100 sec bins |
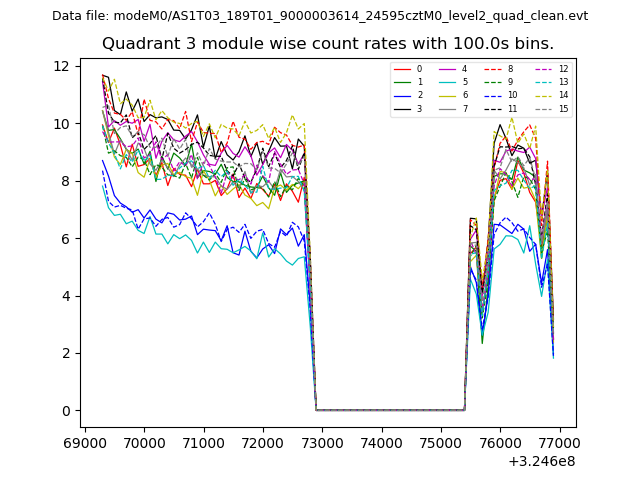 |
 |
| Parameter | Plot |
|---|---|
| CZT HV Monitor | 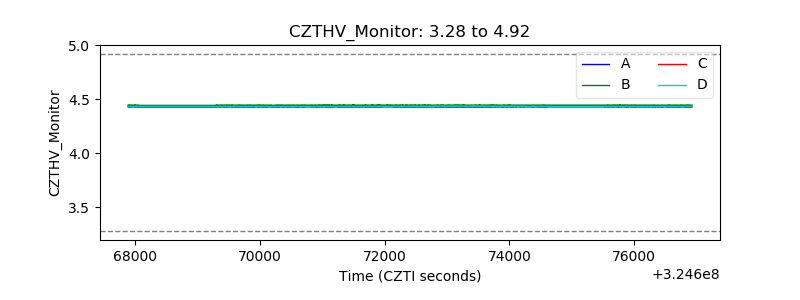 |
| D_VDD | 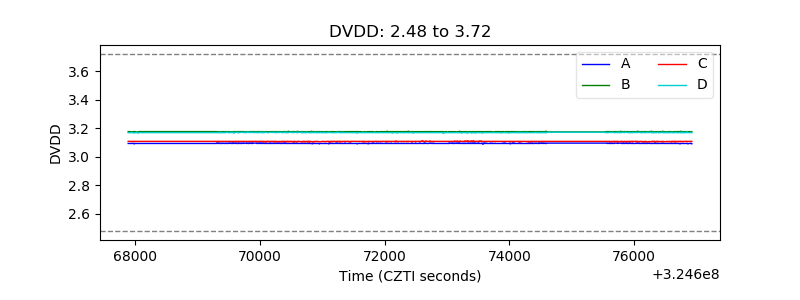 |
| Temperature 1 | 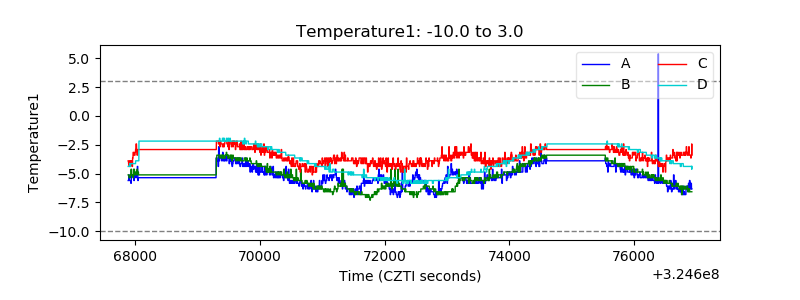 |
| Veto HV Monitor | 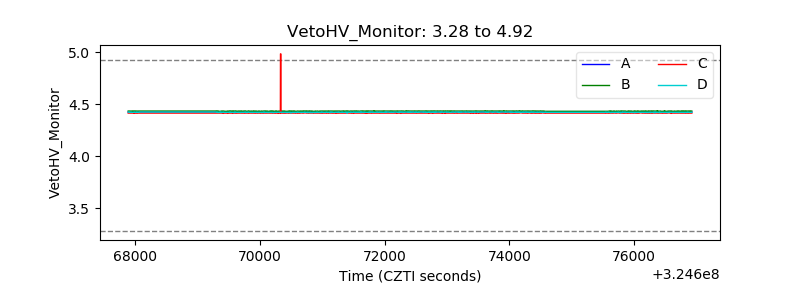 |
| Veto LLD | 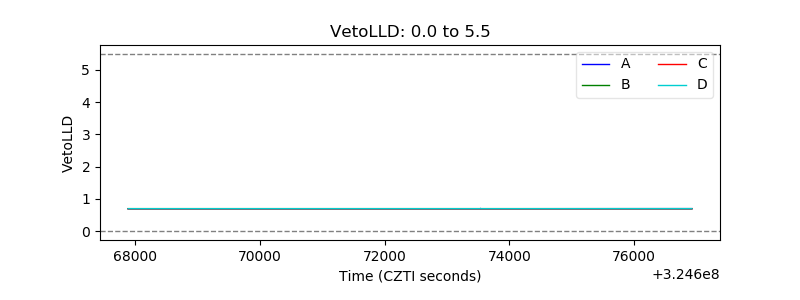 |
| Alpha Counter | 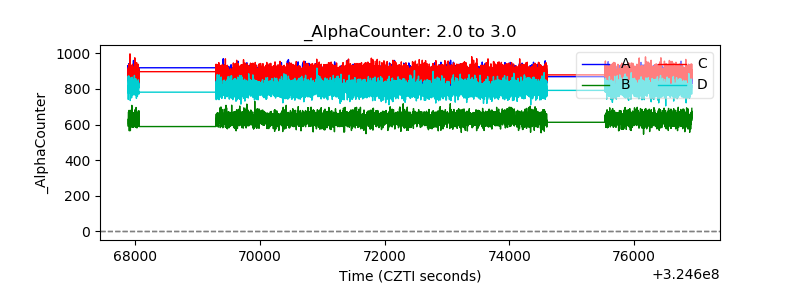 |
| _CPM_Rate | 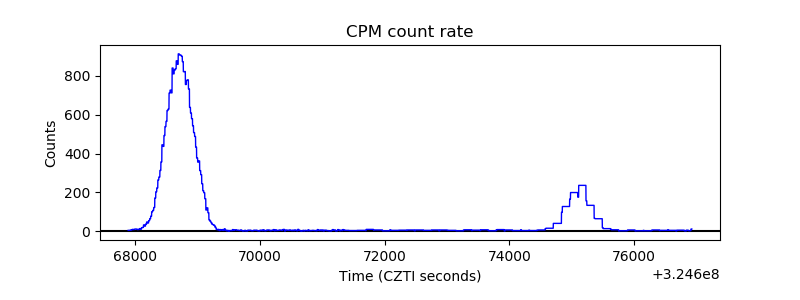 |
| CZT Counter |  |
| +2.5 Volts monitor |  |
| +5 Volts monitor |  |
| _ROLL_ROT | 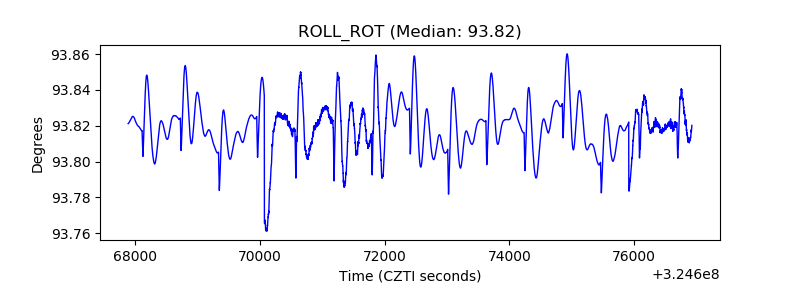 |
| _Roll_DEC | 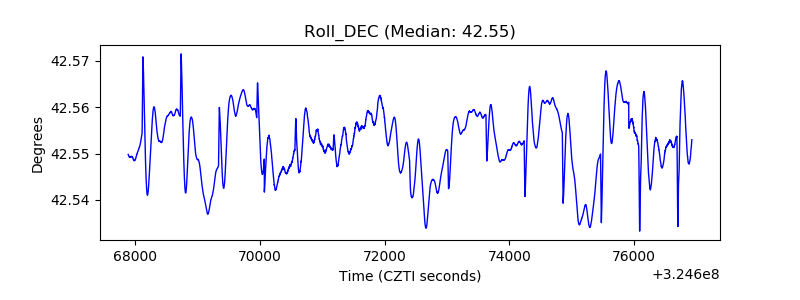 |
| _Roll_RA | 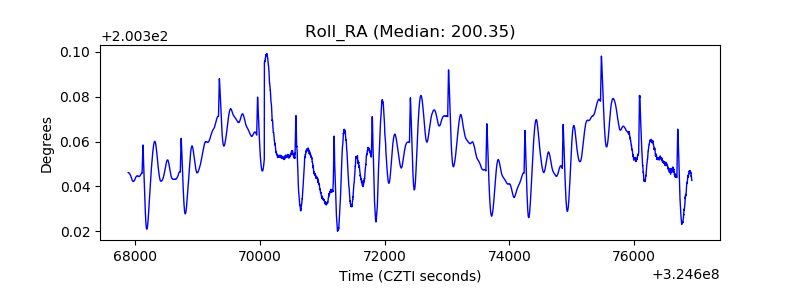 |
| Veto Counter | 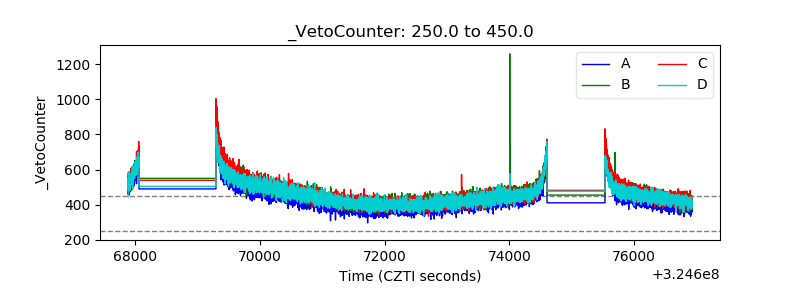 |