| Param | Original file | Final file |
|---|---|---|
| Filename | modeM0/AS1T03_189T01_9000003614_24596cztM0_level2.evt | modeM0/AS1T03_189T01_9000003614_24596cztM0_level2_quad_clean.evt |
| Size (bytes) | 550,765,440 | 105,747,840 |
| Size | 525.3 MB | 100.8 MB |
| Events in quadrant A | 3,563,583 | 693,264 |
| Events in quadrant B | 3,640,166 | 702,350 |
| Events in quadrant C | 3,924,329 | 668,479 |
| Events in quadrant D | 5,052,731 | 626,487 |
| Mode M9 | |||
|---|---|---|---|
| Quadrant | BADHDUFLAG | Total packets | Discarded packets |
| A | 0 | 14 | 0 |
| B | 0 | 14 | 0 |
| C | 0 | 14 | 0 |
| D | 0 | 14 | 0 |
| Mode M0 | |||
|---|---|---|---|
| Quadrant | BADHDUFLAG | Total packets | Discarded packets |
| A | 0 | 15432 | 2 |
| B | 0 | 15530 | 2 |
| C | 0 | 16260 | 2 |
| D | 0 | 20033 | 2 |
| Mode SS | |||
|---|---|---|---|
| Quadrant | BADHDUFLAG | Total packets | Discarded packets |
| A | 0 | 150 | 0 |
| B | 0 | 150 | 0 |
| C | 0 | 150 | 0 |
| D | 0 | 150 | 0 |
| Quadrant | Total seconds | Saturated seconds | Saturation percentage |
|---|---|---|---|
| A | 7358 | 65 | 0.883392% |
| B | 7359 | 94 | 1.277347% |
| C | 7358 | 167 | 2.269638% |
| D | 7358 | 539 | 7.325360% |
Noise dominated data is calculated using 1-second bins in cleaned event files. If a bin has >2000 counts, and if more than 50% of those come from <1% of pixels, then it is considered to be noise-dominated and hence unusable.
| Quadrant | # 1 sec bins | Bins with >0 counts | Bins with >2000 counts | High rate bins dominated by noise | Noise dominated (total time) | Noise dominated (detector-on time) | Marked lightcurve |
|---|---|---|---|---|---|---|---|
| A | 8748 | 7360 | 0 | 0 | 0.00% | 0.00% | 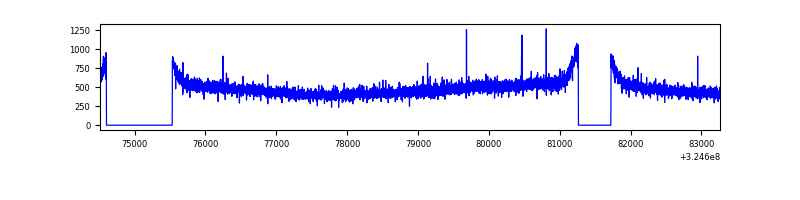 |
| B | 8749 | 7361 | 0 | 0 | 0.00% | 0.00% | 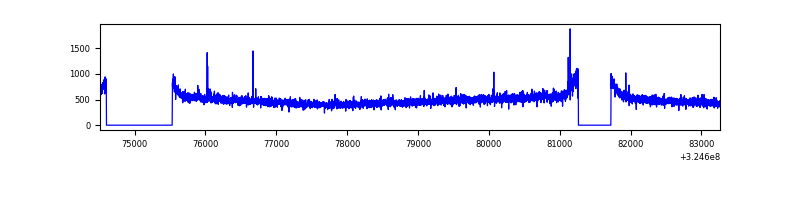 |
| C | 8748 | 7360 | 10 | 10 | 0.11% | 0.14% | 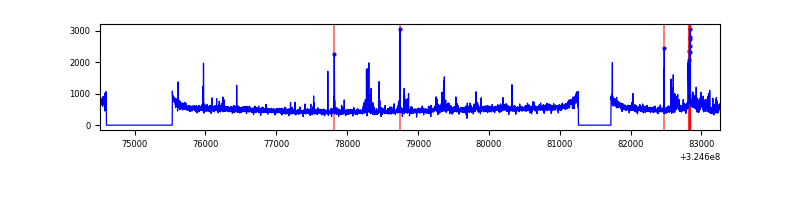 |
| D | 8748 | 7360 | 454 | 454 | 5.19% | 6.17% | 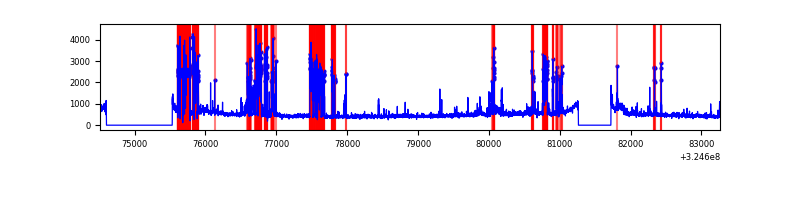 |
Top three noisy pixels from each quadrant. If the there are fewer than three noisy pixels in the level2.evt file, extra rows are filled as -1
| Pixel properties | Quadrant properties | ||||||
|---|---|---|---|---|---|---|---|
| Quadrant | DetID | PixID | Counts | Sigma | Mean | Median | Sigma |
| A | 13 | 254 | 10975 | 54.25 | 921 | 902 | 185.7 |
| A | 3 | 137 | 8511 | 40.98 | 921 | 902 | 185.7 |
| A | 0 | 226 | 7864 | 37.49 | 921 | 902 | 185.7 |
| B | 7 | 202 | 23612 | 128.09 | 917 | 894 | 177.4 |
| B | 12 | 111 | 21922 | 118.56 | 917 | 894 | 177.4 |
| B | 11 | 111 | 19958 | 107.49 | 917 | 894 | 177.4 |
| C | 10 | 9 | 150652 | 718.03 | 889 | 895 | 208.6 |
| C | 14 | 238 | 140924 | 671.39 | 889 | 895 | 208.6 |
| C | 7 | 247 | 81597 | 386.94 | 889 | 895 | 208.6 |
| D | 1 | 52 | 1613032 | 7552.29 | 873 | 846 | 213.5 |
| D | 8 | 195 | 101904 | 473.41 | 873 | 846 | 213.5 |
| D | 2 | 234 | 31917 | 145.55 | 873 | 846 | 213.5 |
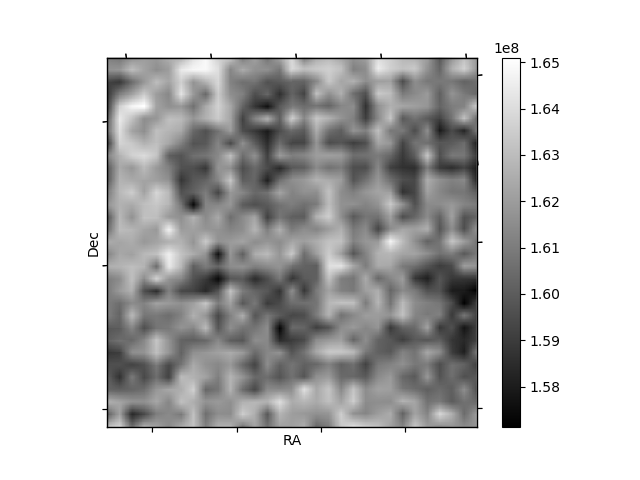
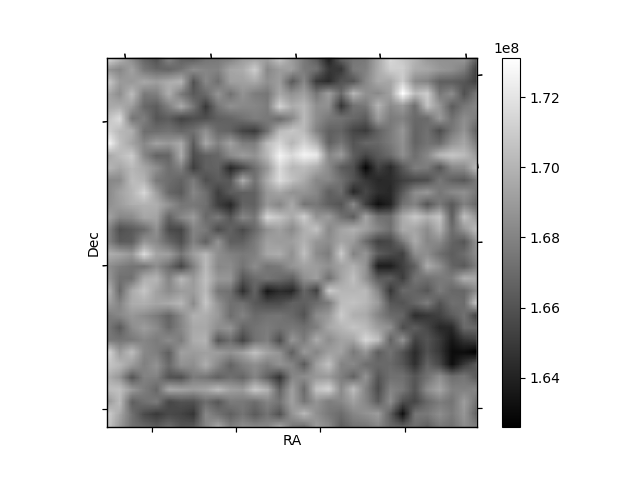
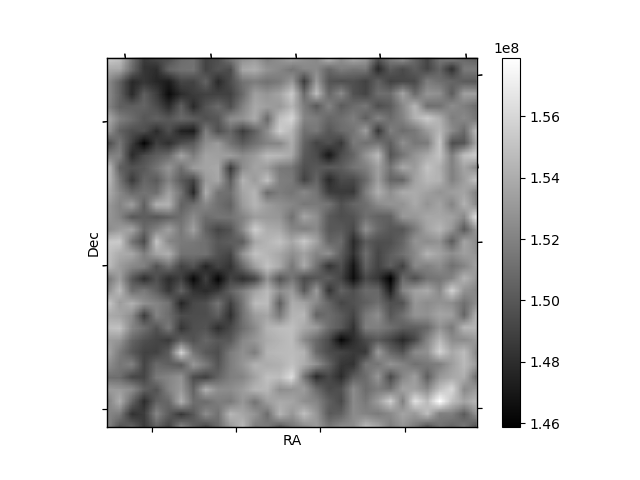
Histogram calculated using DETX and DETY for each event in the final _common_clean file
| Quadrant A | 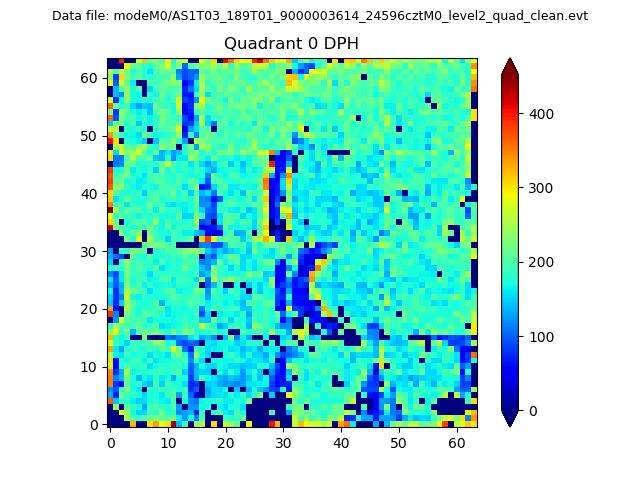 |
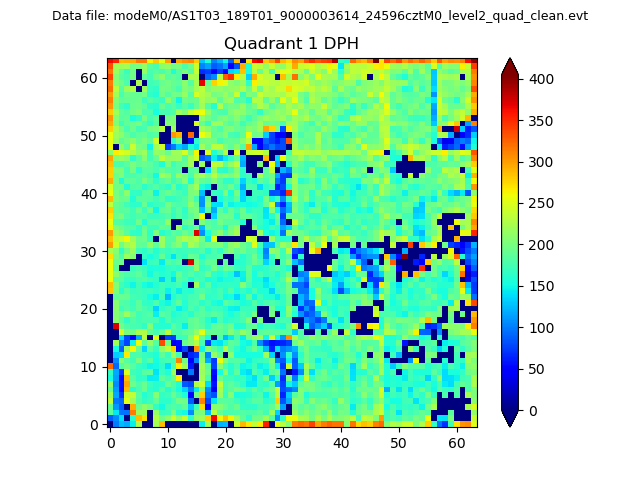 |
Quadrant B |
|---|---|---|---|
| Quadrant D | 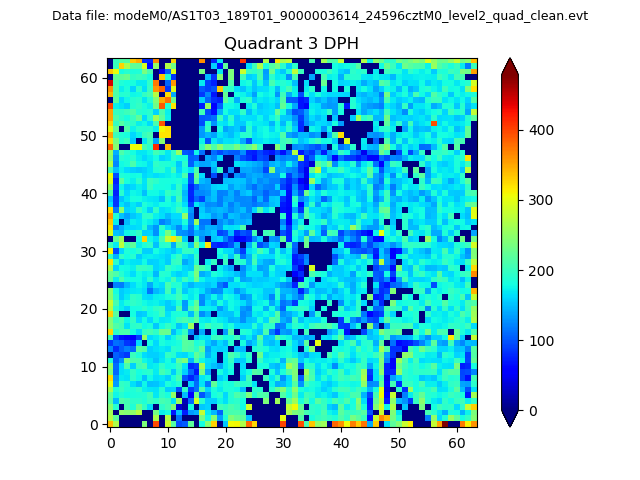 |
 |
Quadrant C |
| Plot type | Count rate plots | Images |
|---|---|---|
| Comparison with Poisson distribution Blue bars denote a histogram of data divided into 1 sec bins. Red curve is a Poisson curve with rate = median count rate of data. |
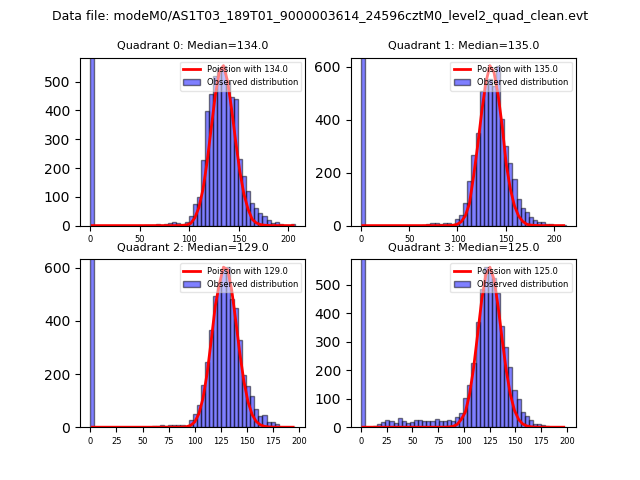 |
 |
| Quadrant-wise count rates Data is divided into 100 sec bins |
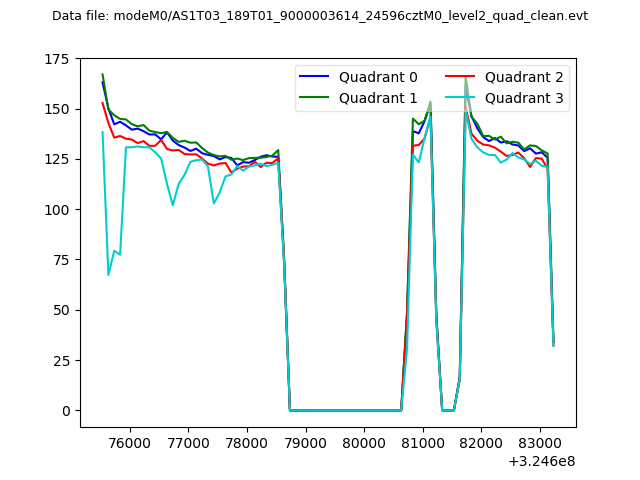 |
|
| Module-wise count rates for Quadrant A Data is divided into 100 sec bins |
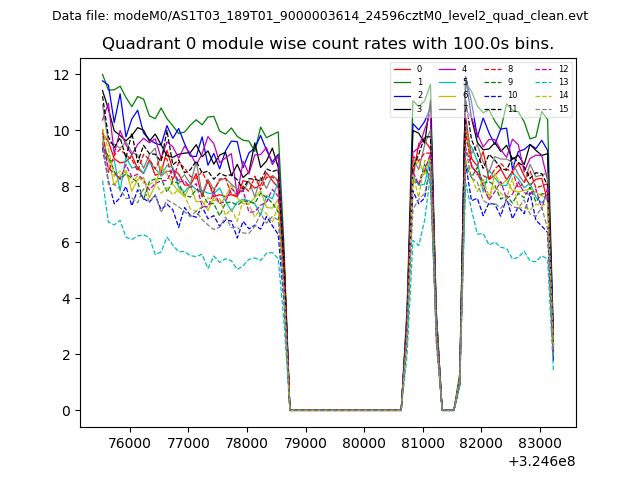 |
 |
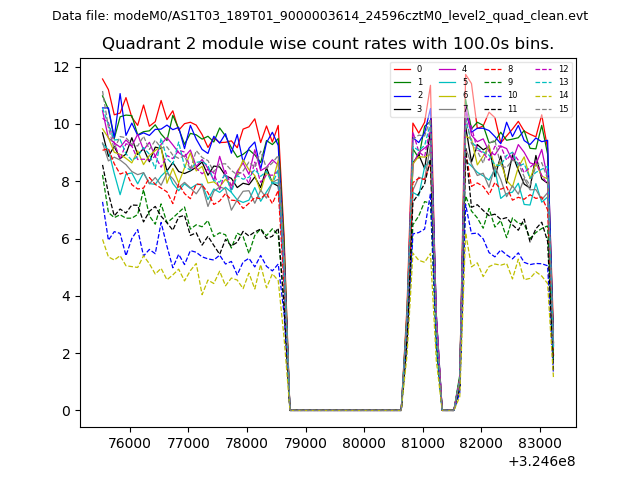
| Module-wise count rates for Quadrant B Data is divided into 100 sec bins |
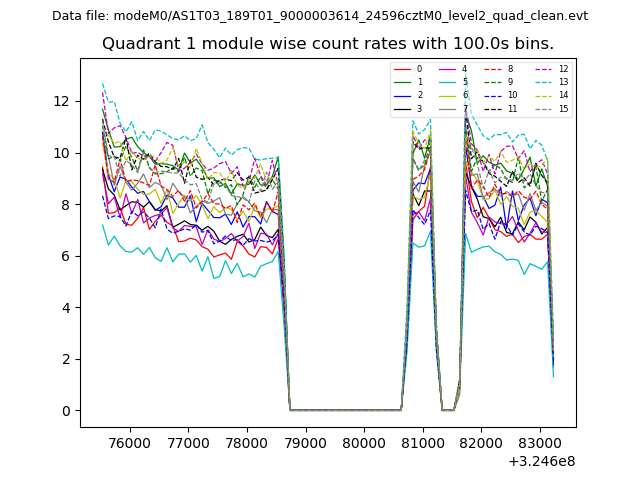 |
 |
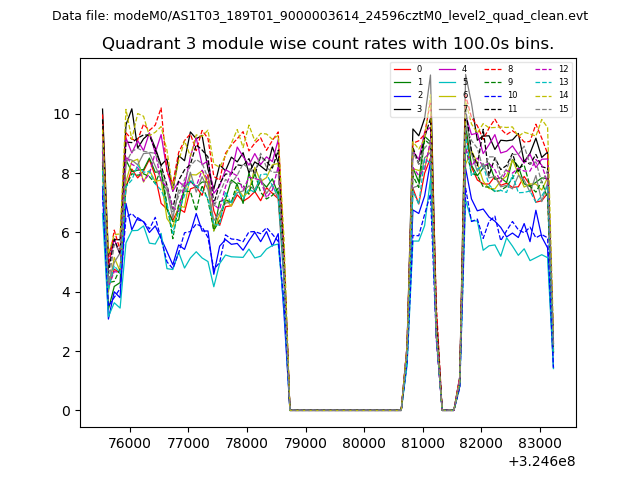
| Module-wise count rates for Quadrant C Data is divided into 100 sec bins |
 |
 |
| Module-wise count rates for Quadrant D Data is divided into 100 sec bins |
 |
 |
| Parameter | Plot |
|---|---|
| CZT HV Monitor | 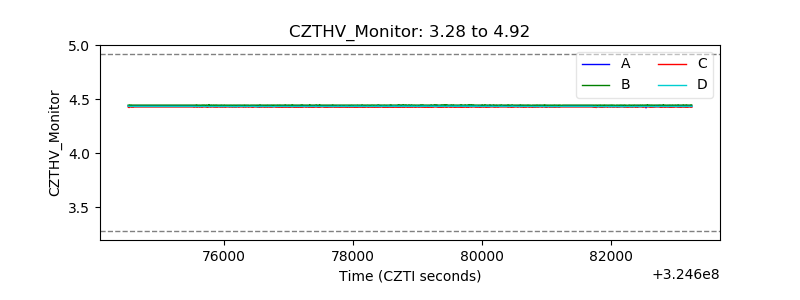 |
| D_VDD | 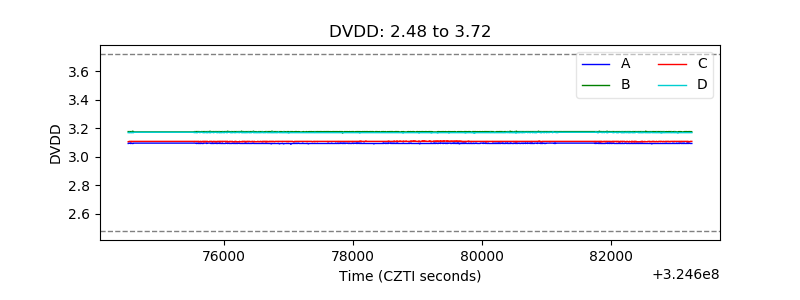 |
| Temperature 1 | 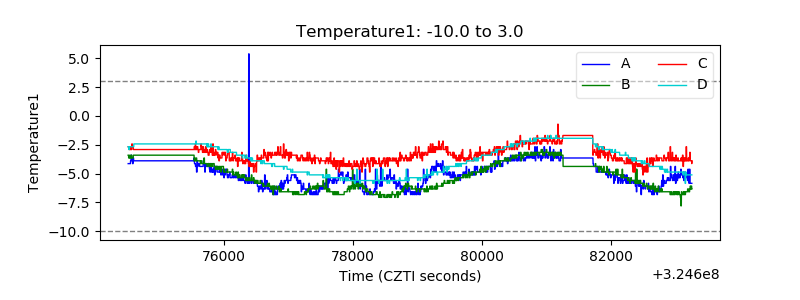 |
| Veto HV Monitor | 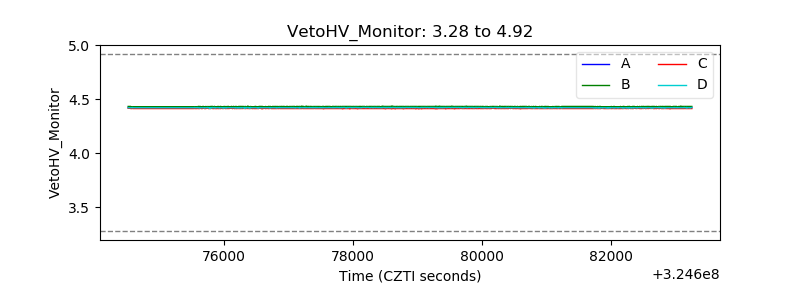 |
| Veto LLD | 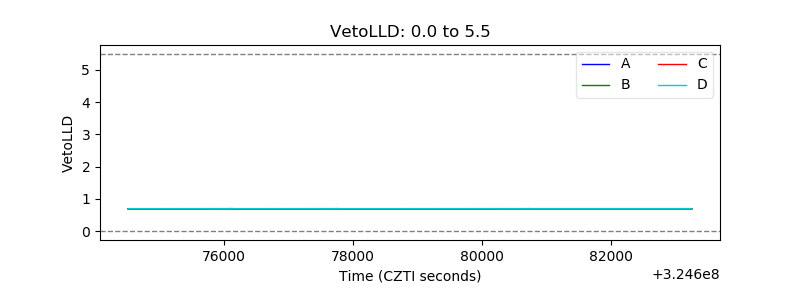 |
| Alpha Counter | 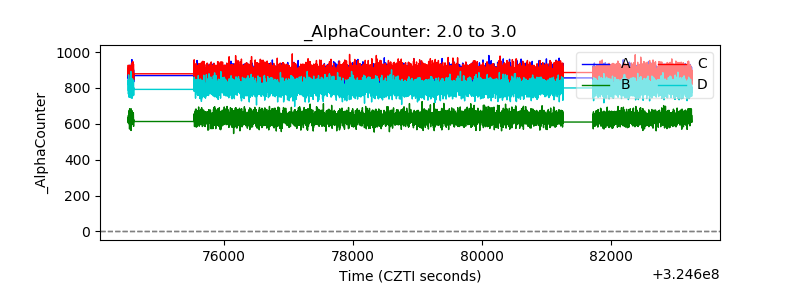 |
| _CPM_Rate | 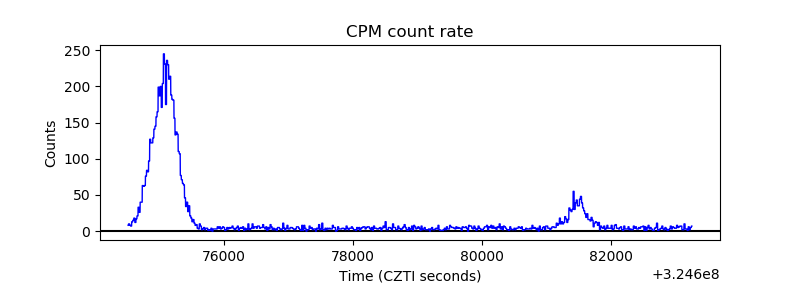 |
| CZT Counter | 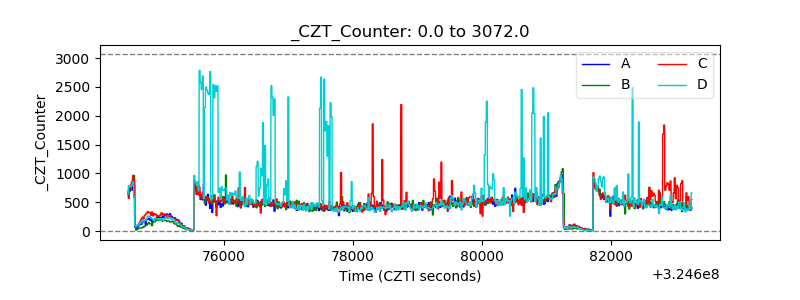 |
| +2.5 Volts monitor |  |
| +5 Volts monitor |  |
| _ROLL_ROT | 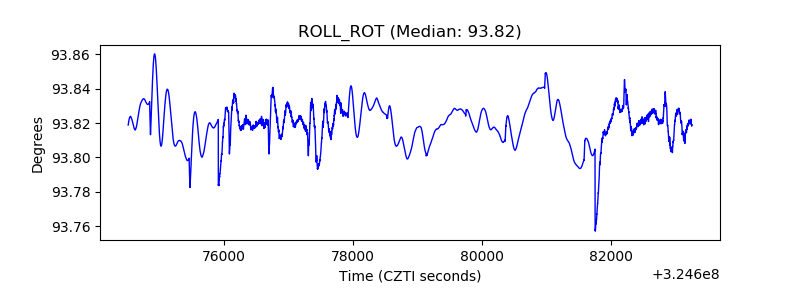 |
| _Roll_DEC | 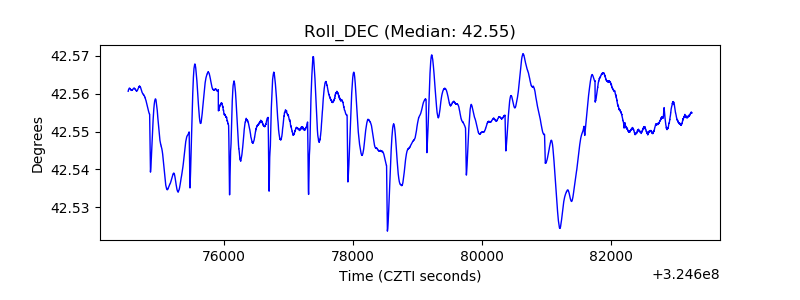 |
| _Roll_RA |  |
| Veto Counter | 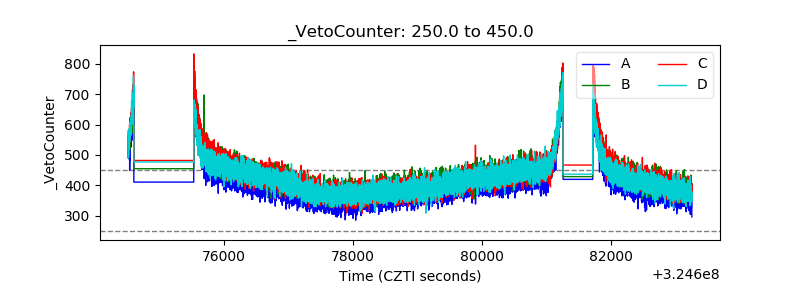 |