| Param | Original file | Final file |
|---|---|---|
| Filename | modeM0/AS1T03_189T01_9000003614_24600cztM0_level2.evt | modeM0/AS1T03_189T01_9000003614_24600cztM0_level2_quad_clean.evt |
| Size (bytes) | 746,357,760 | 143,187,840 |
| Size | 711.8 MB | 136.6 MB |
| Events in quadrant A | 5,162,610 | 905,431 |
| Events in quadrant B | 5,263,227 | 915,500 |
| Events in quadrant C | 5,365,580 | 877,104 |
| Events in quadrant D | 6,052,470 | 862,705 |
| Mode M9 | |||
|---|---|---|---|
| Quadrant | BADHDUFLAG | Total packets | Discarded packets |
| A | 0 | 5 | 0 |
| B | 0 | 5 | 0 |
| C | 0 | 5 | 0 |
| D | 0 | 5 | 0 |
| Mode M0 | |||
|---|---|---|---|
| Quadrant | BADHDUFLAG | Total packets | Discarded packets |
| A | 0 | 22719 | 1 |
| B | 0 | 22817 | 1 |
| C | 0 | 23313 | 1 |
| D | 0 | 25551 | 1 |
| Mode SS | |||
|---|---|---|---|
| Quadrant | BADHDUFLAG | Total packets | Discarded packets |
| A | 0 | 226 | 0 |
| B | 0 | 226 | 0 |
| C | 0 | 226 | 0 |
| D | 0 | 226 | 0 |
| Quadrant | Total seconds | Saturated seconds | Saturation percentage |
|---|---|---|---|
| A | 11211 | 39 | 0.347873% |
| B | 11211 | 61 | 0.544108% |
| C | 11211 | 121 | 1.079297% |
| D | 11211 | 153 | 1.364731% |
Noise dominated data is calculated using 1-second bins in cleaned event files. If a bin has >2000 counts, and if more than 50% of those come from <1% of pixels, then it is considered to be noise-dominated and hence unusable.
| Quadrant | # 1 sec bins | Bins with >0 counts | Bins with >2000 counts | High rate bins dominated by noise | Noise dominated (total time) | Noise dominated (detector-on time) | Marked lightcurve |
|---|---|---|---|---|---|---|---|
| A | 11671 | 11212 | 0 | 0 | 0.00% | 0.00% | 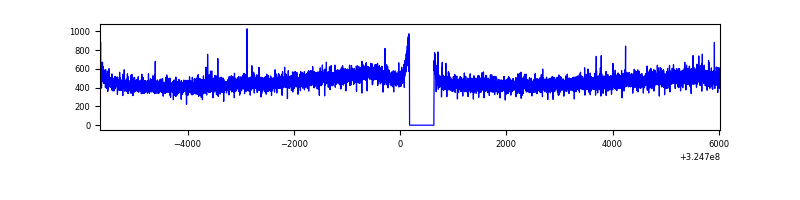 |
| B | 11671 | 11212 | 1 | 1 | 0.01% | 0.01% | 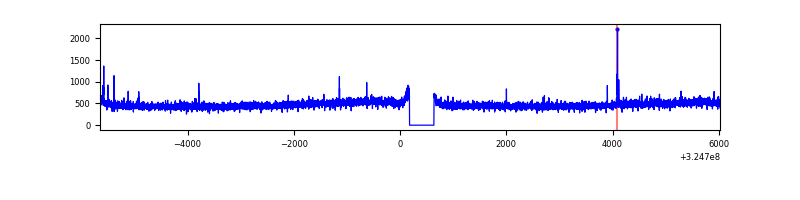 |
| C | 11671 | 11212 | 10 | 10 | 0.09% | 0.09% | 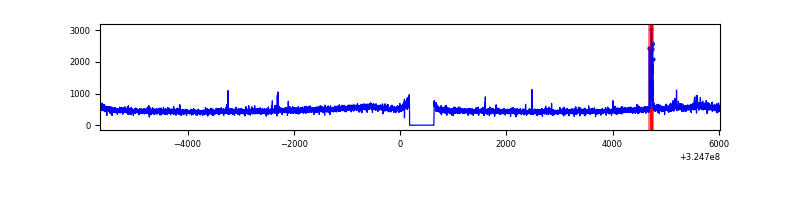 |
| D | 11671 | 11212 | 165 | 165 | 1.41% | 1.47% | 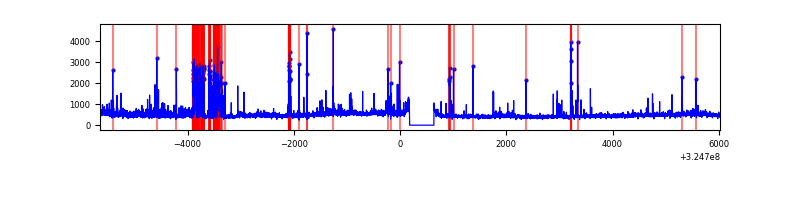 |
Top three noisy pixels from each quadrant. If the there are fewer than three noisy pixels in the level2.evt file, extra rows are filled as -1
| Pixel properties | Quadrant properties | ||||||
|---|---|---|---|---|---|---|---|
| Quadrant | DetID | PixID | Counts | Sigma | Mean | Median | Sigma |
| A | 13 | 254 | 14769 | 50.41 | 1333 | 1301 | 267.2 |
| A | 10 | 229 | 13341 | 45.07 | 1333 | 1301 | 267.2 |
| A | 3 | 137 | 12874 | 43.32 | 1333 | 1301 | 267.2 |
| B | 12 | 111 | 32456 | 122.8 | 1327 | 1290 | 253.8 |
| B | 7 | 202 | 30815 | 116.33 | 1327 | 1290 | 253.8 |
| B | 11 | 111 | 29057 | 109.41 | 1327 | 1290 | 253.8 |
| C | 14 | 238 | 202684 | 665.71 | 1285 | 1293 | 302.5 |
| C | 7 | 247 | 148468 | 486.5 | 1285 | 1293 | 302.5 |
| C | 13 | 61 | 8848 | 24.97 | 1285 | 1293 | 302.5 |
| D | 1 | 52 | 933628 | 2966.41 | 1293 | 1255 | 314.3 |
| D | 8 | 195 | 213396 | 674.94 | 1293 | 1255 | 314.3 |
| D | 2 | 234 | 49891 | 154.74 | 1293 | 1255 | 314.3 |
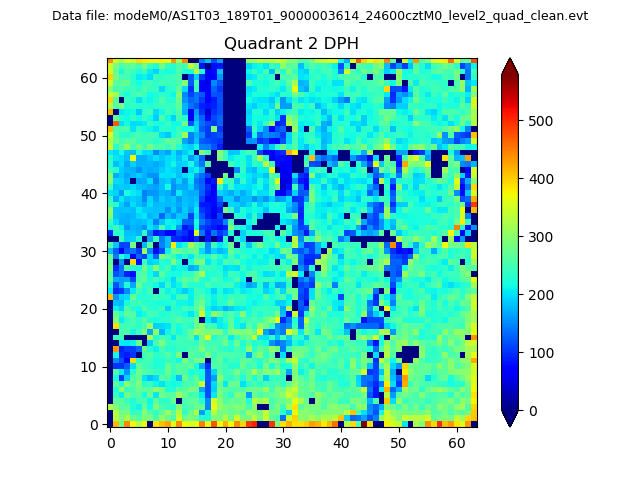
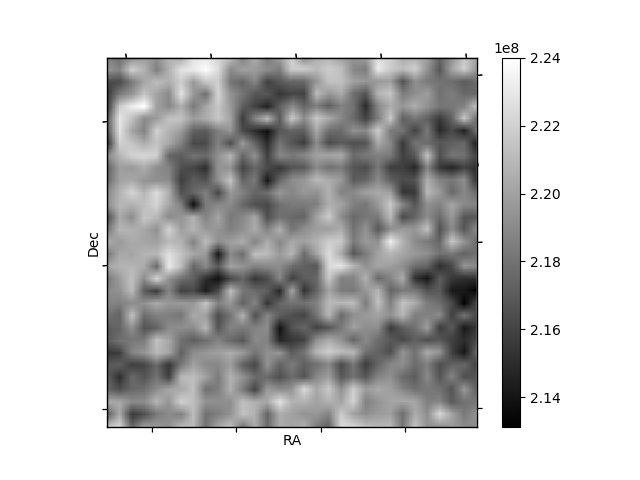
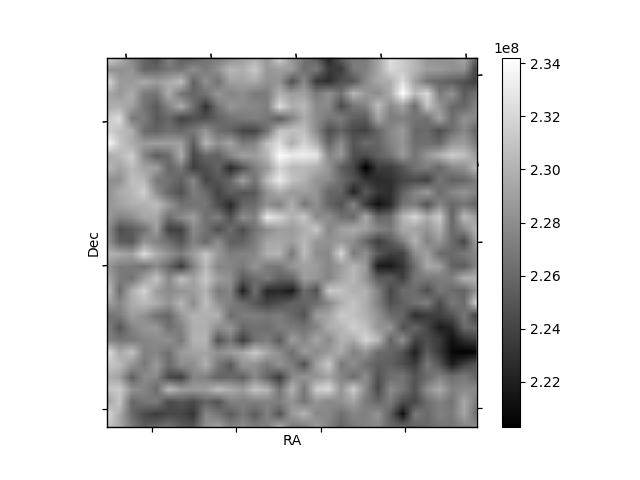
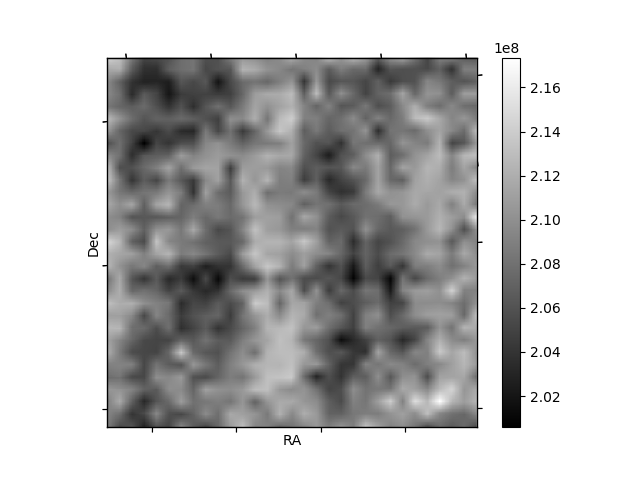
Histogram calculated using DETX and DETY for each event in the final _common_clean file
| Quadrant A | 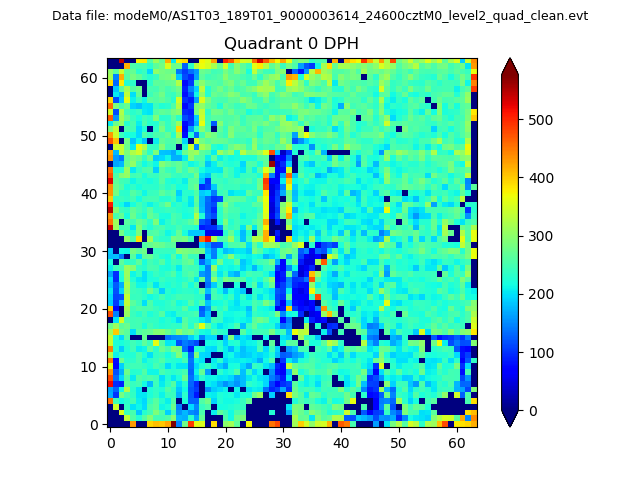 |
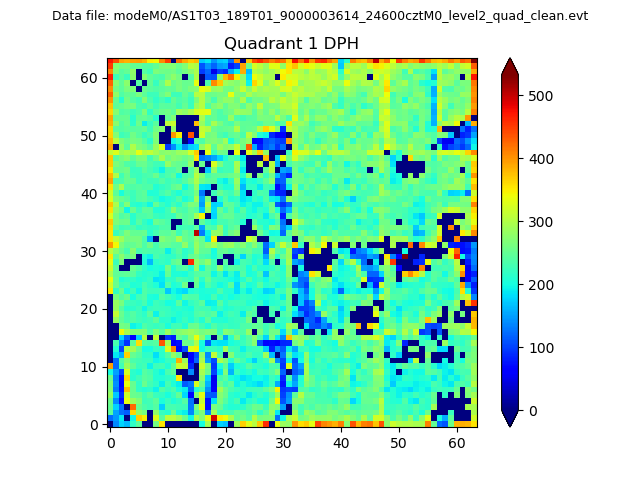 |
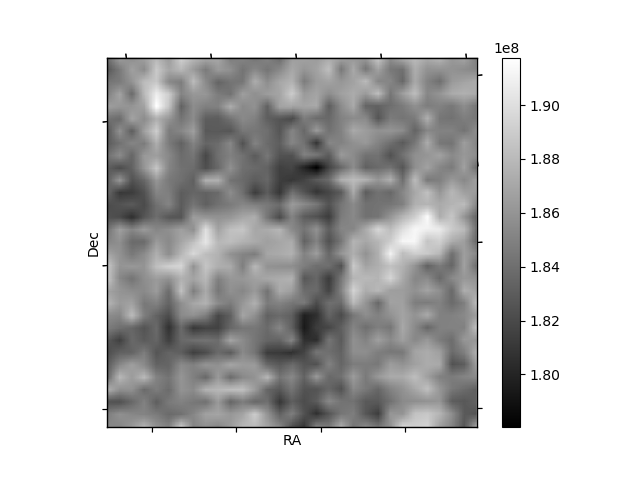
Quadrant B |
|---|---|---|---|
| Quadrant D | 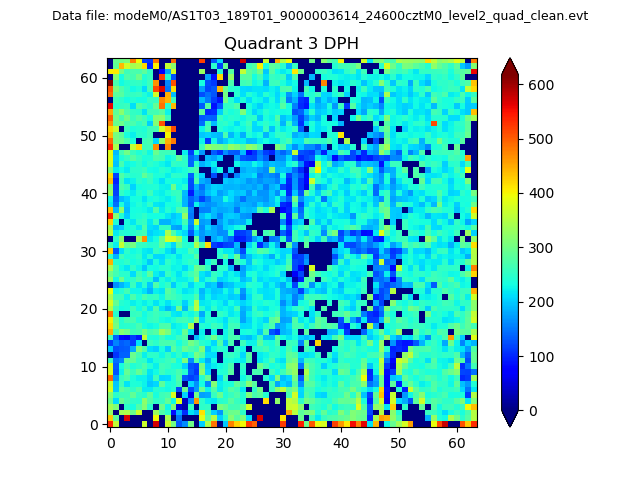 |
 |
Quadrant C |
| Plot type | Count rate plots | Images |
|---|---|---|
| Comparison with Poisson distribution Blue bars denote a histogram of data divided into 1 sec bins. Red curve is a Poisson curve with rate = median count rate of data. |
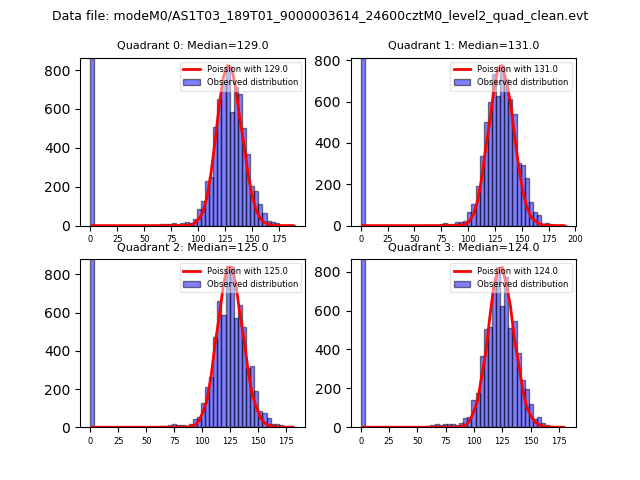 |
 |
| Quadrant-wise count rates Data is divided into 100 sec bins |
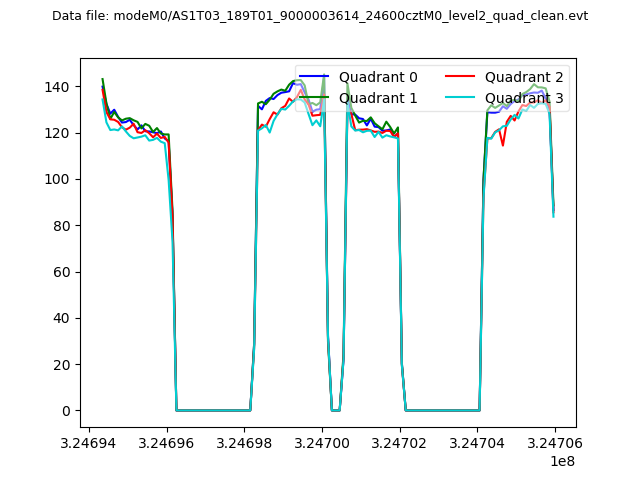 |
|
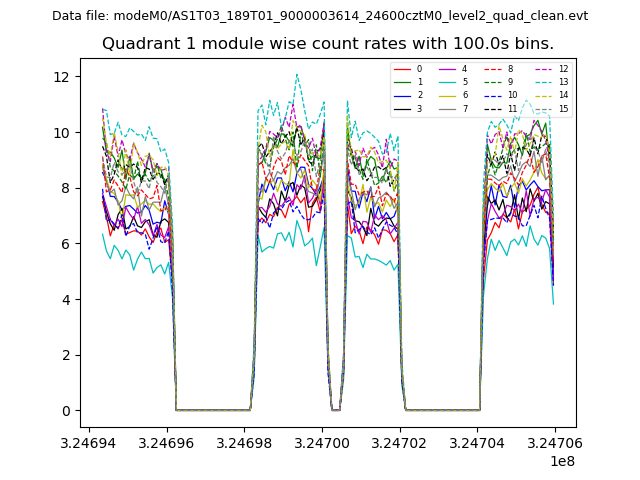
| Module-wise count rates for Quadrant A Data is divided into 100 sec bins |
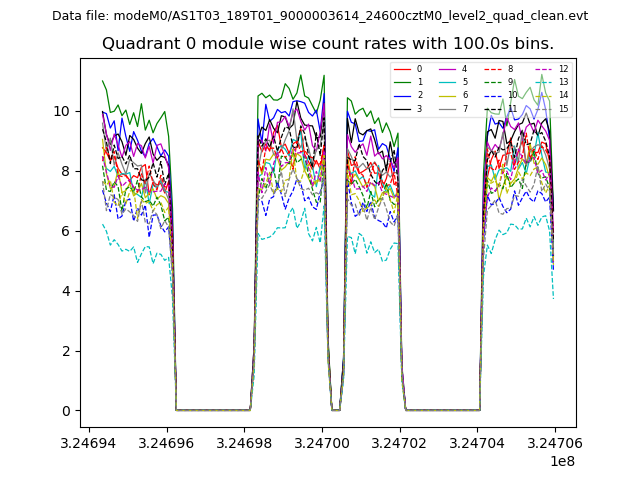 |
 |
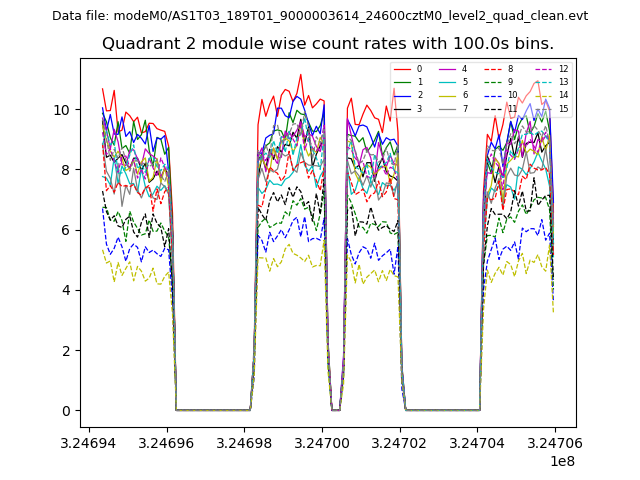
| Module-wise count rates for Quadrant B Data is divided into 100 sec bins |
 |
 |
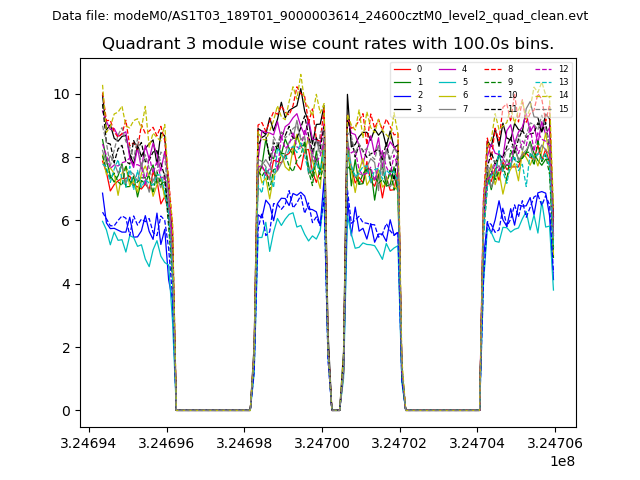
| Module-wise count rates for Quadrant C Data is divided into 100 sec bins |
 |
 |
| Module-wise count rates for Quadrant D Data is divided into 100 sec bins |
 |
 |
| Parameter | Plot |
|---|---|
| CZT HV Monitor | 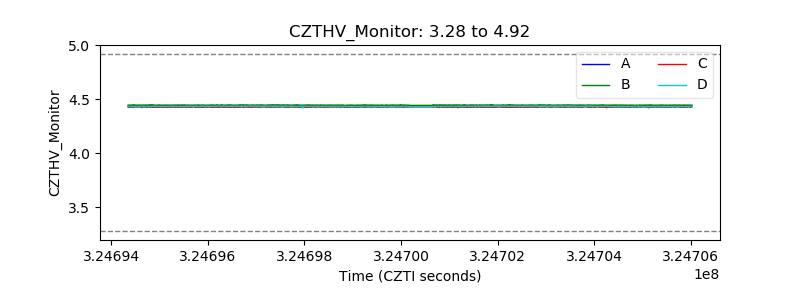 |
| D_VDD | 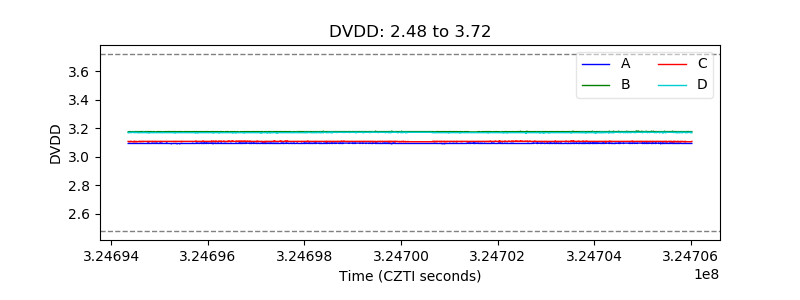 |
| Temperature 1 | 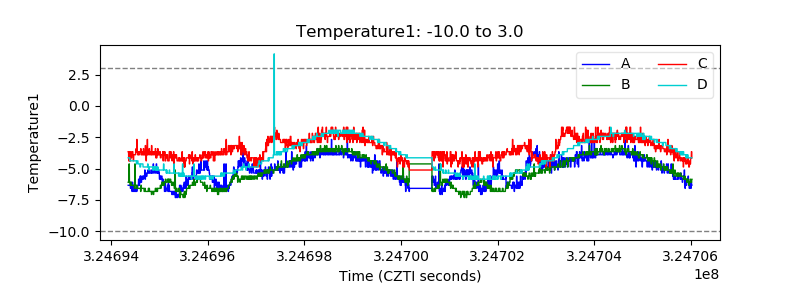 |
| Veto HV Monitor | 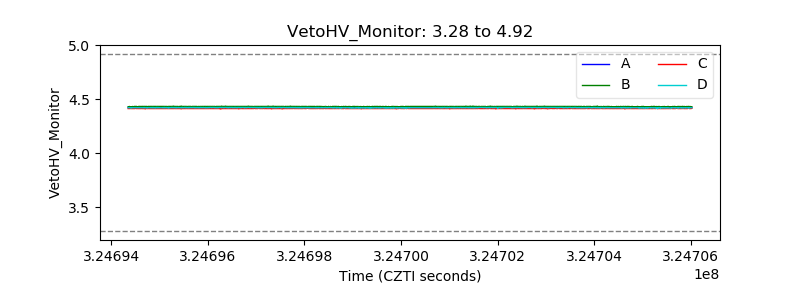 |
| Veto LLD | 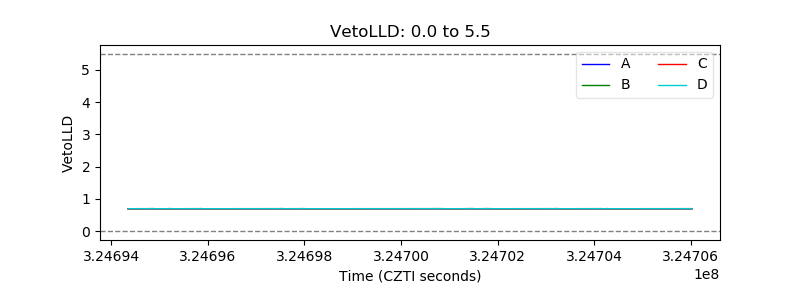 |
| Alpha Counter | 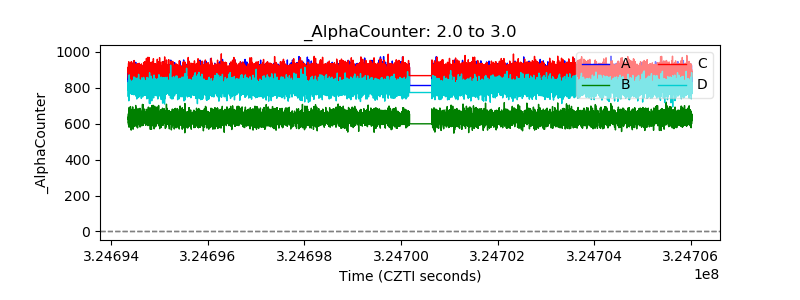 |
| _CPM_Rate | 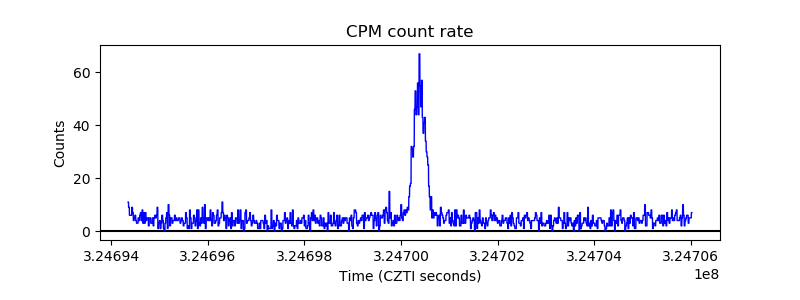 |
| CZT Counter | 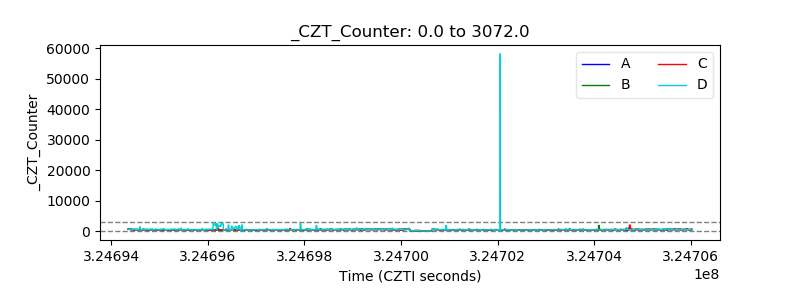 |
| +2.5 Volts monitor |  |
| +5 Volts monitor |  |
| _ROLL_ROT | 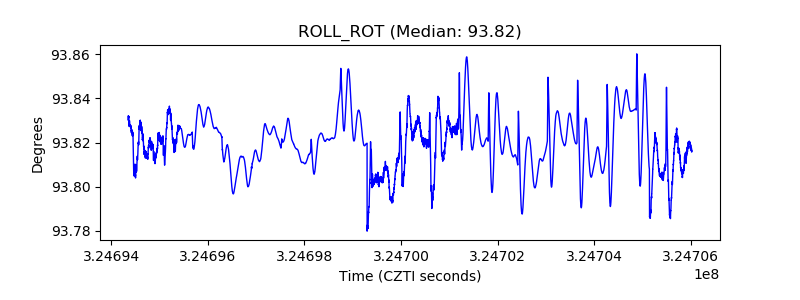 |
| _Roll_DEC | 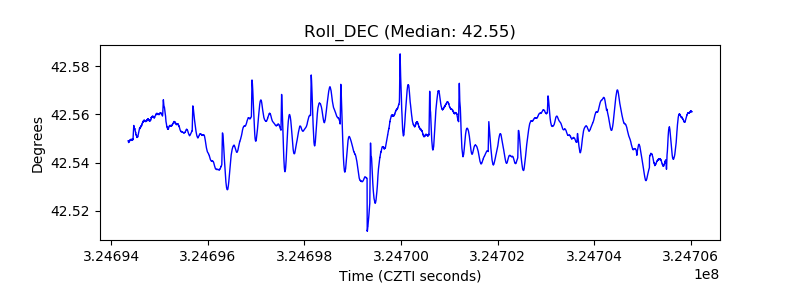 |
| _Roll_RA |  |
| Veto Counter | 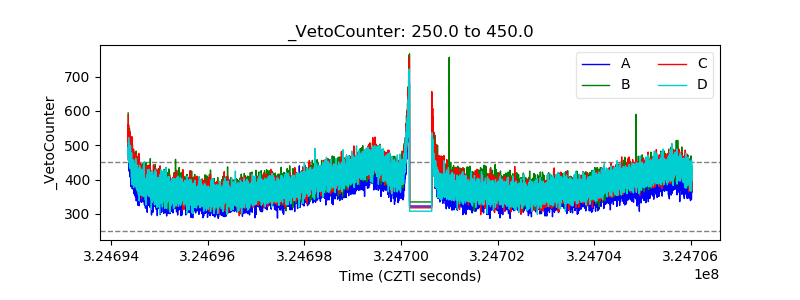 |