| Param | Original file | Final file |
|---|---|---|
| Filename | modeM0/AS1T03_189T01_9000003614_24601cztM0_level2.evt | modeM0/AS1T03_189T01_9000003614_24601cztM0_level2_quad_clean.evt |
| Size (bytes) | 745,174,080 | 111,836,160 |
| Size | 710.7 MB | 106.7 MB |
| Events in quadrant A | 4,038,389 | 719,096 |
| Events in quadrant B | 4,089,421 | 729,797 |
| Events in quadrant C | 9,495,785 | 662,626 |
| Events in quadrant D | 4,373,077 | 688,994 |
| Mode M9 | |||
|---|---|---|---|
| Quadrant | BADHDUFLAG | Total packets | Discarded packets |
| A | 0 | 14 | 0 |
| B | 0 | 14 | 0 |
| C | 0 | 14 | 0 |
| D | 0 | 14 | 0 |
| Mode M0 | |||
|---|---|---|---|
| Quadrant | BADHDUFLAG | Total packets | Discarded packets |
| A | 0 | 17229 | 2 |
| B | 0 | 17258 | 2 |
| C | 0 | 33922 | 2 |
| D | 0 | 18615 | 2 |
| Mode SS | |||
|---|---|---|---|
| Quadrant | BADHDUFLAG | Total packets | Discarded packets |
| A | 0 | 172 | 0 |
| B | 0 | 172 | 0 |
| C | 0 | 172 | 0 |
| D | 0 | 172 | 0 |
| Quadrant | Total seconds | Saturated seconds | Saturation percentage |
|---|---|---|---|
| A | 8440 | 96 | 1.137441% |
| B | 8440 | 125 | 1.481043% |
| C | 8441 | 1604 | 19.002488% |
| D | 8441 | 59 | 0.698969% |
Noise dominated data is calculated using 1-second bins in cleaned event files. If a bin has >2000 counts, and if more than 50% of those come from <1% of pixels, then it is considered to be noise-dominated and hence unusable.
| Quadrant | # 1 sec bins | Bins with >0 counts | Bins with >2000 counts | High rate bins dominated by noise | Noise dominated (total time) | Noise dominated (detector-on time) | Marked lightcurve |
|---|---|---|---|---|---|---|---|
| A | 9866 | 8442 | 0 | 0 | 0.00% | 0.00% | 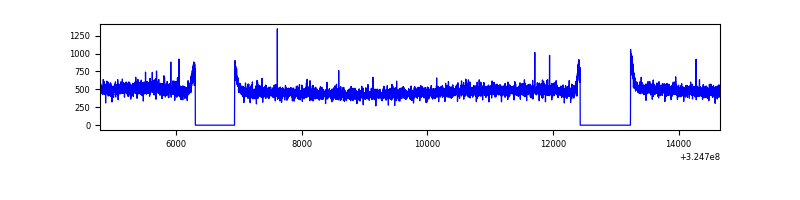 |
| B | 9866 | 8440 | 0 | 0 | 0.00% | 0.00% | 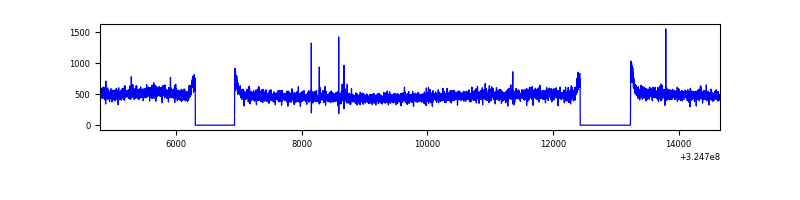 |
| C | 9867 | 8443 | 1032 | 1032 | 10.46% | 12.22% | 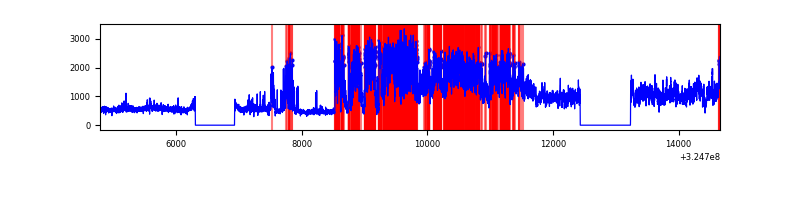 |
| D | 9867 | 8443 | 3 | 3 | 0.03% | 0.04% | 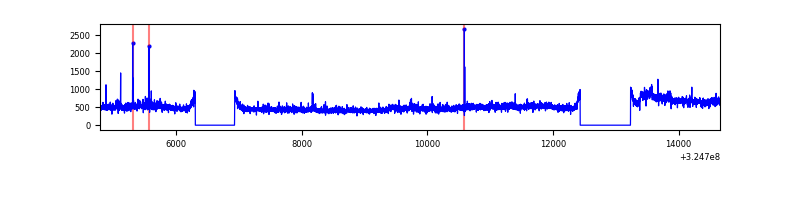 |
Top three noisy pixels from each quadrant. If the there are fewer than three noisy pixels in the level2.evt file, extra rows are filled as -1
| Pixel properties | Quadrant properties | ||||||
|---|---|---|---|---|---|---|---|
| Quadrant | DetID | PixID | Counts | Sigma | Mean | Median | Sigma |
| A | 13 | 254 | 12119 | 52.64 | 1045 | 1021 | 210.8 |
| A | 3 | 137 | 9839 | 41.82 | 1045 | 1021 | 210.8 |
| A | 0 | 226 | 8750 | 36.66 | 1045 | 1021 | 210.8 |
| B | 12 | 111 | 25776 | 123.95 | 1039 | 1010 | 199.8 |
| B | 11 | 111 | 23220 | 111.16 | 1039 | 1010 | 199.8 |
| B | 14 | 111 | 21101 | 100.56 | 1039 | 1010 | 199.8 |
| C | 7 | 247 | 5534254 | 24378.72 | 967 | 972 | 227.0 |
| C | 14 | 238 | 151693 | 664.05 | 967 | 972 | 227.0 |
| C | 7 | 226 | 16237 | 67.26 | 967 | 972 | 227.0 |
| D | 13 | 104 | 351476 | 1408.62 | 1019 | 989 | 248.8 |
| D | 1 | 52 | 102247 | 406.96 | 1019 | 989 | 248.8 |
| D | 8 | 195 | 74529 | 295.56 | 1019 | 989 | 248.8 |
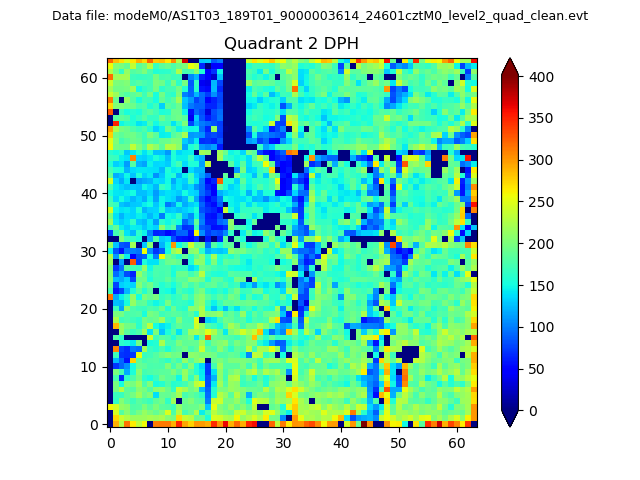
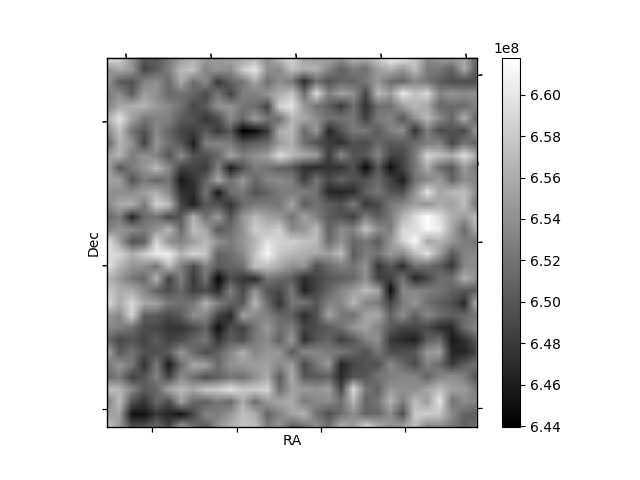
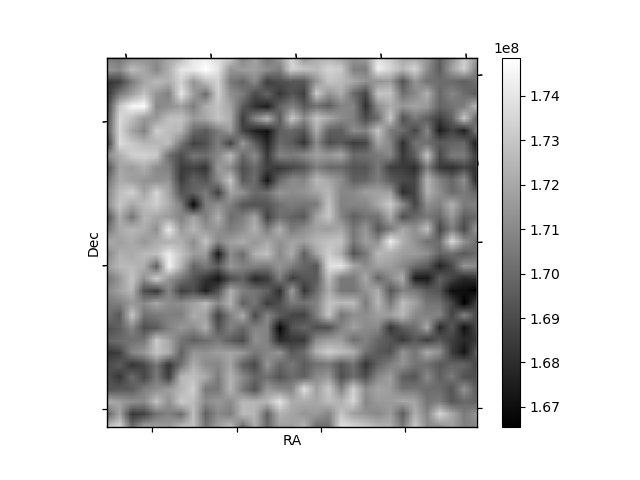
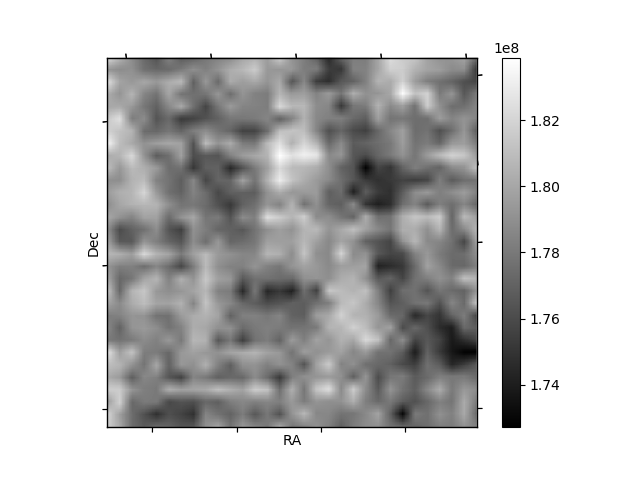
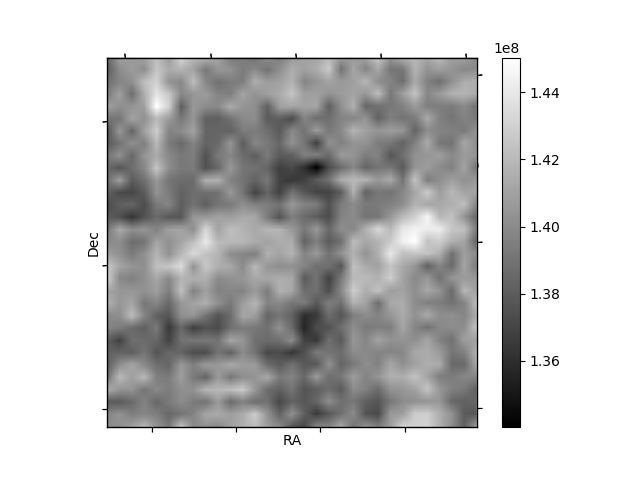
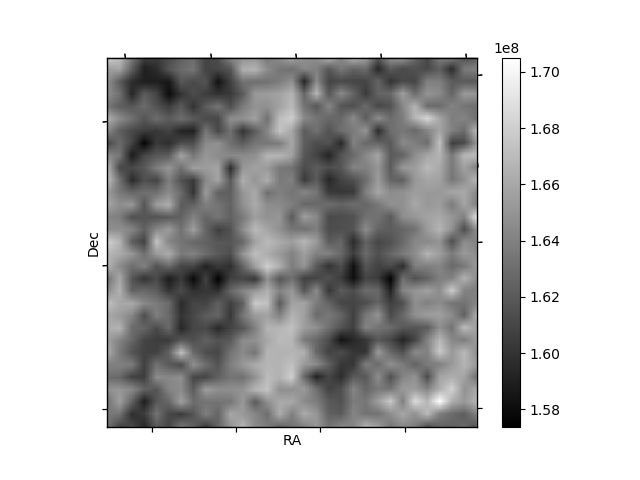
Histogram calculated using DETX and DETY for each event in the final _common_clean file
| Quadrant A | 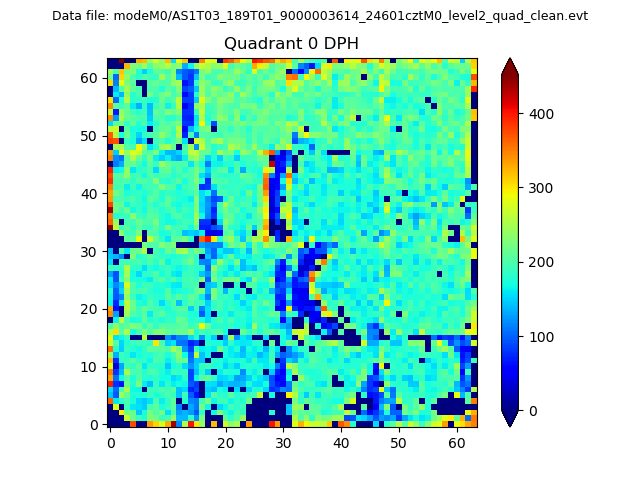 |
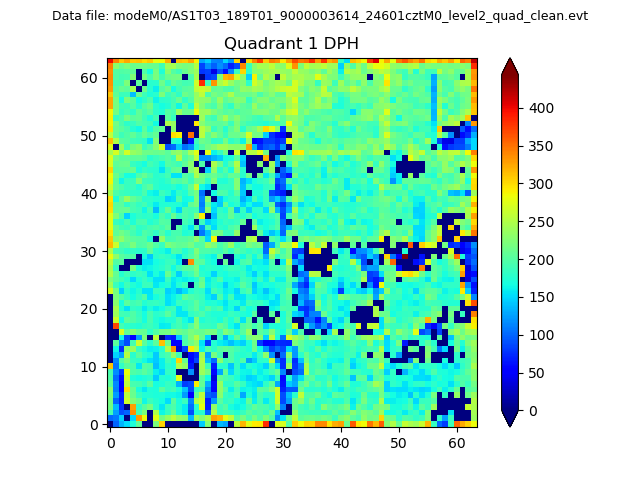 |
Quadrant B |
|---|---|---|---|
| Quadrant D | 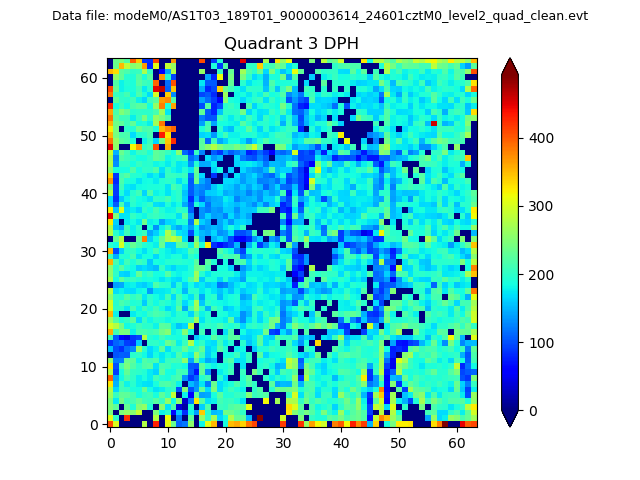 |
 |
Quadrant C |
| Plot type | Count rate plots | Images |
|---|---|---|
| Comparison with Poisson distribution Blue bars denote a histogram of data divided into 1 sec bins. Red curve is a Poisson curve with rate = median count rate of data. |
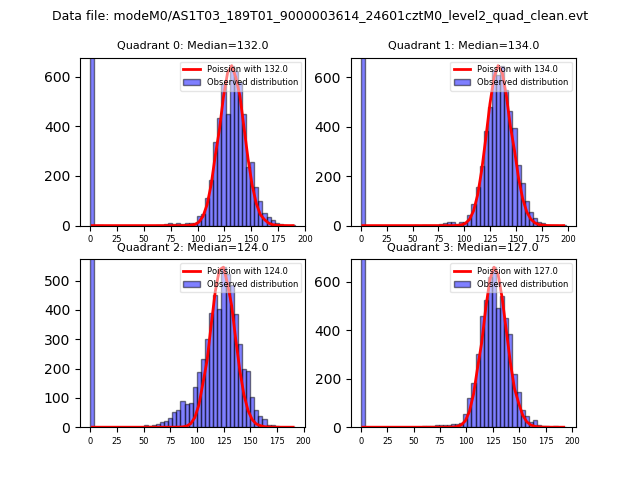 |
 |
| Quadrant-wise count rates Data is divided into 100 sec bins |
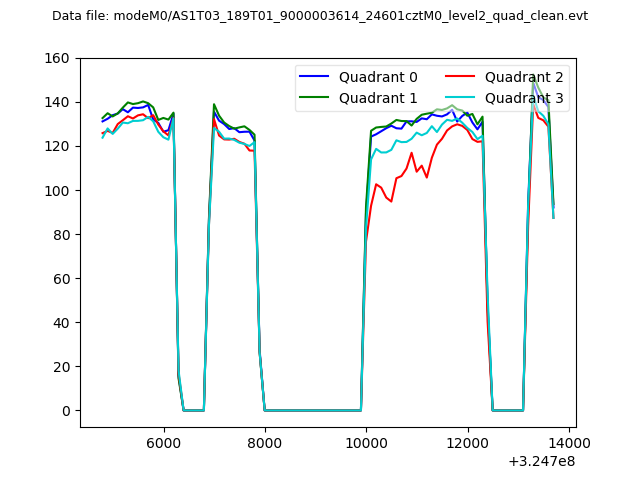 |
|
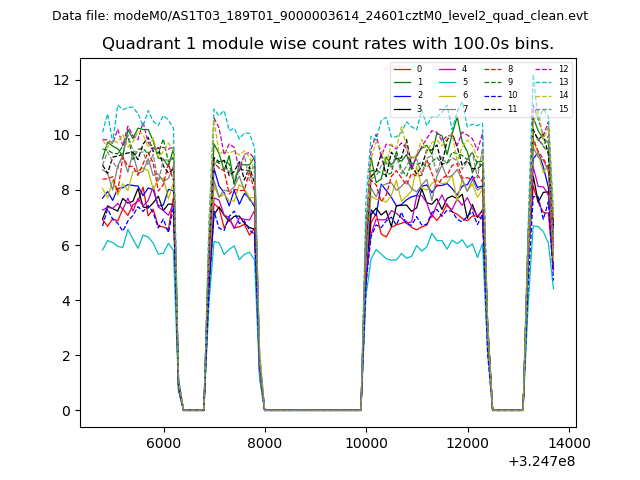
| Module-wise count rates for Quadrant A Data is divided into 100 sec bins |
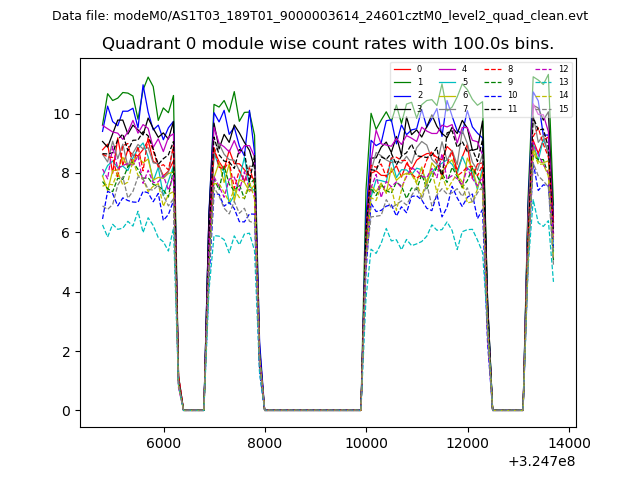 |
 |
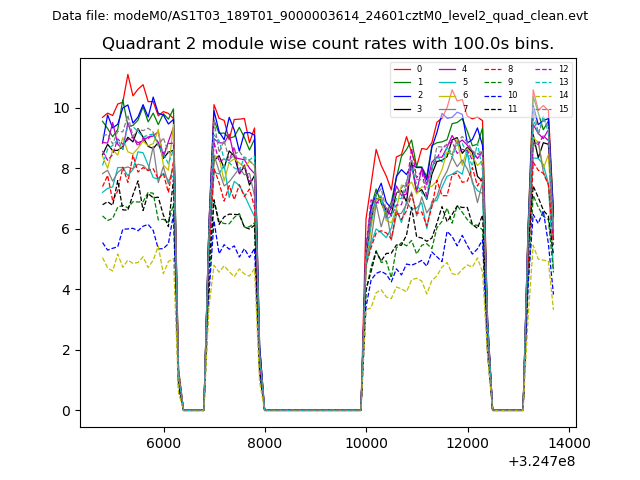
| Module-wise count rates for Quadrant B Data is divided into 100 sec bins |
 |
 |
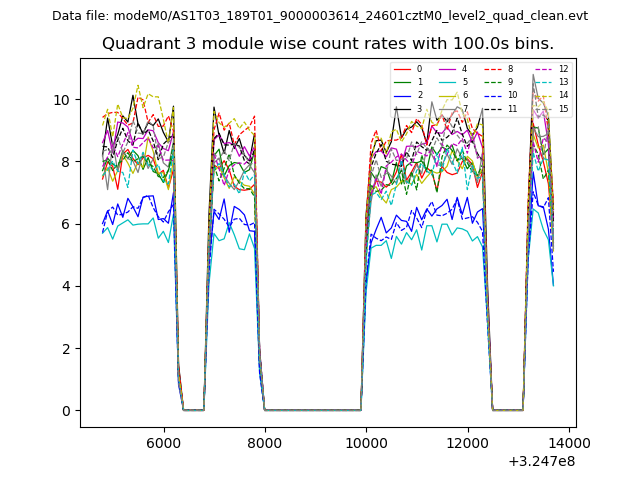
| Module-wise count rates for Quadrant C Data is divided into 100 sec bins |
 |
 |
| Module-wise count rates for Quadrant D Data is divided into 100 sec bins |
 |
 |
| Parameter | Plot |
|---|---|
| CZT HV Monitor | 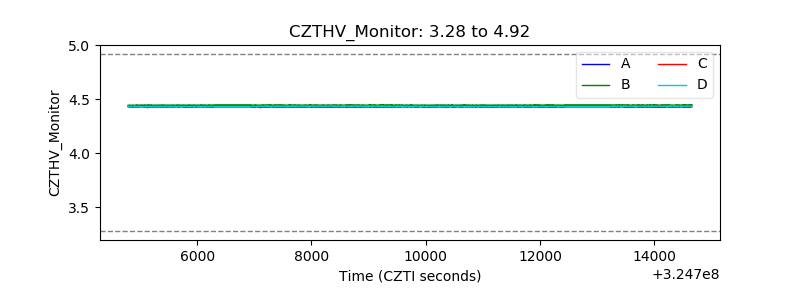 |
| D_VDD | 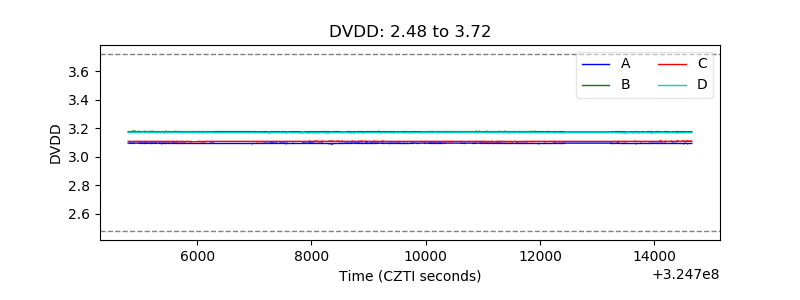 |
| Temperature 1 | 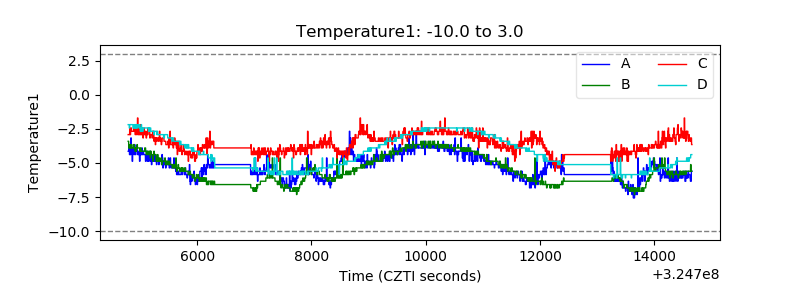 |
| Veto HV Monitor |  |
| Veto LLD | 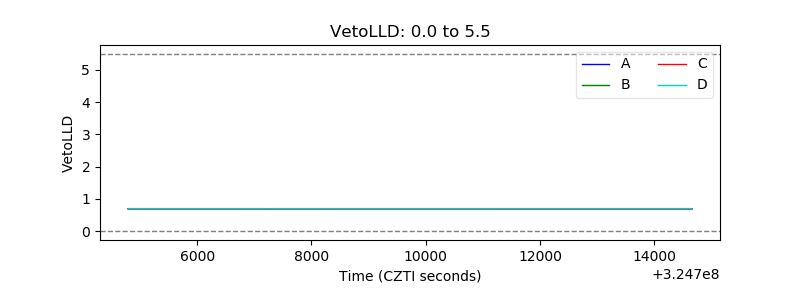 |
| Alpha Counter | 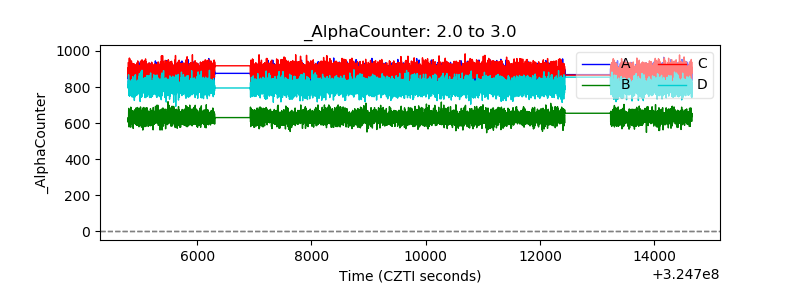 |
| _CPM_Rate | 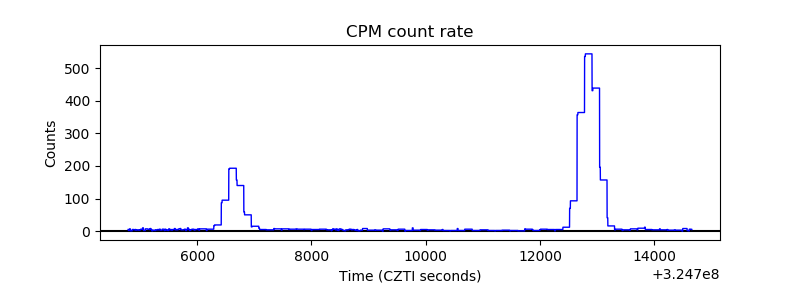 |
| CZT Counter | 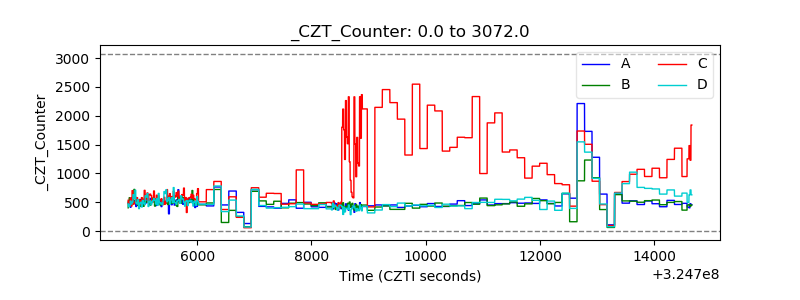 |
| +2.5 Volts monitor |  |
| +5 Volts monitor |  |
| _ROLL_ROT | 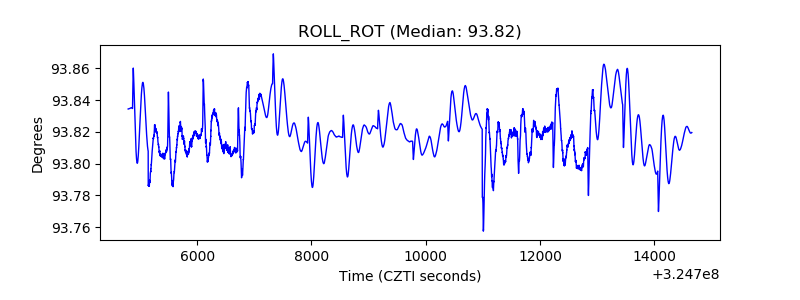 |
| _Roll_DEC | 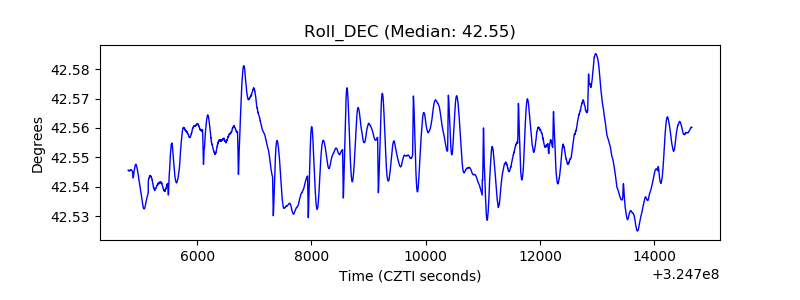 |
| _Roll_RA | 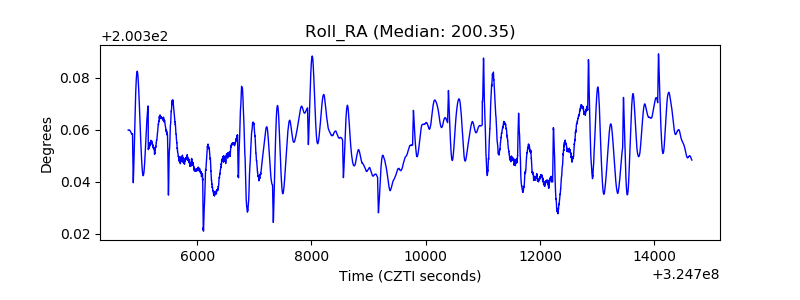 |
| Veto Counter | 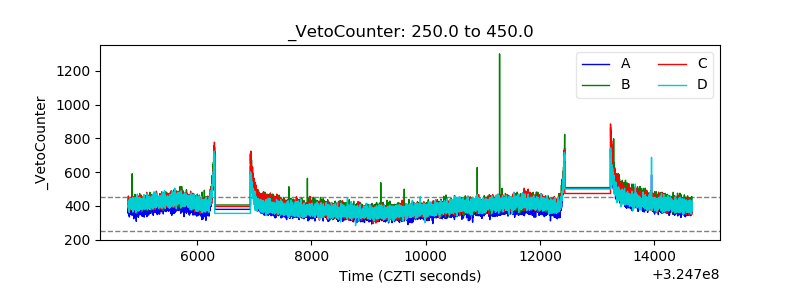 |