| Param | Original file | Final file |
|---|---|---|
| Filename | modeM0/AS1T03_189T01_9000003614_24602cztM0_level2.evt | modeM0/AS1T03_189T01_9000003614_24602cztM0_level2_quad_clean.evt |
| Size (bytes) | 569,439,360 | 72,357,120 |
| Size | 543.1 MB | 69.0 MB |
| Events in quadrant A | 3,295,445 | 441,403 |
| Events in quadrant B | 3,427,318 | 447,393 |
| Events in quadrant C | 5,938,438 | 417,710 |
| Events in quadrant D | 4,131,319 | 417,961 |
| Mode M9 | |||
|---|---|---|---|
| Quadrant | BADHDUFLAG | Total packets | Discarded packets |
| A | 0 | 15 | 0 |
| B | 0 | 16 | 0 |
| C | 0 | 16 | 0 |
| D | 0 | 16 | 0 |
| Mode M0 | |||
|---|---|---|---|
| Quadrant | BADHDUFLAG | Total packets | Discarded packets |
| A | 0 | 13841 | 2 |
| B | 0 | 14268 | 2 |
| C | 0 | 22248 | 2 |
| D | 0 | 17012 | 2 |
| Mode SS | |||
|---|---|---|---|
| Quadrant | BADHDUFLAG | Total packets | Discarded packets |
| A | 0 | 136 | 0 |
| B | 0 | 136 | 0 |
| C | 0 | 136 | 0 |
| D | 0 | 136 | 0 |
| Quadrant | Total seconds | Saturated seconds | Saturation percentage |
|---|---|---|---|
| A | 6689 | 94 | 1.405292% |
| B | 6689 | 125 | 1.868740% |
| C | 6689 | 338 | 5.053072% |
| D | 6689 | 84 | 1.255793% |
Noise dominated data is calculated using 1-second bins in cleaned event files. If a bin has >2000 counts, and if more than 50% of those come from <1% of pixels, then it is considered to be noise-dominated and hence unusable.
| Quadrant | # 1 sec bins | Bins with >0 counts | Bins with >2000 counts | High rate bins dominated by noise | Noise dominated (total time) | Noise dominated (detector-on time) | Marked lightcurve |
|---|---|---|---|---|---|---|---|
| A | 7644 | 6689 | 0 | 0 | 0.00% | 0.00% | 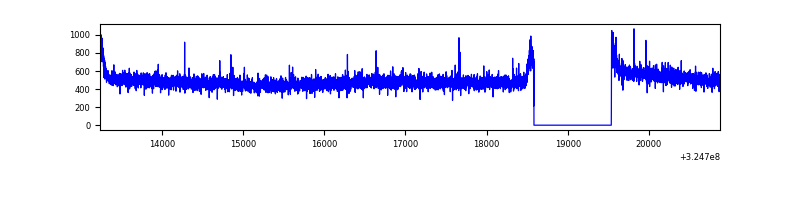 |
| B | 7644 | 6689 | 12 | 12 | 0.16% | 0.18% | 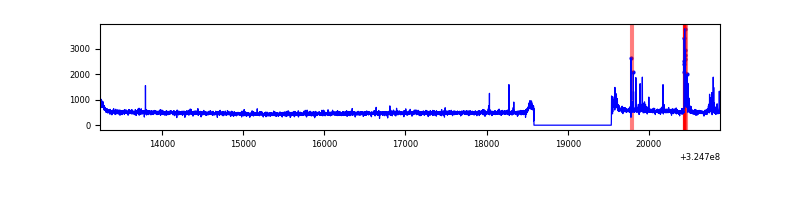 |
| C | 7644 | 6689 | 50 | 50 | 0.65% | 0.75% |  |
| D | 7644 | 6689 | 2 | 2 | 0.03% | 0.03% | 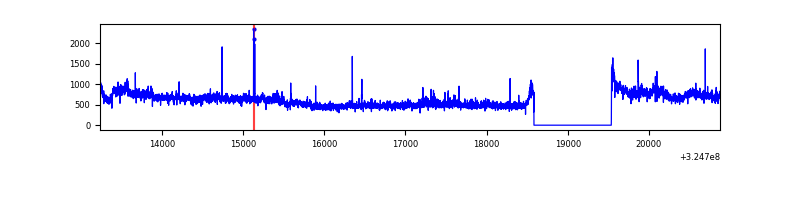 |
Top three noisy pixels from each quadrant. If the there are fewer than three noisy pixels in the level2.evt file, extra rows are filled as -1
| Pixel properties | Quadrant properties | ||||||
|---|---|---|---|---|---|---|---|
| Quadrant | DetID | PixID | Counts | Sigma | Mean | Median | Sigma |
| A | 12 | 96 | 9681 | 52.08 | 850 | 832 | 169.9 |
| A | 13 | 254 | 8953 | 47.8 | 850 | 832 | 169.9 |
| A | 6 | 16 | 8155 | 43.1 | 850 | 832 | 169.9 |
| B | 3 | 64 | 131059 | 806.44 | 839 | 815 | 161.5 |
| B | 12 | 111 | 20339 | 120.89 | 839 | 815 | 161.5 |
| B | 11 | 111 | 18396 | 108.86 | 839 | 815 | 161.5 |
| C | 7 | 247 | 2678926 | 14394.87 | 797 | 804 | 186.0 |
| C | 14 | 238 | 126265 | 674.35 | 797 | 804 | 186.0 |
| C | 0 | 239 | 17830 | 91.51 | 797 | 804 | 186.0 |
| D | 13 | 104 | 899640 | 4529.99 | 818 | 791 | 198.4 |
| D | 1 | 52 | 77736 | 387.78 | 818 | 791 | 198.4 |
| D | 8 | 195 | 46750 | 231.62 | 818 | 791 | 198.4 |
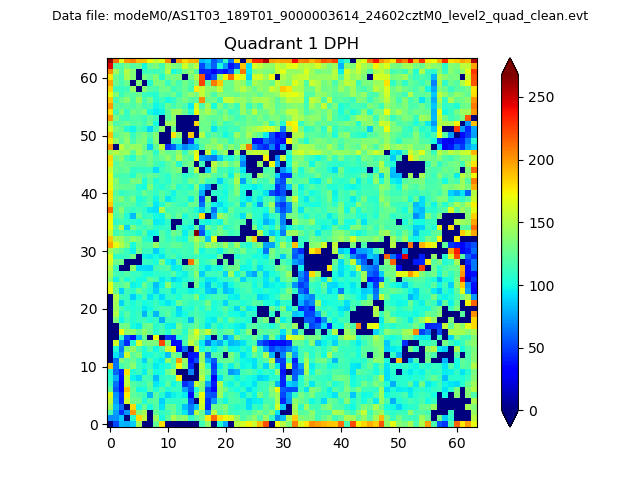
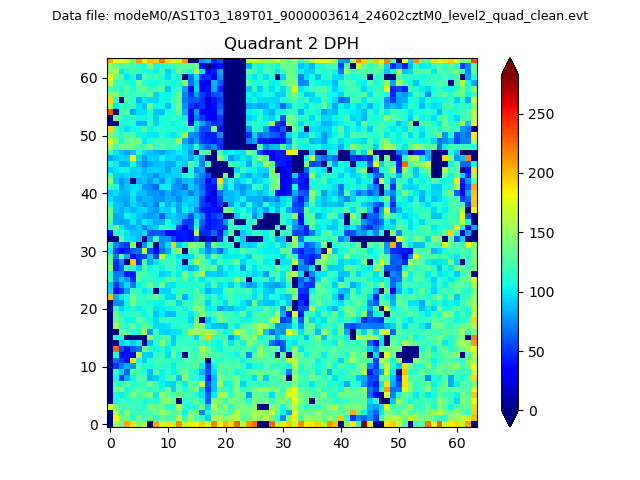
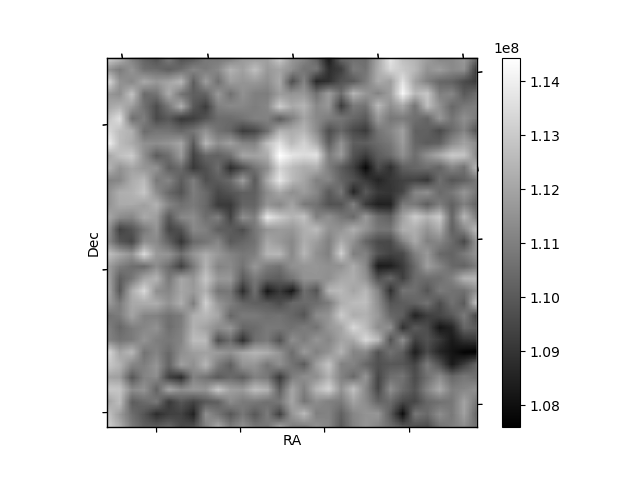
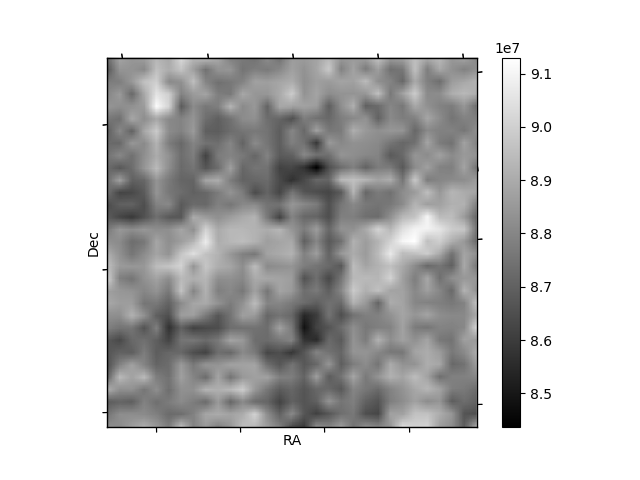
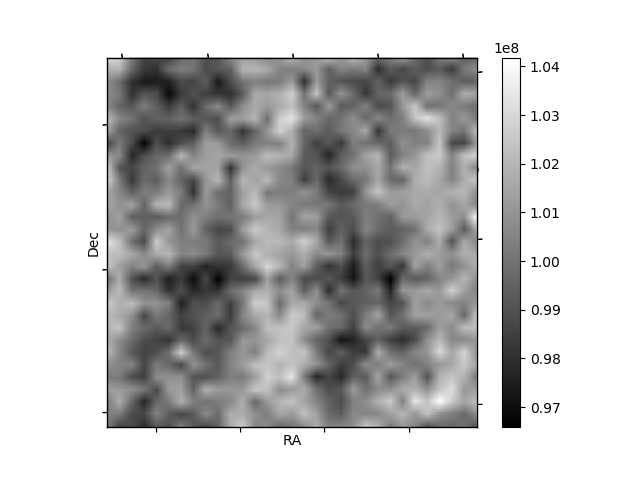
Histogram calculated using DETX and DETY for each event in the final _common_clean file
| Quadrant A | 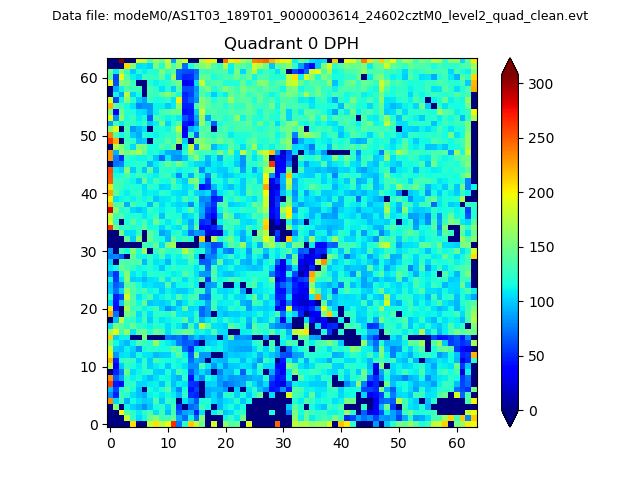 |
 |
Quadrant B |
|---|---|---|---|
| Quadrant D | 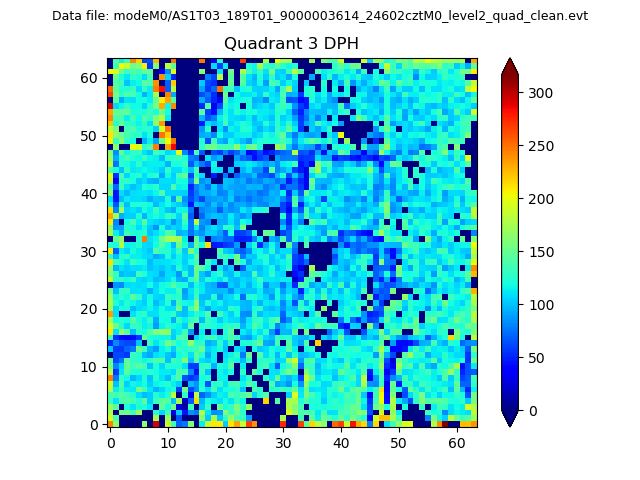 |
 |
Quadrant C |
| Plot type | Count rate plots | Images |
|---|---|---|
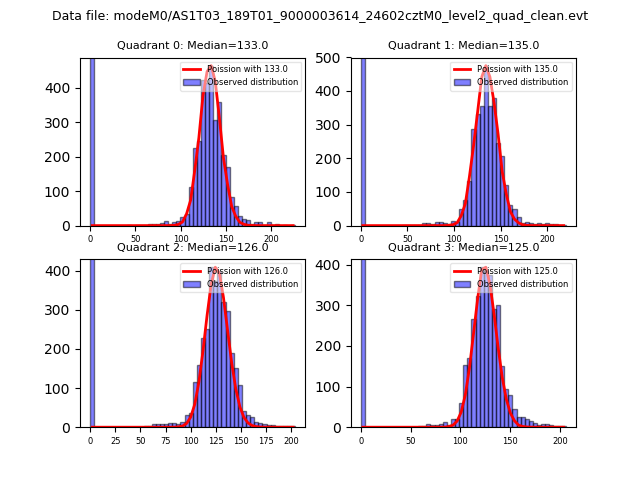
| Comparison with Poisson distribution Blue bars denote a histogram of data divided into 1 sec bins. Red curve is a Poisson curve with rate = median count rate of data. |
 |
 |
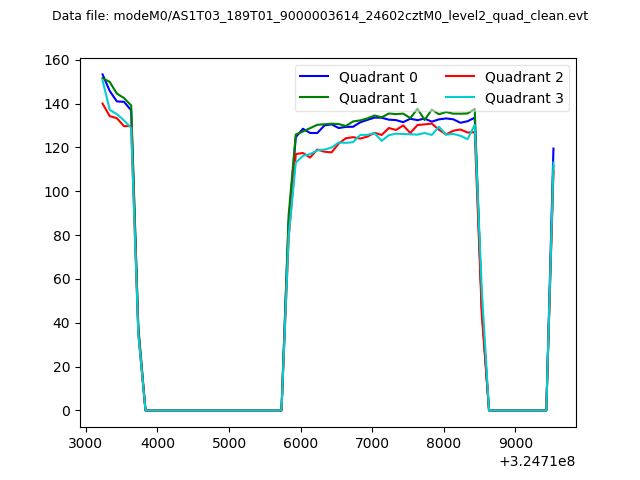
| Quadrant-wise count rates Data is divided into 100 sec bins |
 |
|
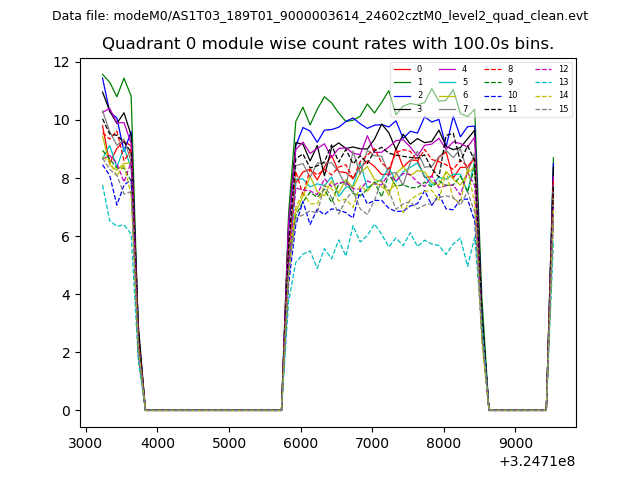
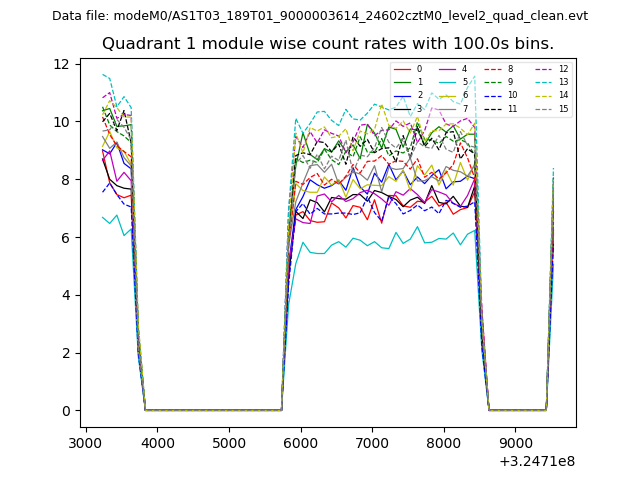
| Module-wise count rates for Quadrant A Data is divided into 100 sec bins |
 |
 |
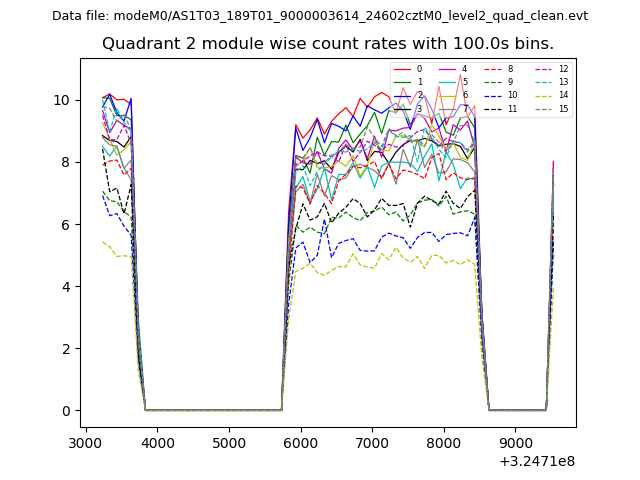
| Module-wise count rates for Quadrant B Data is divided into 100 sec bins |
 |
 |
| Module-wise count rates for Quadrant C Data is divided into 100 sec bins |
 |
 |
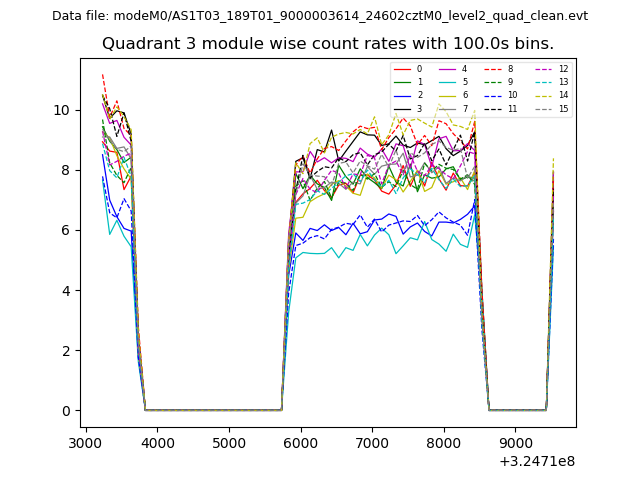
| Module-wise count rates for Quadrant D Data is divided into 100 sec bins |
 |
 |
| Parameter | Plot |
|---|---|
| CZT HV Monitor | 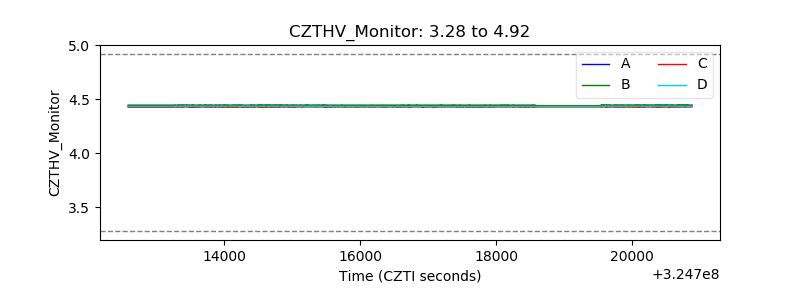 |
| D_VDD | 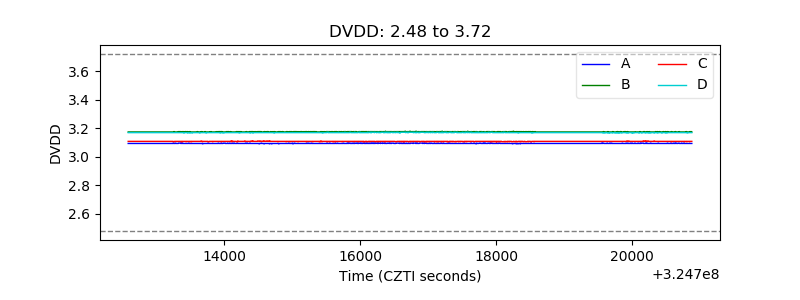 |
| Temperature 1 | 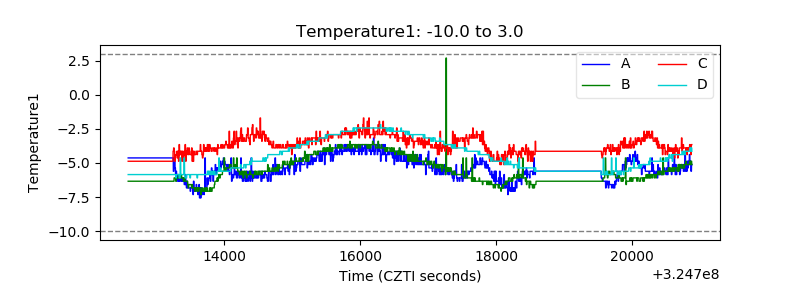 |
| Veto HV Monitor |  |
| Veto LLD | 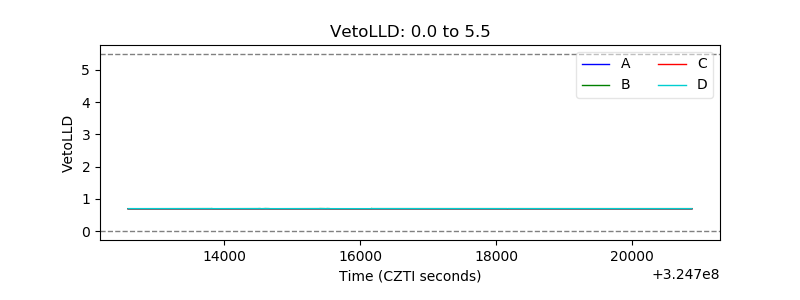 |
| Alpha Counter | 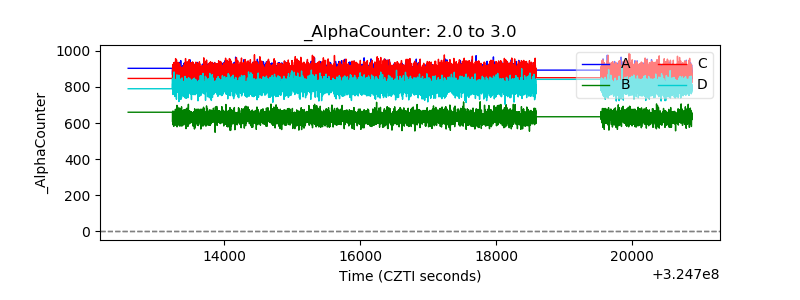 |
| _CPM_Rate | 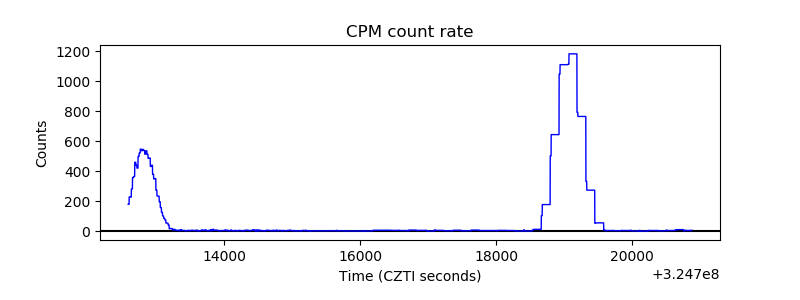 |
| CZT Counter | 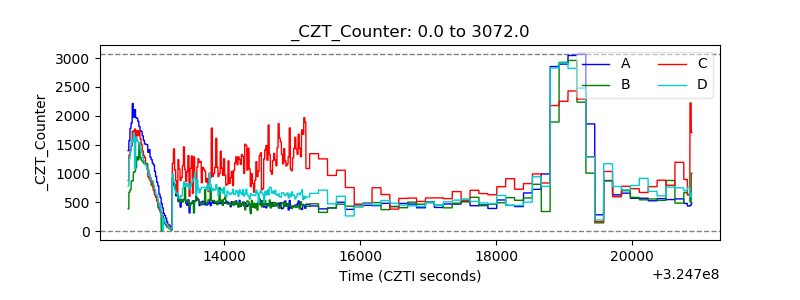 |
| +2.5 Volts monitor |  |
| +5 Volts monitor |  |
| _ROLL_ROT | 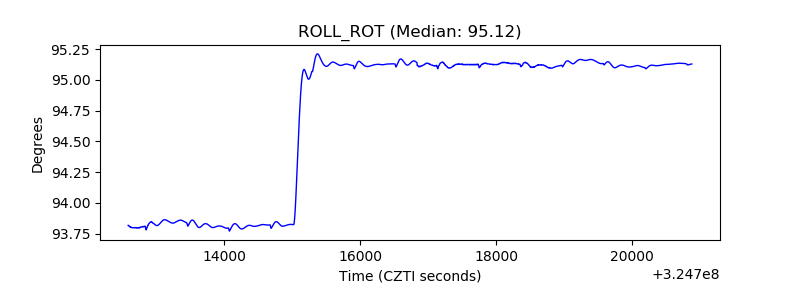 |
| _Roll_DEC | 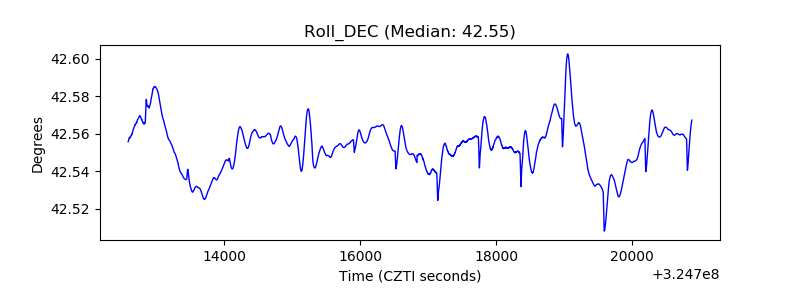 |
| _Roll_RA | 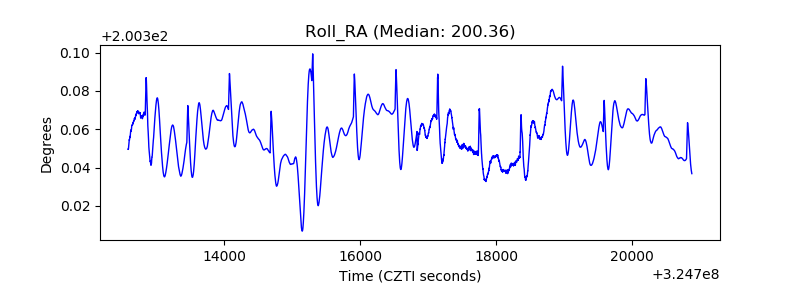 |
| Veto Counter | 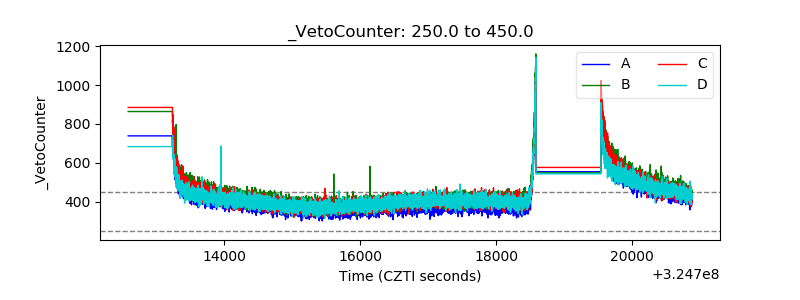 |