| Param | Original file | Final file |
|---|---|---|
| Filename | modeM0/AS1T03_189T01_9000003614_24604cztM0_level2.evt | modeM0/AS1T03_189T01_9000003614_24604cztM0_level2_quad_clean.evt |
| Size (bytes) | 529,001,280 | 68,169,600 |
| Size | 504.5 MB | 65.0 MB |
| Events in quadrant A | 3,289,601 | 414,577 |
| Events in quadrant B | 3,476,124 | 418,414 |
| Events in quadrant C | 4,670,183 | 394,465 |
| Events in quadrant D | 4,152,494 | 391,215 |
| Mode M9 | |||
|---|---|---|---|
| Quadrant | BADHDUFLAG | Total packets | Discarded packets |
| A | 0 | 17 | 0 |
| B | 0 | 18 | 0 |
| C | 0 | 18 | 0 |
| D | 0 | 18 | 0 |
| Mode M0 | |||
|---|---|---|---|
| Quadrant | BADHDUFLAG | Total packets | Discarded packets |
| A | 0 | 13749 | 3 |
| B | 0 | 14331 | 2 |
| C | 0 | 18132 | 2 |
| D | 0 | 16619 | 2 |
| Mode SS | |||
|---|---|---|---|
| Quadrant | BADHDUFLAG | Total packets | Discarded packets |
| A | 0 | 130 | 0 |
| B | 0 | 130 | 0 |
| C | 0 | 130 | 0 |
| D | 0 | 130 | 0 |
| Quadrant | Total seconds | Saturated seconds | Saturation percentage |
|---|---|---|---|
| A | 6381 | 73 | 1.144021% |
| B | 6381 | 106 | 1.661182% |
| C | 6381 | 292 | 4.576085% |
| D | 6381 | 64 | 1.002978% |
Noise dominated data is calculated using 1-second bins in cleaned event files. If a bin has >2000 counts, and if more than 50% of those come from <1% of pixels, then it is considered to be noise-dominated and hence unusable.
| Quadrant | # 1 sec bins | Bins with >0 counts | Bins with >2000 counts | High rate bins dominated by noise | Noise dominated (total time) | Noise dominated (detector-on time) | Marked lightcurve |
|---|---|---|---|---|---|---|---|
| A | 7511 | 6382 | 0 | 0 | 0.00% | 0.00% | 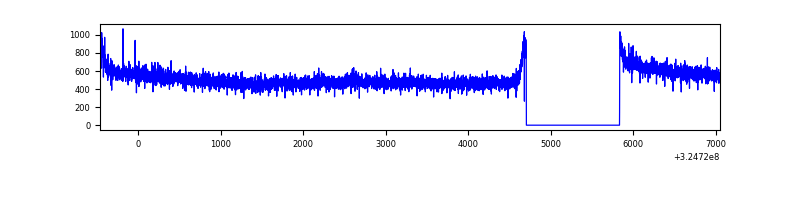 |
| B | 7511 | 6381 | 16 | 16 | 0.21% | 0.25% | 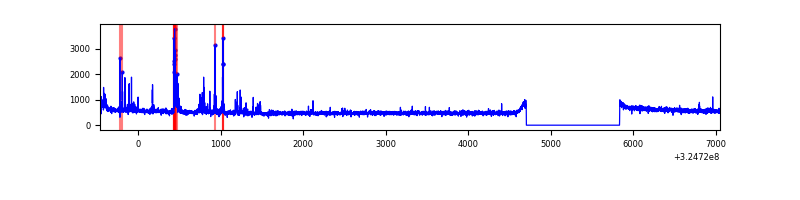 |
| C | 7511 | 6382 | 140 | 140 | 1.86% | 2.19% | 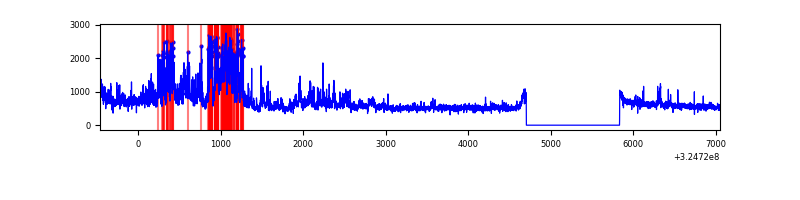 |
| D | 7511 | 6381 | 5 | 5 | 0.07% | 0.08% | 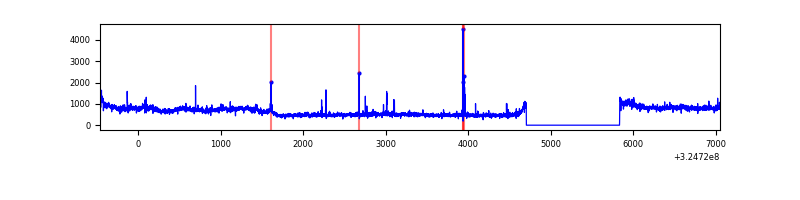 |
Top three noisy pixels from each quadrant. If the there are fewer than three noisy pixels in the level2.evt file, extra rows are filled as -1
| Pixel properties | Quadrant properties | ||||||
|---|---|---|---|---|---|---|---|
| Quadrant | DetID | PixID | Counts | Sigma | Mean | Median | Sigma |
| A | 13 | 254 | 9321 | 50.15 | 853 | 834 | 169.2 |
| A | 3 | 137 | 7612 | 40.05 | 853 | 834 | 169.2 |
| A | 0 | 226 | 7350 | 38.5 | 853 | 834 | 169.2 |
| B | 3 | 64 | 180843 | 1132.64 | 838 | 817 | 158.9 |
| B | 12 | 111 | 19675 | 118.65 | 838 | 817 | 158.9 |
| B | 11 | 111 | 17821 | 106.98 | 838 | 817 | 158.9 |
| C | 7 | 247 | 1398090 | 7565.49 | 796 | 804 | 184.7 |
| C | 14 | 238 | 126846 | 682.44 | 796 | 804 | 184.7 |
| C | 0 | 239 | 20813 | 108.34 | 796 | 804 | 184.7 |
| D | 13 | 104 | 877256 | 4418.06 | 818 | 793 | 198.4 |
| D | 1 | 52 | 90362 | 451.5 | 818 | 793 | 198.4 |
| D | 8 | 195 | 59337 | 295.11 | 818 | 793 | 198.4 |
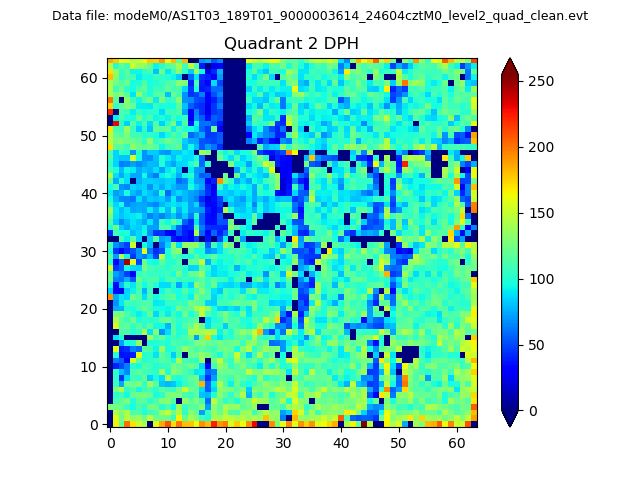
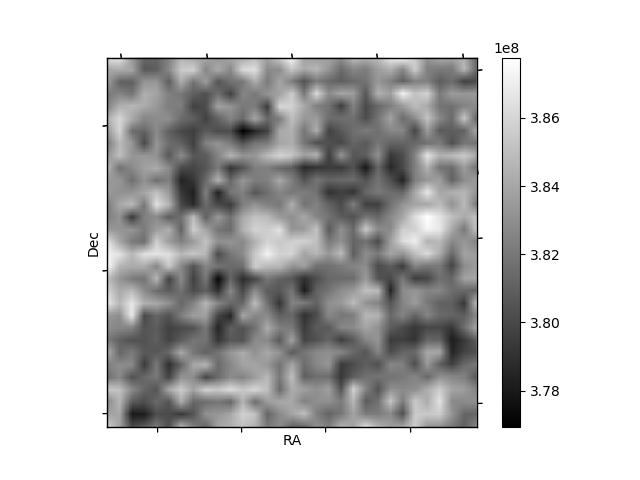
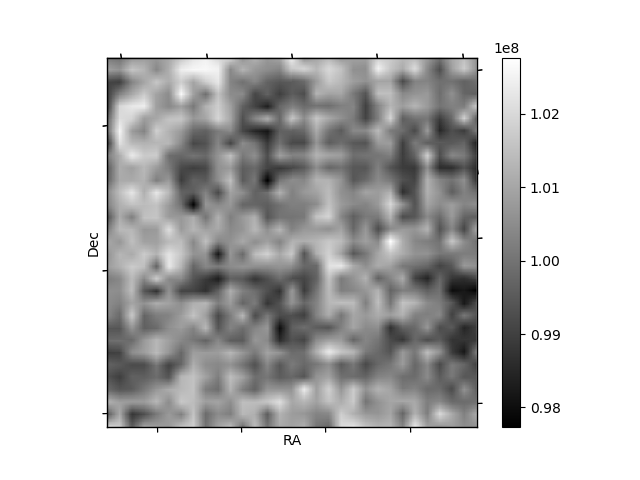
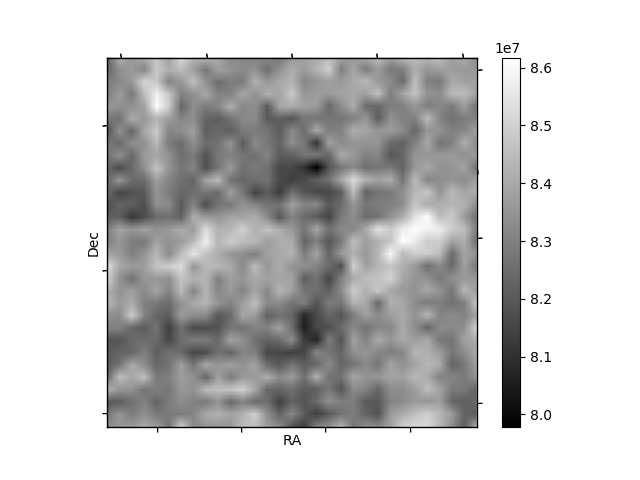
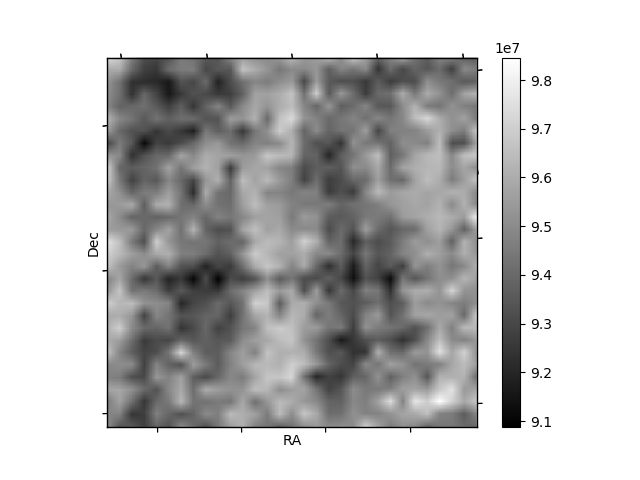
Histogram calculated using DETX and DETY for each event in the final _common_clean file
| Quadrant A | 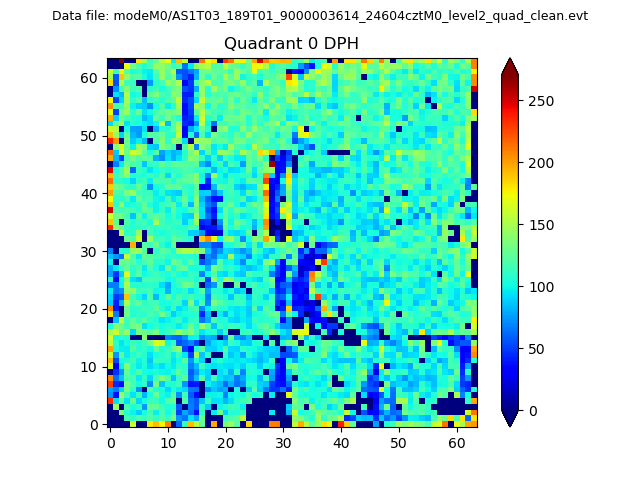 |
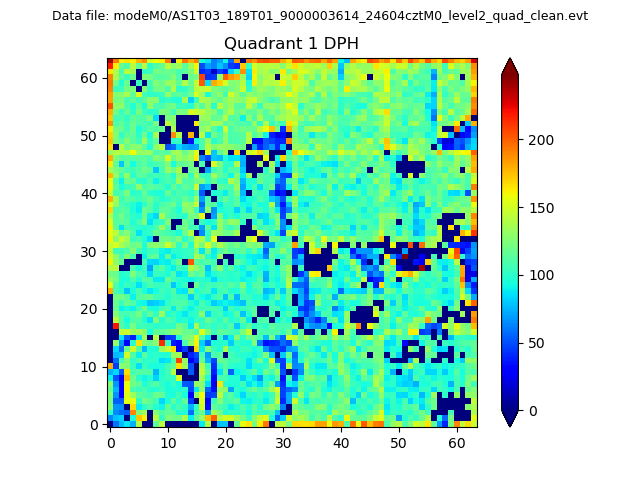 |
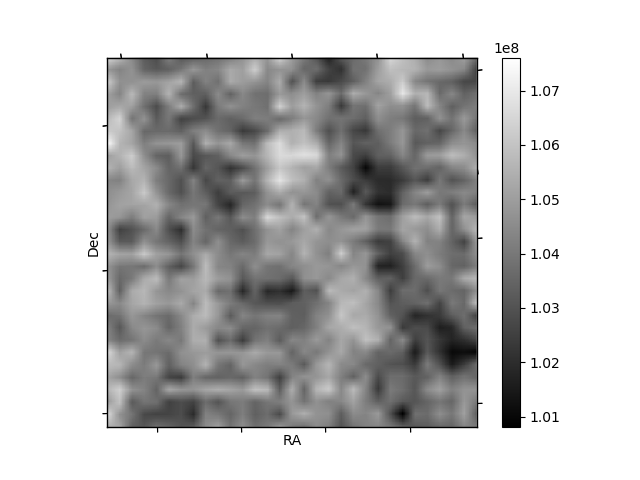
Quadrant B |
|---|---|---|---|
| Quadrant D | 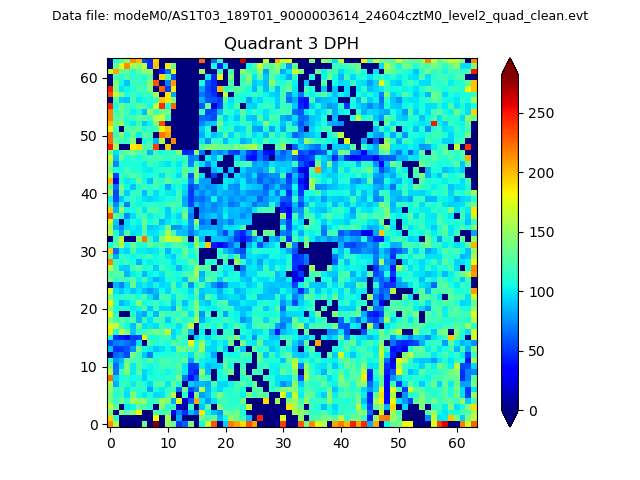 |
 |
Quadrant C |
| Plot type | Count rate plots | Images |
|---|---|---|
| Comparison with Poisson distribution Blue bars denote a histogram of data divided into 1 sec bins. Red curve is a Poisson curve with rate = median count rate of data. |
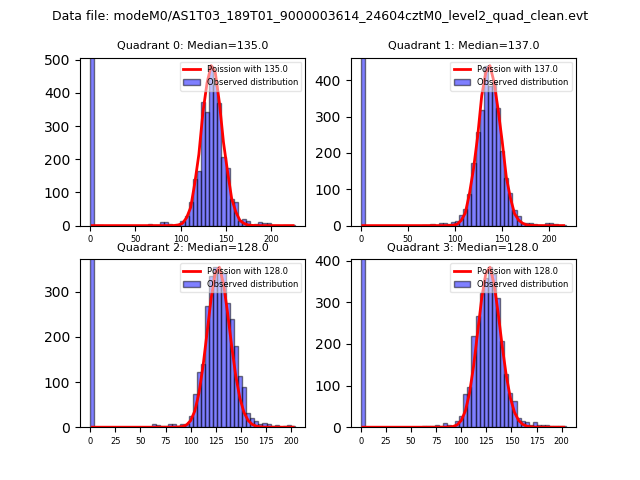 |
 |
| Quadrant-wise count rates Data is divided into 100 sec bins |
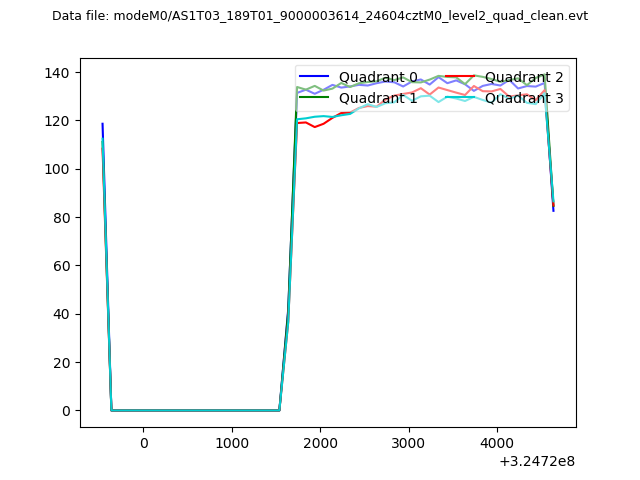 |
|
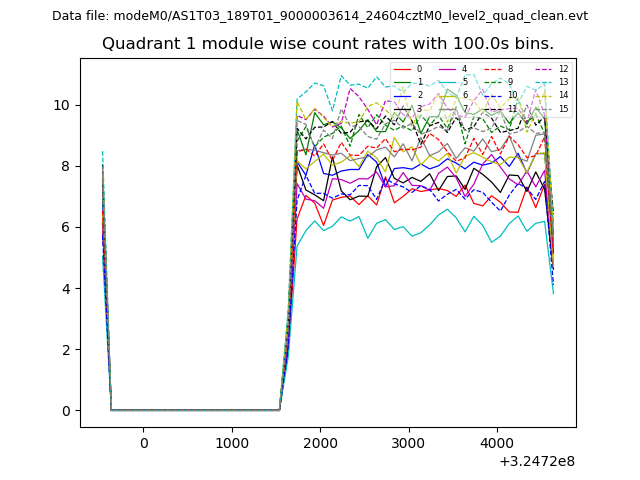
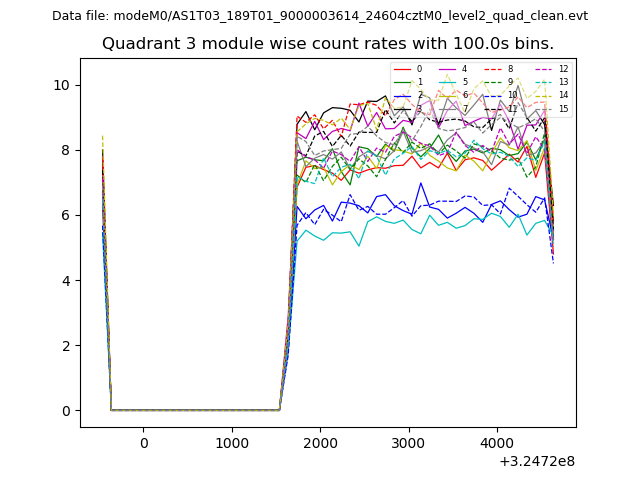
| Module-wise count rates for Quadrant A Data is divided into 100 sec bins |
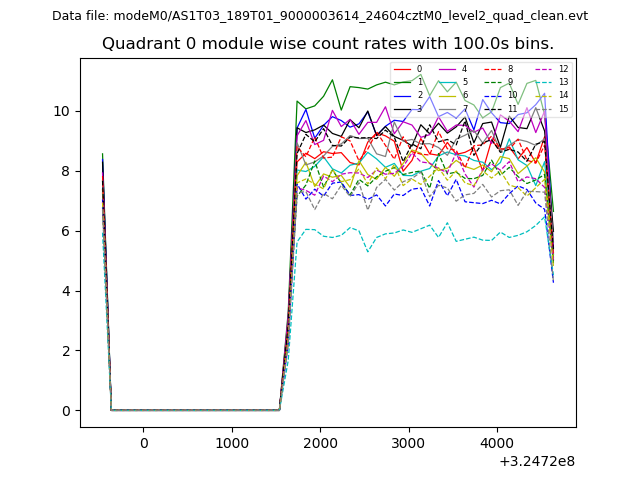 |
 |
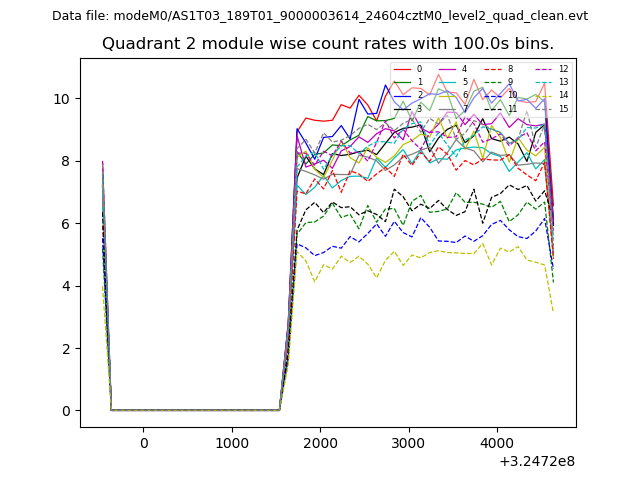
| Module-wise count rates for Quadrant B Data is divided into 100 sec bins |
 |
 |
| Module-wise count rates for Quadrant C Data is divided into 100 sec bins |
 |
 |
| Module-wise count rates for Quadrant D Data is divided into 100 sec bins |
 |
 |
| Parameter | Plot |
|---|---|
| CZT HV Monitor | 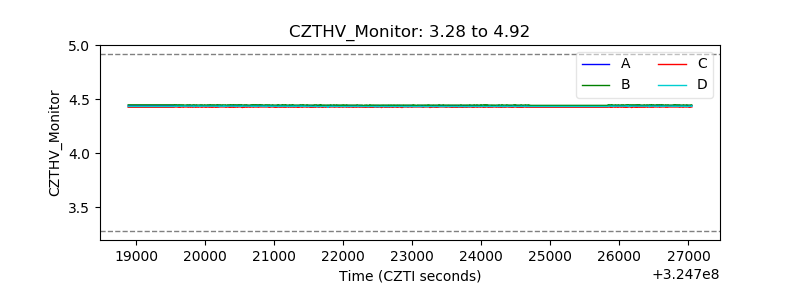 |
| D_VDD | 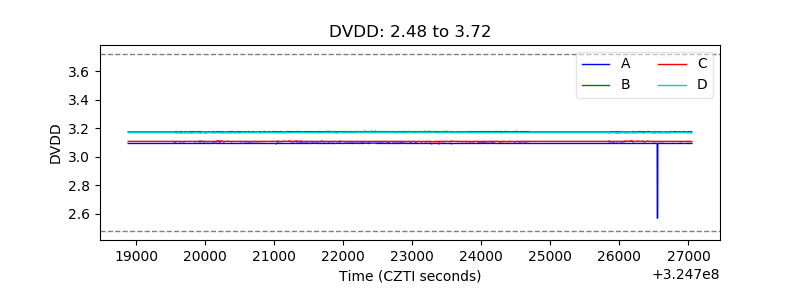 |
| Temperature 1 | 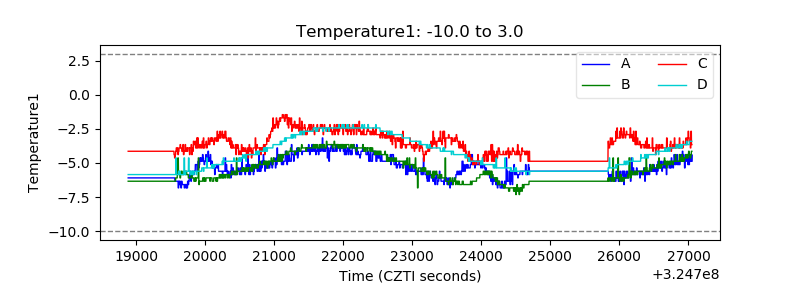 |
| Veto HV Monitor | 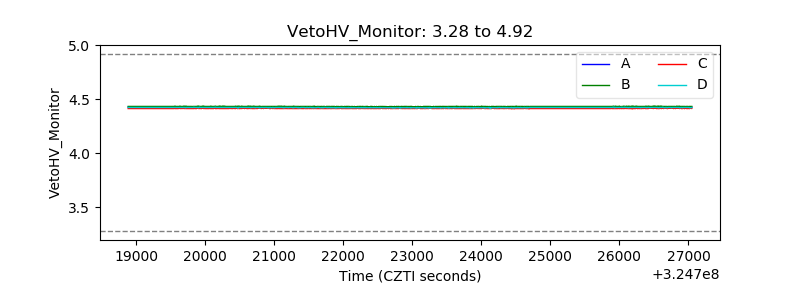 |
| Veto LLD | 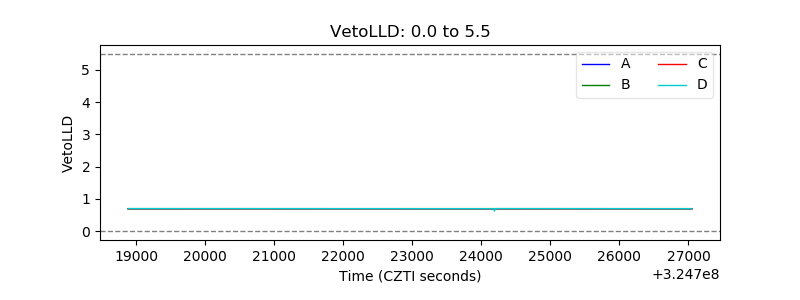 |
| Alpha Counter | 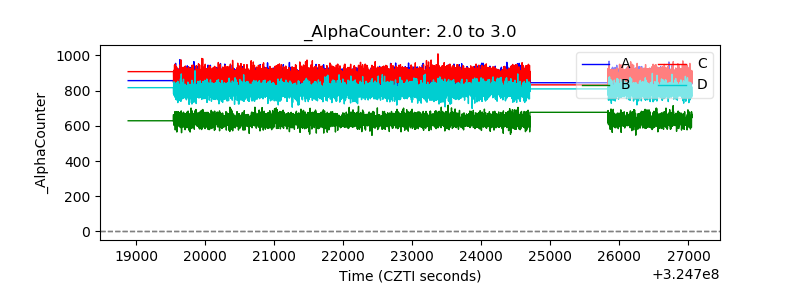 |
| _CPM_Rate | 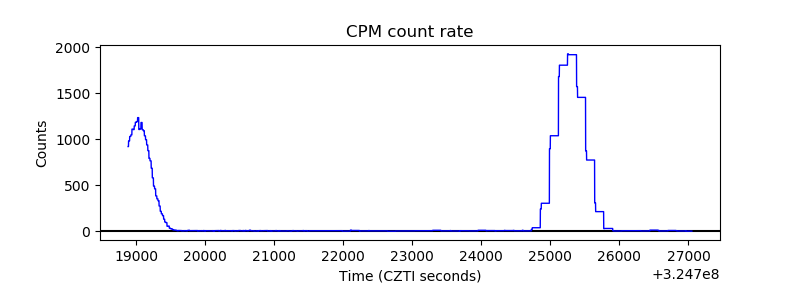 |
| CZT Counter | 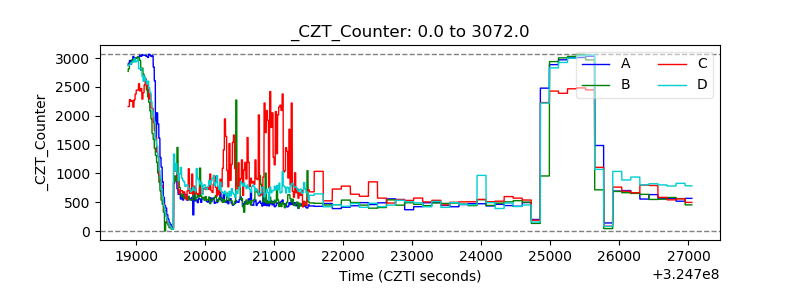 |
| +2.5 Volts monitor |  |
| +5 Volts monitor |  |
| _ROLL_ROT | 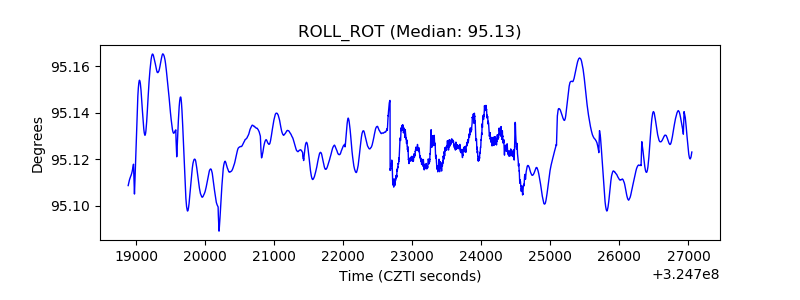 |
| _Roll_DEC | 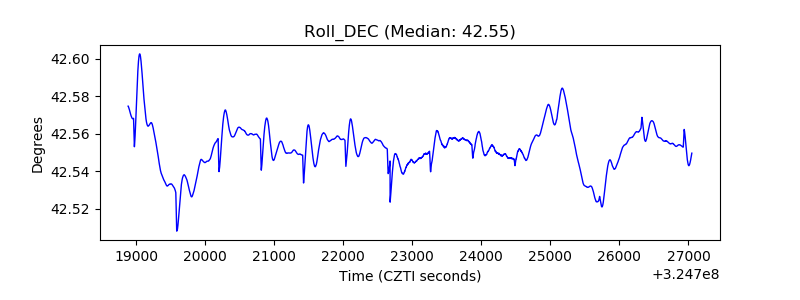 |
| _Roll_RA | 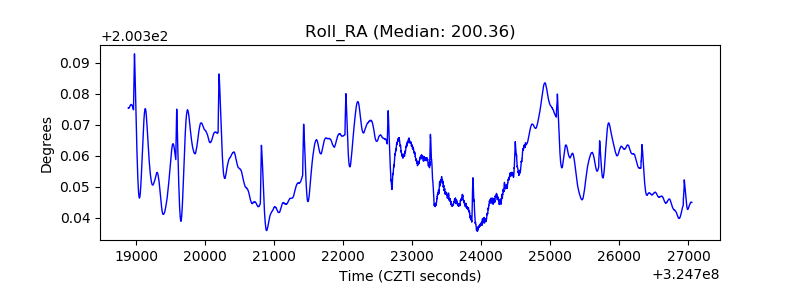 |
| Veto Counter | 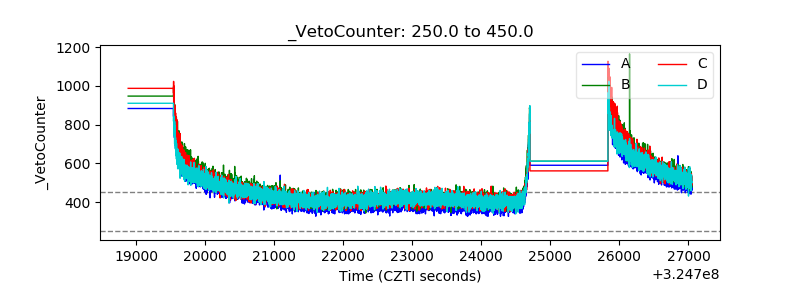 |