| Param | Original file | Final file |
|---|---|---|
| Filename | modeM0/AS1T03_189T01_9000003614_24607cztM0_level2.evt | modeM0/AS1T03_189T01_9000003614_24607cztM0_level2_quad_clean.evt |
| Size (bytes) | 591,431,040 | 111,130,560 |
| Size | 564.0 MB | 106.0 MB |
| Events in quadrant A | 3,614,537 | 751,522 |
| Events in quadrant B | 3,728,720 | 758,647 |
| Events in quadrant C | 5,954,657 | 701,196 |
| Events in quadrant D | 4,182,554 | 709,931 |
| Mode M9 | |||
|---|---|---|---|
| Quadrant | BADHDUFLAG | Total packets | Discarded packets |
| A | 0 | 24 | 0 |
| B | 0 | 25 | 0 |
| C | 0 | 25 | 0 |
| D | 0 | 25 | 0 |
| Mode M0 | |||
|---|---|---|---|
| Quadrant | BADHDUFLAG | Total packets | Discarded packets |
| A | 0 | 14915 | 2 |
| B | 0 | 15322 | 2 |
| C | 0 | 22276 | 2 |
| D | 0 | 16502 | 2 |
| Mode SS | |||
|---|---|---|---|
| Quadrant | BADHDUFLAG | Total packets | Discarded packets |
| A | 0 | 130 | 0 |
| B | 0 | 130 | 0 |
| C | 0 | 130 | 0 |
| D | 0 | 130 | 0 |
| Quadrant | Total seconds | Saturated seconds | Saturation percentage |
|---|---|---|---|
| A | 6368 | 134 | 2.104271% |
| B | 6368 | 178 | 2.795226% |
| C | 6368 | 579 | 9.092337% |
| D | 6368 | 165 | 2.591080% |
Noise dominated data is calculated using 1-second bins in cleaned event files. If a bin has >2000 counts, and if more than 50% of those come from <1% of pixels, then it is considered to be noise-dominated and hence unusable.
| Quadrant | # 1 sec bins | Bins with >0 counts | Bins with >2000 counts | High rate bins dominated by noise | Noise dominated (total time) | Noise dominated (detector-on time) | Marked lightcurve |
|---|---|---|---|---|---|---|---|
| A | 7673 | 6368 | 0 | 0 | 0.00% | 0.00% | 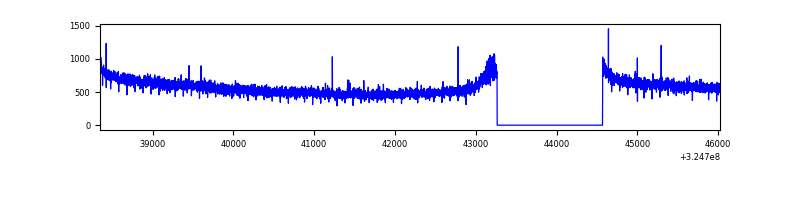 |
| B | 7673 | 6368 | 13 | 13 | 0.17% | 0.20% | 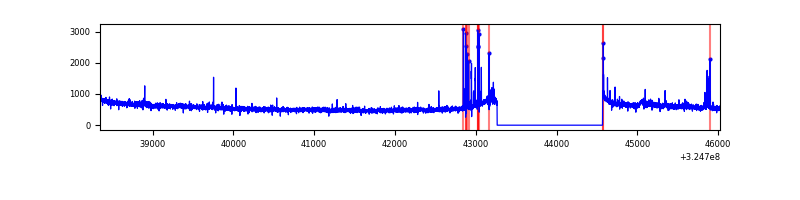 |
| C | 7673 | 6368 | 134 | 134 | 1.75% | 2.10% | 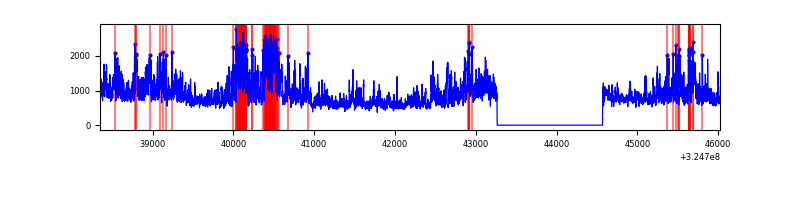 |
| D | 7673 | 6368 | 2 | 2 | 0.03% | 0.03% | 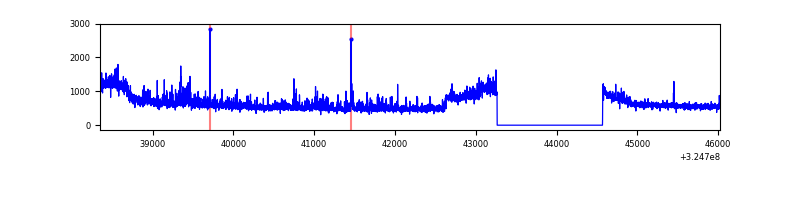 |
Top three noisy pixels from each quadrant. If the there are fewer than three noisy pixels in the level2.evt file, extra rows are filled as -1
| Pixel properties | Quadrant properties | ||||||
|---|---|---|---|---|---|---|---|
| Quadrant | DetID | PixID | Counts | Sigma | Mean | Median | Sigma |
| A | 0 | 226 | 8211 | 39.72 | 936 | 922 | 183.5 |
| A | 13 | 254 | 7695 | 36.91 | 936 | 922 | 183.5 |
| A | 12 | 96 | 7619 | 36.49 | 936 | 922 | 183.5 |
| B | 3 | 64 | 138243 | 814.71 | 913 | 891 | 168.6 |
| B | 12 | 111 | 19729 | 111.74 | 913 | 891 | 168.6 |
| B | 11 | 111 | 18042 | 101.73 | 913 | 891 | 168.6 |
| C | 7 | 247 | 2319640 | 11551.02 | 885 | 895 | 200.7 |
| C | 14 | 238 | 142493 | 705.38 | 885 | 895 | 200.7 |
| C | 3 | 233 | 24500 | 117.59 | 885 | 895 | 200.7 |
| D | 13 | 104 | 417028 | 1923.04 | 912 | 891 | 216.4 |
| D | 8 | 195 | 263459 | 1213.37 | 912 | 891 | 216.4 |
| D | 13 | 172 | 33988 | 152.95 | 912 | 891 | 216.4 |
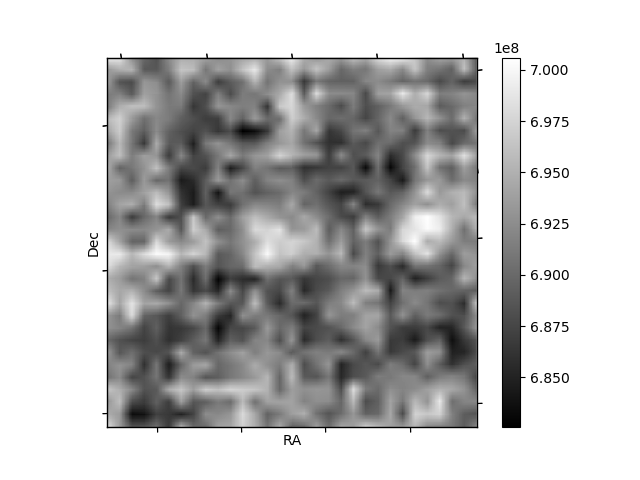
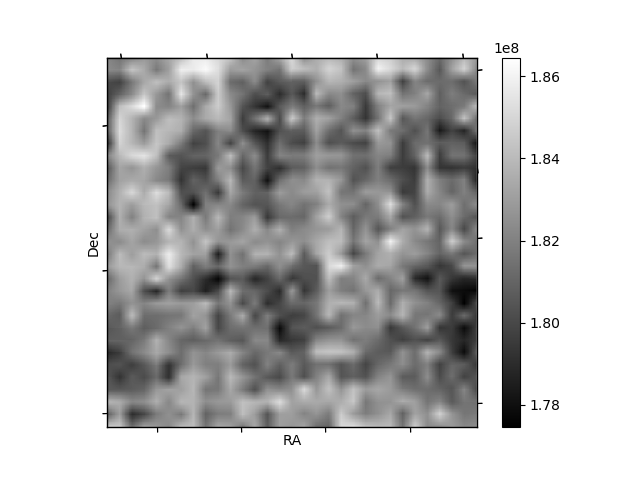
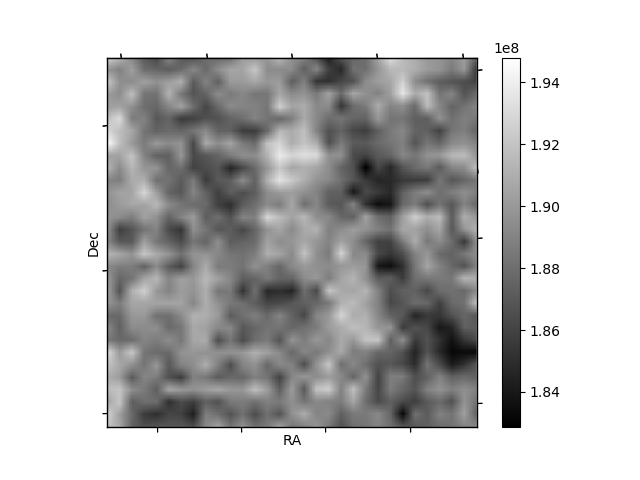
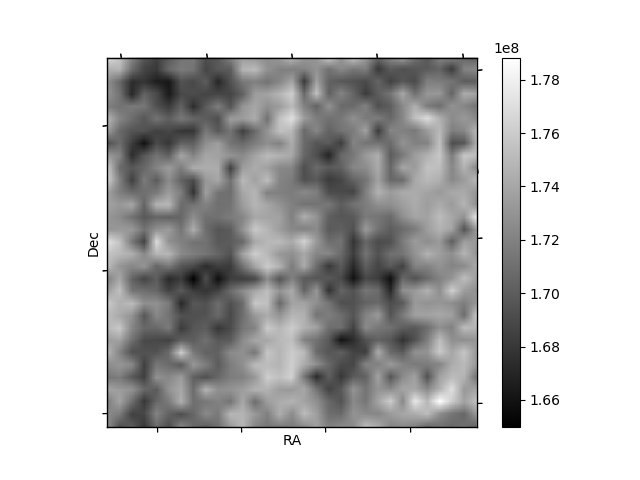
Histogram calculated using DETX and DETY for each event in the final _common_clean file
| Quadrant A | 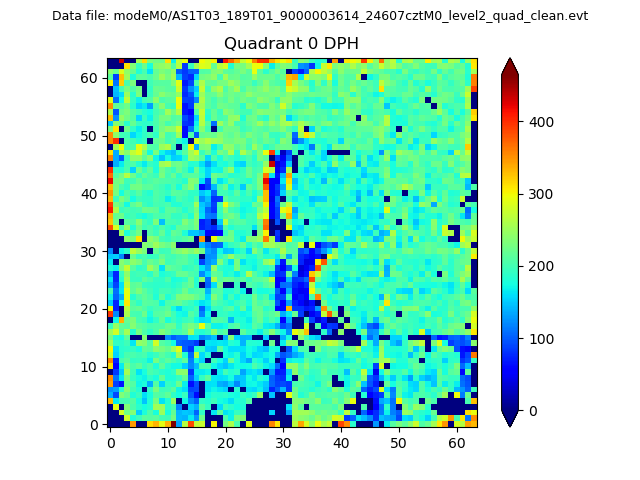 |
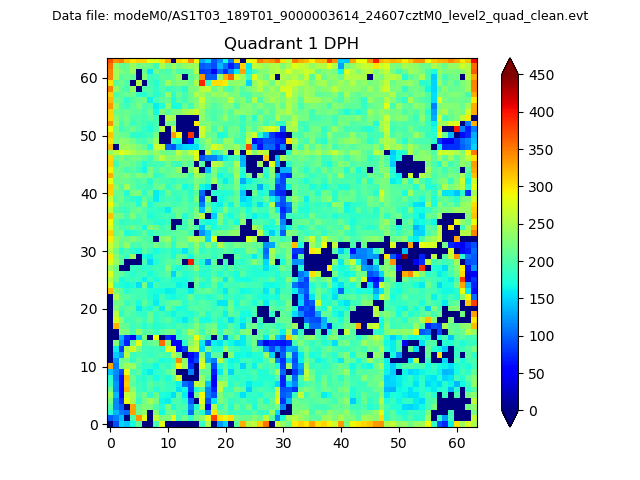 |
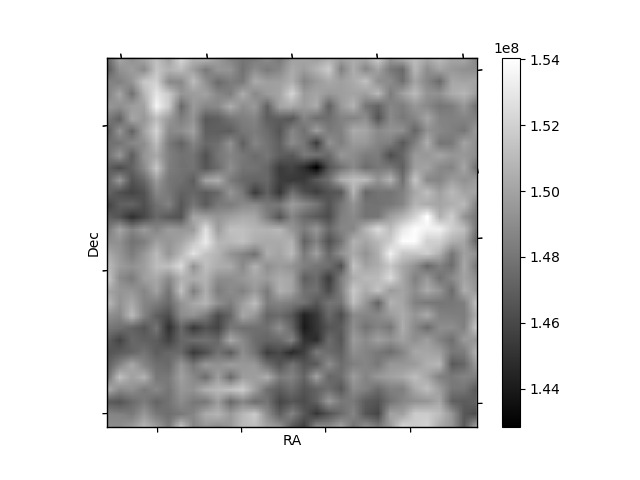
Quadrant B |
|---|---|---|---|
| Quadrant D | 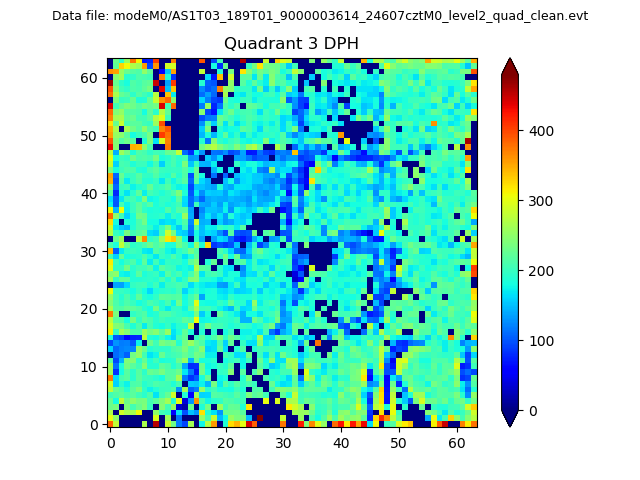 |
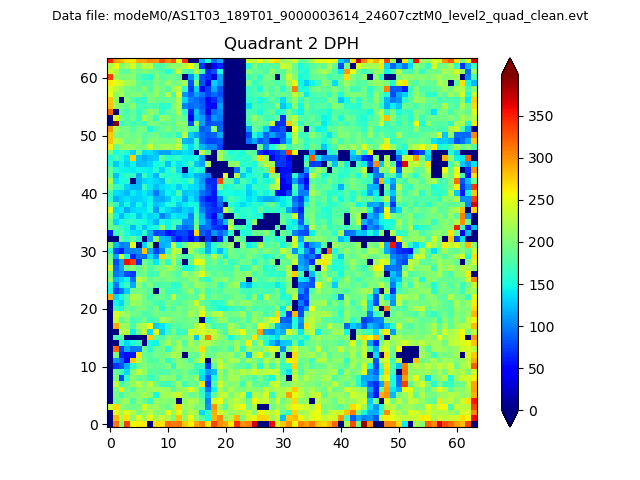 |
Quadrant C |
| Plot type | Count rate plots | Images |
|---|---|---|
| Comparison with Poisson distribution Blue bars denote a histogram of data divided into 1 sec bins. Red curve is a Poisson curve with rate = median count rate of data. |
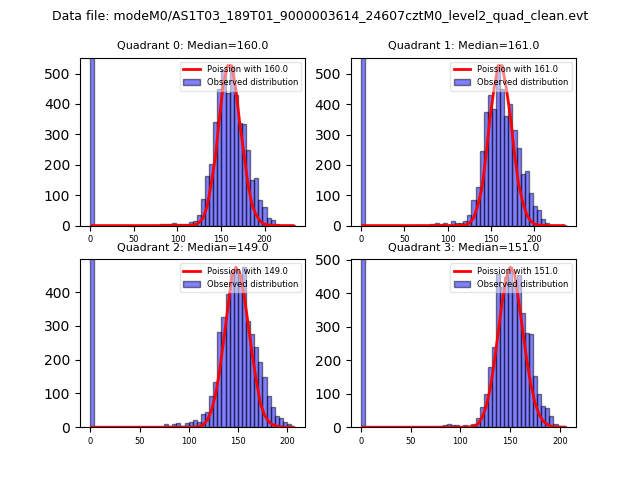 |
 |
| Quadrant-wise count rates Data is divided into 100 sec bins |
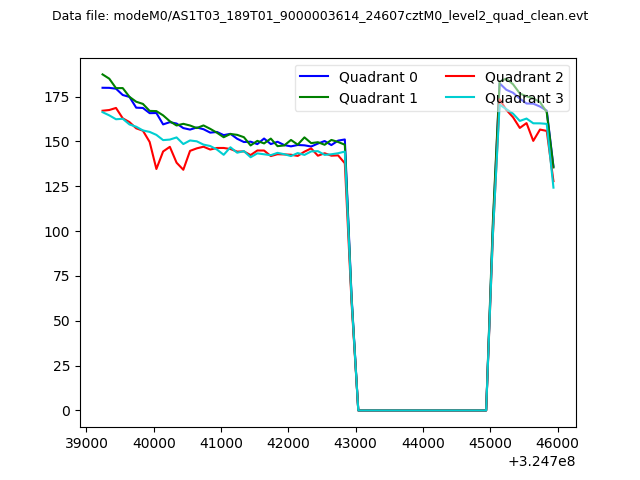 |
|
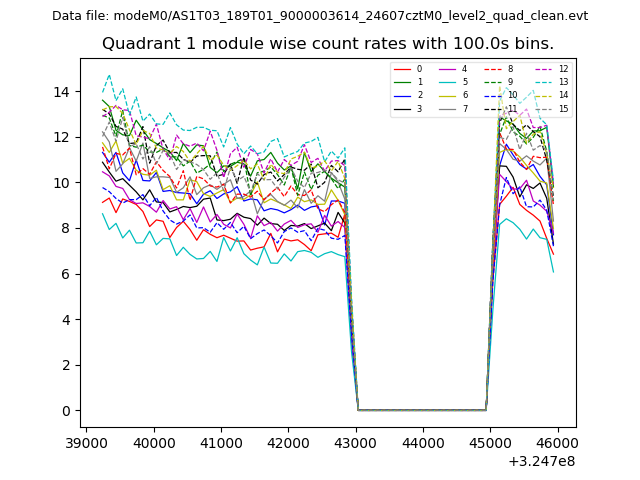
| Module-wise count rates for Quadrant A Data is divided into 100 sec bins |
 |
 |
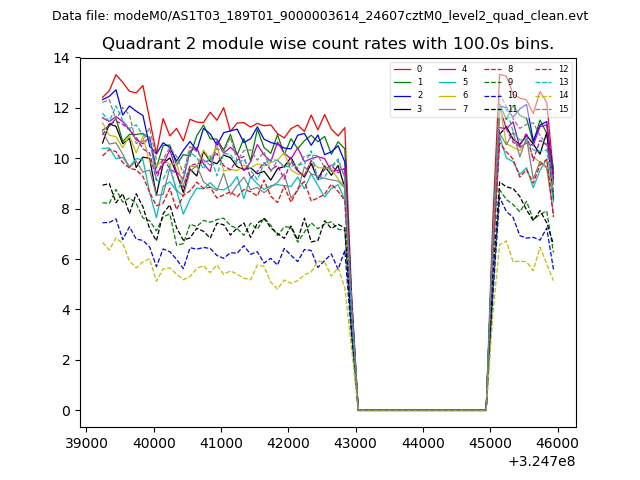
| Module-wise count rates for Quadrant B Data is divided into 100 sec bins |
 |
 |
| Module-wise count rates for Quadrant C Data is divided into 100 sec bins |
 |
 |
| Module-wise count rates for Quadrant D Data is divided into 100 sec bins |
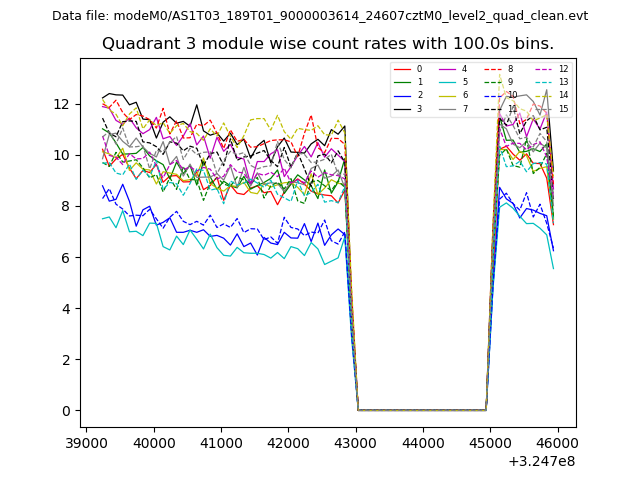 |
 |
| Parameter | Plot |
|---|---|
| CZT HV Monitor | 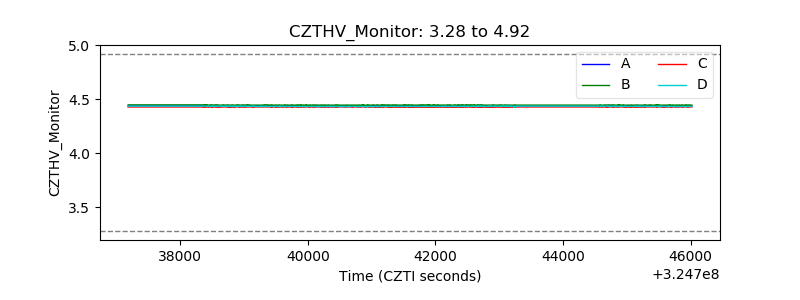 |
| D_VDD | 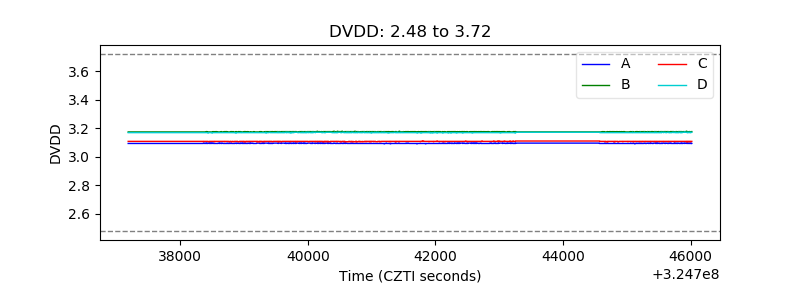 |
| Temperature 1 | 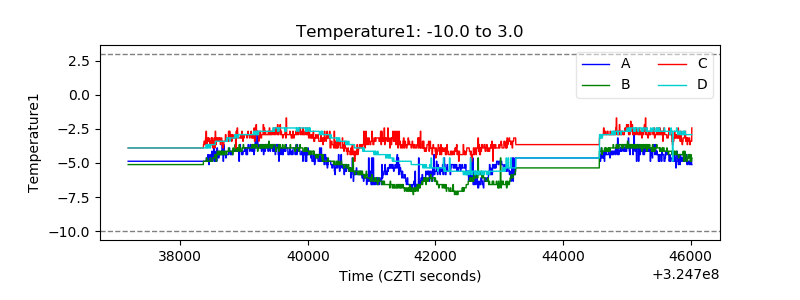 |
| Veto HV Monitor | 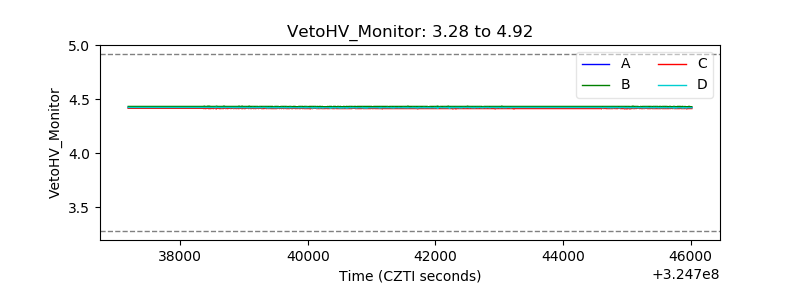 |
| Veto LLD | 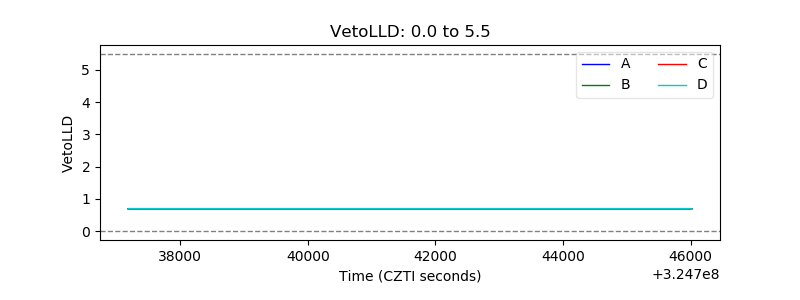 |
| Alpha Counter | 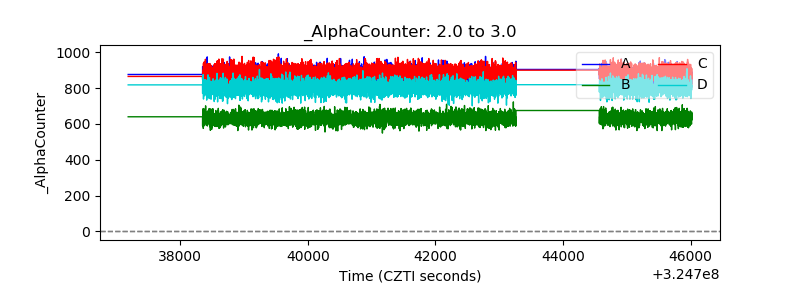 |
| _CPM_Rate | 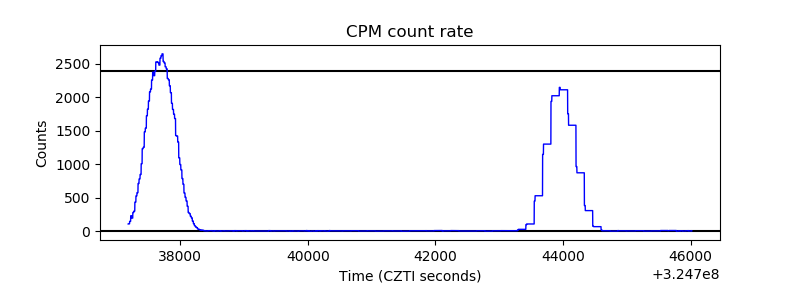 |
| CZT Counter |  |
| +2.5 Volts monitor |  |
| +5 Volts monitor |  |
| _ROLL_ROT | 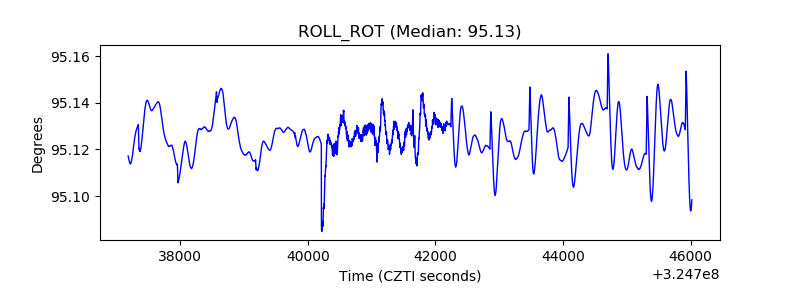 |
| _Roll_DEC | 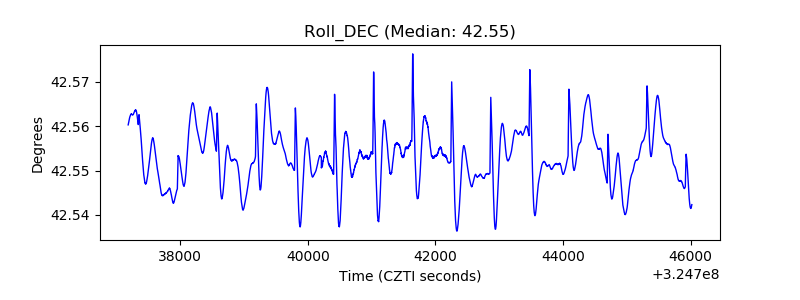 |
| _Roll_RA | 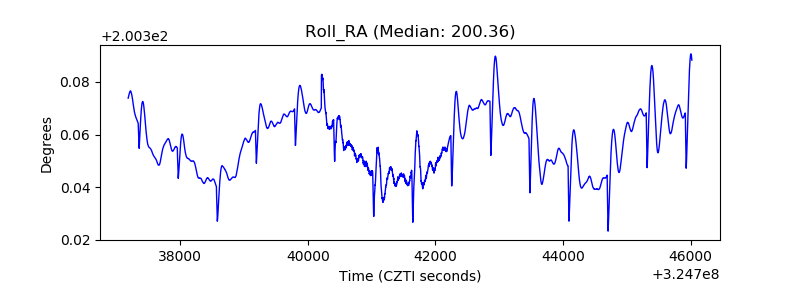 |
| Veto Counter |  |