| Param | Original file | Final file |
|---|---|---|
| Filename | modeM0/AS1T03_189T01_9000003614_24608cztM0_level2.evt | modeM0/AS1T03_189T01_9000003614_24608cztM0_level2_quad_clean.evt |
| Size (bytes) | 526,334,400 | 113,417,280 |
| Size | 502.0 MB | 108.2 MB |
| Events in quadrant A | 3,302,810 | 769,691 |
| Events in quadrant B | 3,746,029 | 773,409 |
| Events in quadrant C | 4,542,162 | 733,974 |
| Events in quadrant D | 3,937,021 | 733,490 |
| Mode M9 | |||
|---|---|---|---|
| Quadrant | BADHDUFLAG | Total packets | Discarded packets |
| A | 0 | 13 | 0 |
| B | 0 | 13 | 0 |
| C | 0 | 13 | 0 |
| D | 0 | 13 | 0 |
| Mode M0 | |||
|---|---|---|---|
| Quadrant | BADHDUFLAG | Total packets | Discarded packets |
| A | 0 | 13647 | 1 |
| B | 0 | 15110 | 4 |
| C | 0 | 17602 | 1 |
| D | 0 | 15618 | 1 |
| Mode SS | |||
|---|---|---|---|
| Quadrant | BADHDUFLAG | Total packets | Discarded packets |
| A | 0 | 124 | 0 |
| B | 0 | 124 | 0 |
| C | 0 | 124 | 0 |
| D | 0 | 124 | 0 |
| Quadrant | Total seconds | Saturated seconds | Saturation percentage |
|---|---|---|---|
| A | 6078 | 140 | 2.303389% |
| B | 6077 | 232 | 3.817673% |
| C | 6077 | 331 | 5.446766% |
| D | 6077 | 178 | 2.929077% |
Noise dominated data is calculated using 1-second bins in cleaned event files. If a bin has >2000 counts, and if more than 50% of those come from <1% of pixels, then it is considered to be noise-dominated and hence unusable.
| Quadrant | # 1 sec bins | Bins with >0 counts | Bins with >2000 counts | High rate bins dominated by noise | Noise dominated (total time) | Noise dominated (detector-on time) | Marked lightcurve |
|---|---|---|---|---|---|---|---|
| A | 7358 | 6079 | 10 | 10 | 0.14% | 0.16% | 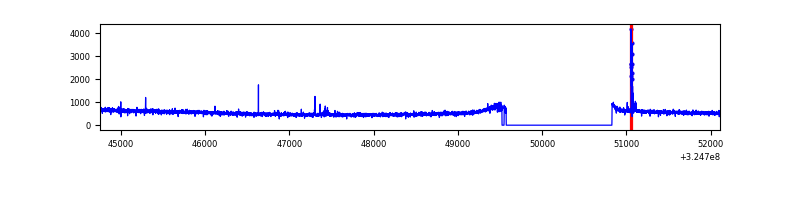 |
| B | 7357 | 6078 | 80 | 80 | 1.09% | 1.32% |  |
| C | 7357 | 6078 | 45 | 45 | 0.61% | 0.74% | 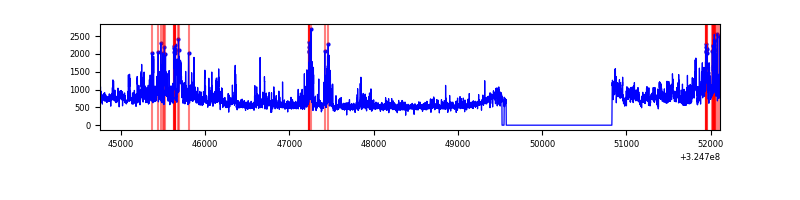 |
| D | 7357 | 6077 | 28 | 28 | 0.38% | 0.46% | 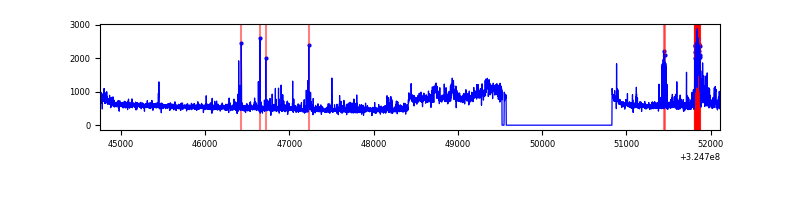 |
Top three noisy pixels from each quadrant. If the there are fewer than three noisy pixels in the level2.evt file, extra rows are filled as -1
| Pixel properties | Quadrant properties | ||||||
|---|---|---|---|---|---|---|---|
| Quadrant | DetID | PixID | Counts | Sigma | Mean | Median | Sigma |
| A | 12 | 96 | 59856 | 360.6 | 839 | 822 | 163.7 |
| A | 13 | 254 | 8344 | 45.95 | 839 | 822 | 163.7 |
| A | 6 | 16 | 7940 | 43.48 | 839 | 822 | 163.7 |
| B | 3 | 64 | 489440 | 3195.15 | 822 | 804 | 152.9 |
| B | 7 | 202 | 25170 | 159.33 | 822 | 804 | 152.9 |
| B | 12 | 111 | 18073 | 112.92 | 822 | 804 | 152.9 |
| C | 7 | 247 | 1211828 | 6461.96 | 811 | 816 | 187.4 |
| C | 14 | 238 | 128694 | 682.36 | 811 | 816 | 187.4 |
| C | 3 | 233 | 28513 | 147.79 | 811 | 816 | 187.4 |
| D | 13 | 104 | 371363 | 1883.55 | 825 | 804 | 196.7 |
| D | 8 | 195 | 157289 | 795.41 | 825 | 804 | 196.7 |
| D | 1 | 52 | 151811 | 767.57 | 825 | 804 | 196.7 |
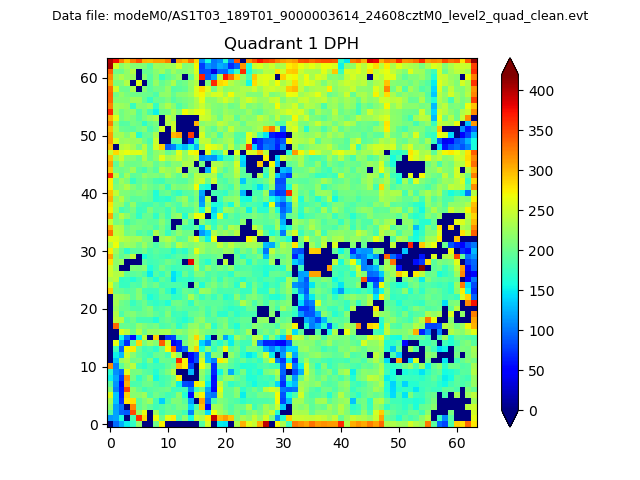
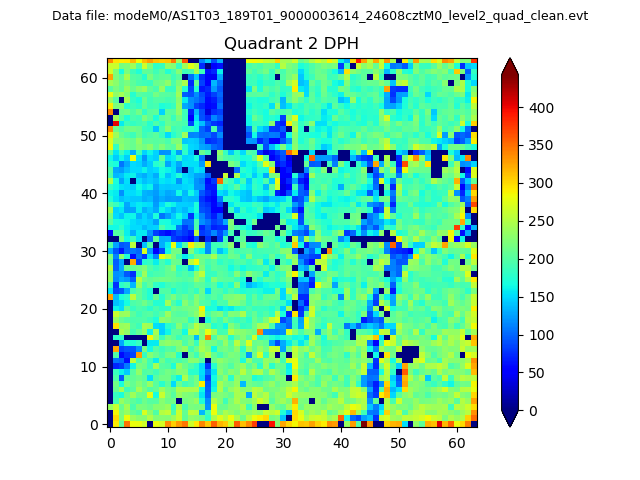
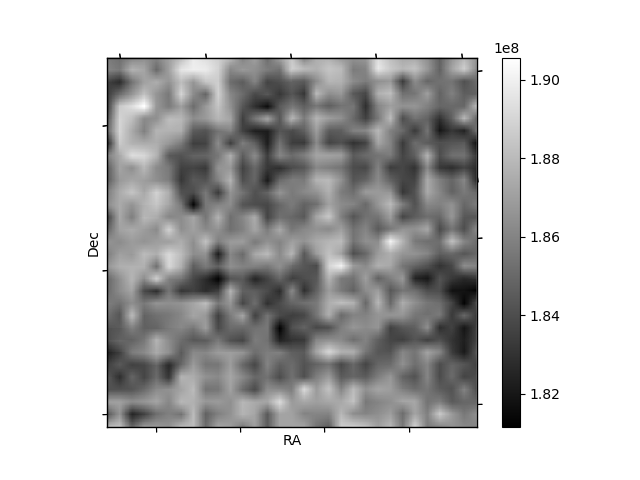
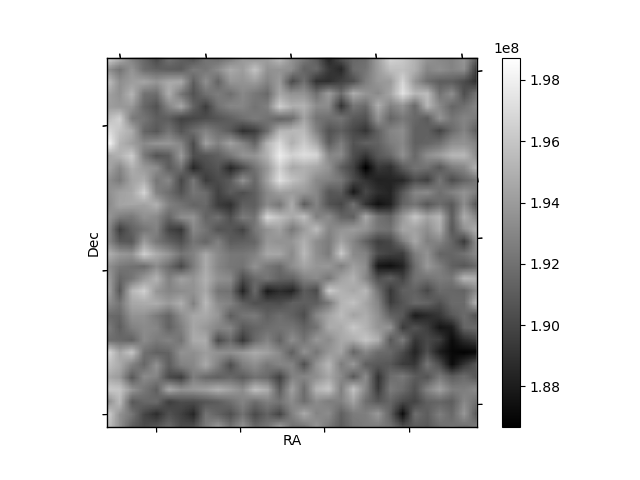
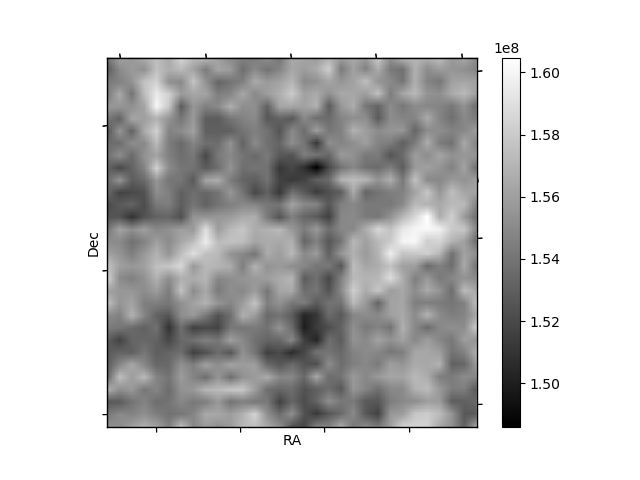
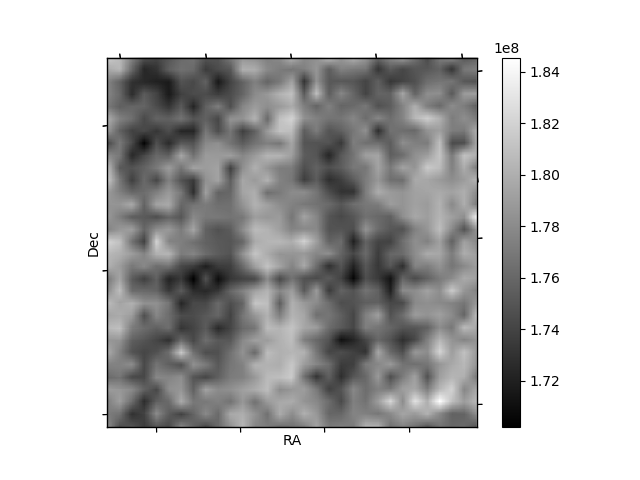
Histogram calculated using DETX and DETY for each event in the final _common_clean file
| Quadrant A | 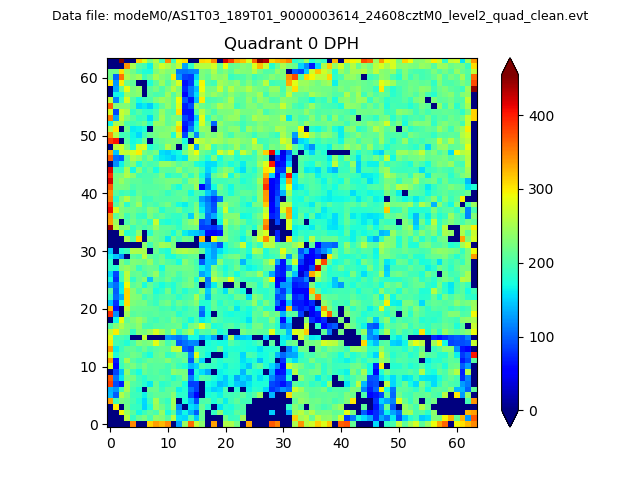 |
 |
Quadrant B |
|---|---|---|---|
| Quadrant D | 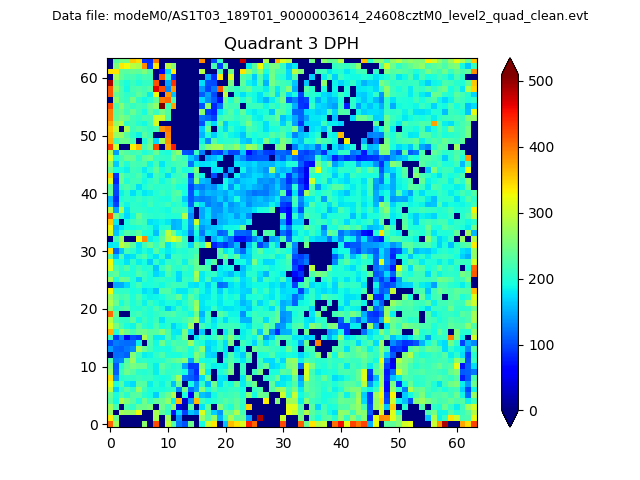 |
 |
Quadrant C |
| Plot type | Count rate plots | Images |
|---|---|---|
| Comparison with Poisson distribution Blue bars denote a histogram of data divided into 1 sec bins. Red curve is a Poisson curve with rate = median count rate of data. |
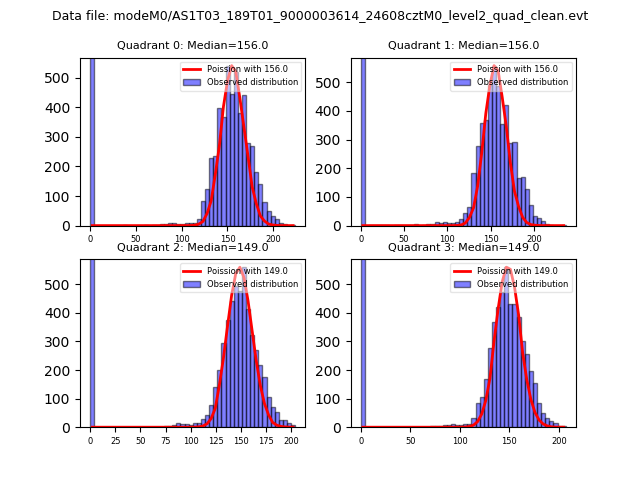 |
 |
| Quadrant-wise count rates Data is divided into 100 sec bins |
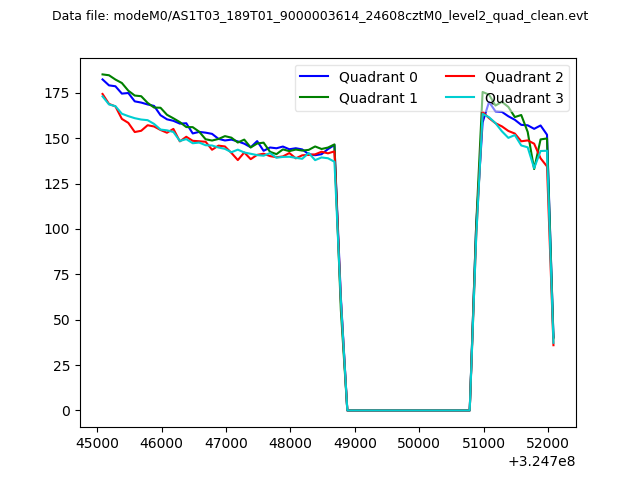 |
|
| Module-wise count rates for Quadrant A Data is divided into 100 sec bins |
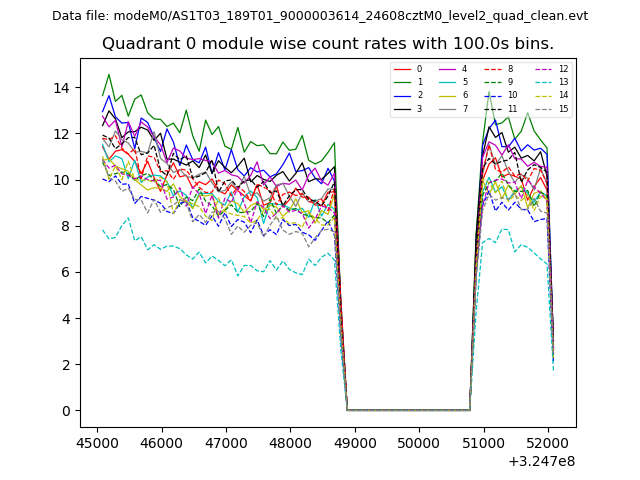 |
 |
| Module-wise count rates for Quadrant B Data is divided into 100 sec bins |
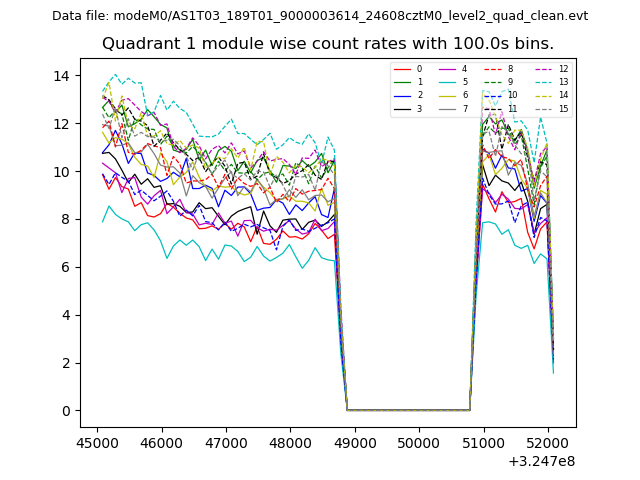 |
 |
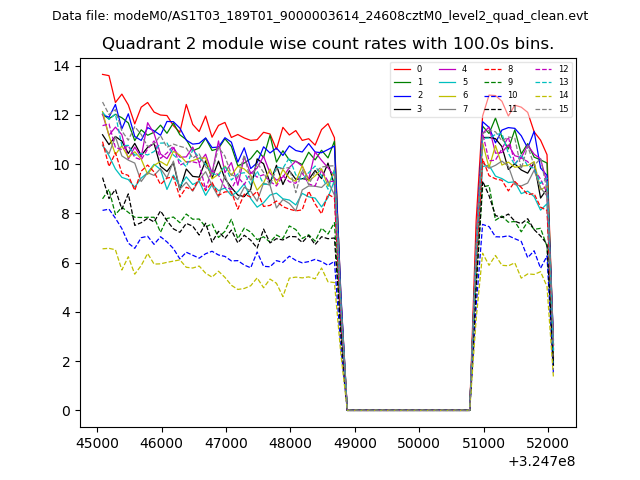
| Module-wise count rates for Quadrant C Data is divided into 100 sec bins |
 |
 |
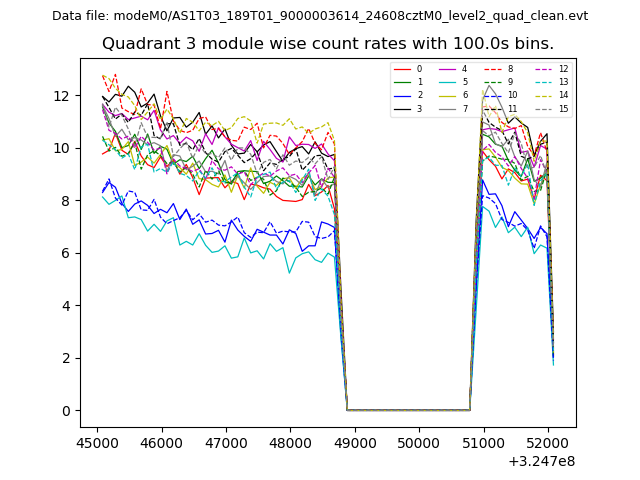
| Module-wise count rates for Quadrant D Data is divided into 100 sec bins |
 |
 |
| Parameter | Plot |
|---|---|
| CZT HV Monitor | 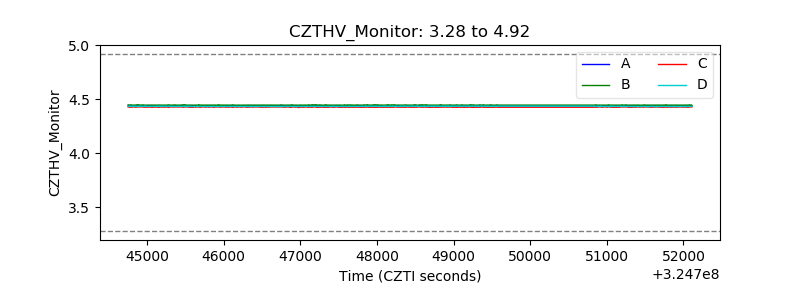 |
| D_VDD | 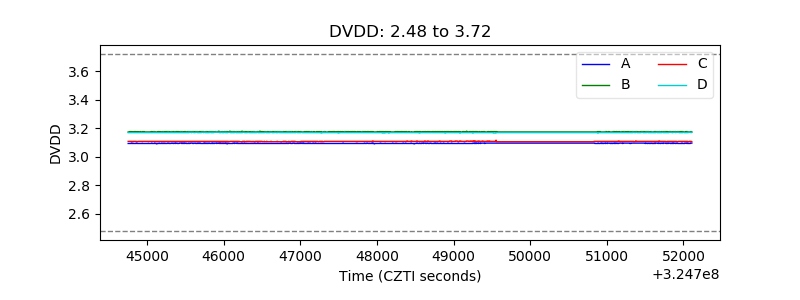 |
| Temperature 1 | 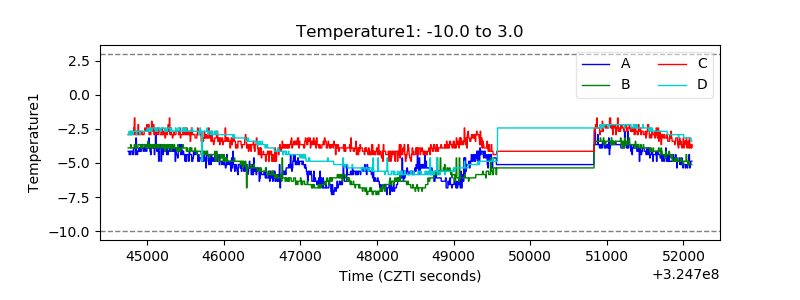 |
| Veto HV Monitor |  |
| Veto LLD | 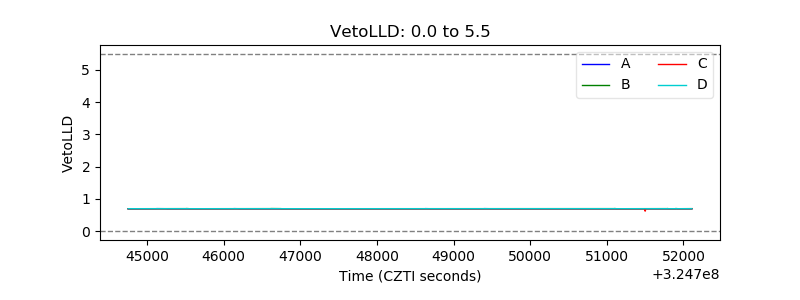 |
| Alpha Counter | 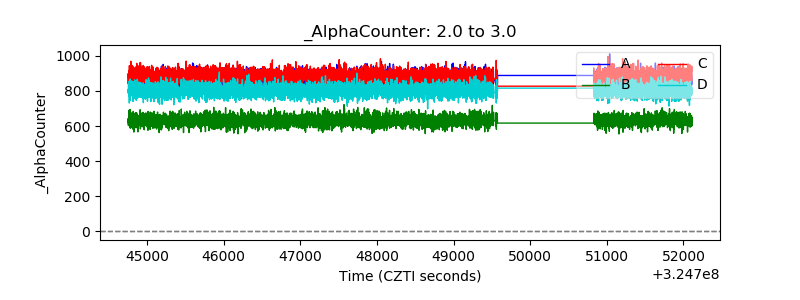 |
| _CPM_Rate | 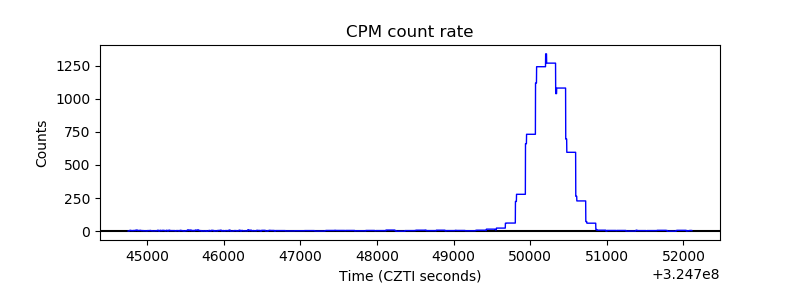 |
| CZT Counter | 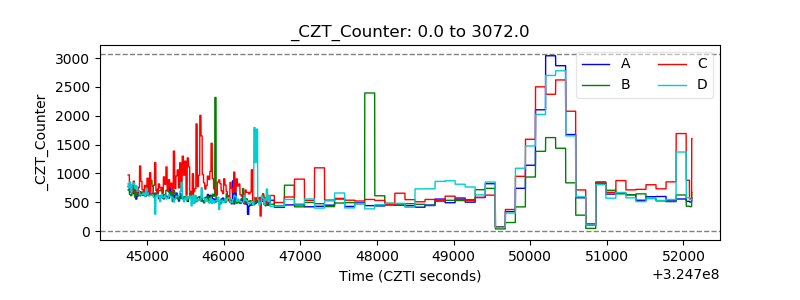 |
| +2.5 Volts monitor |  |
| +5 Volts monitor |  |
| _ROLL_ROT | 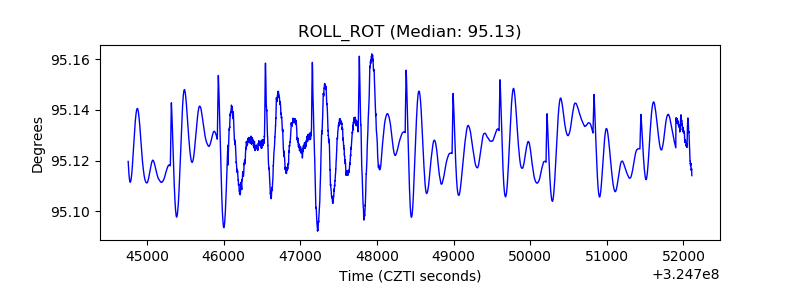 |
| _Roll_DEC | 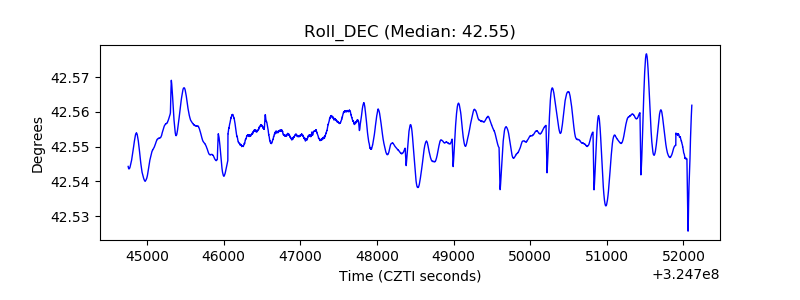 |
| _Roll_RA |  |
| Veto Counter | 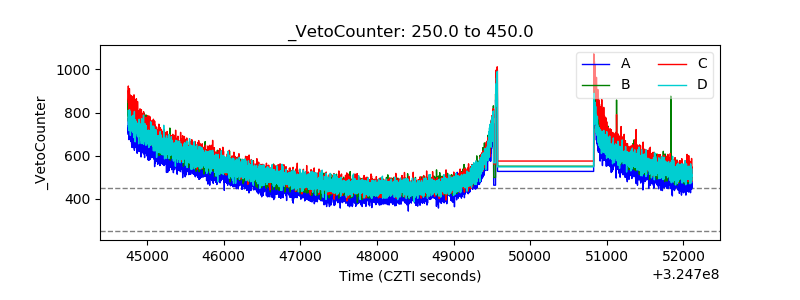 |