| Param | Original file | Final file |
|---|---|---|
| Filename | modeM0/AS1T03_189T01_9000003614_24609cztM0_level2.evt | modeM0/AS1T03_189T01_9000003614_24609cztM0_level2_quad_clean.evt |
| Size (bytes) | 605,502,720 | 110,338,560 |
| Size | 577.5 MB | 105.2 MB |
| Events in quadrant A | 3,515,425 | 740,501 |
| Events in quadrant B | 5,548,382 | 722,664 |
| Events in quadrant C | 4,630,763 | 714,341 |
| Events in quadrant D | 4,200,168 | 707,662 |
| Mode M9 | |||
|---|---|---|---|
| Quadrant | BADHDUFLAG | Total packets | Discarded packets |
| A | 0 | 25 | 0 |
| B | 0 | 25 | 0 |
| C | 0 | 25 | 0 |
| D | 0 | 25 | 0 |
| Mode M0 | |||
|---|---|---|---|
| Quadrant | BADHDUFLAG | Total packets | Discarded packets |
| A | 0 | 14635 | 2 |
| B | 0 | 20943 | 2 |
| C | 0 | 18424 | 2 |
| D | 0 | 16801 | 2 |
| Mode SS | |||
|---|---|---|---|
| Quadrant | BADHDUFLAG | Total packets | Discarded packets |
| A | 0 | 134 | 0 |
| B | 0 | 134 | 0 |
| C | 0 | 134 | 0 |
| D | 0 | 134 | 0 |
| Quadrant | Total seconds | Saturated seconds | Saturation percentage |
|---|---|---|---|
| A | 6555 | 167 | 2.547674% |
| B | 6555 | 703 | 10.724638% |
| C | 6555 | 286 | 4.363082% |
| D | 6555 | 216 | 3.295195% |
Noise dominated data is calculated using 1-second bins in cleaned event files. If a bin has >2000 counts, and if more than 50% of those come from <1% of pixels, then it is considered to be noise-dominated and hence unusable.
| Quadrant | # 1 sec bins | Bins with >0 counts | Bins with >2000 counts | High rate bins dominated by noise | Noise dominated (total time) | Noise dominated (detector-on time) | Marked lightcurve |
|---|---|---|---|---|---|---|---|
| A | 8925 | 6558 | 26 | 26 | 0.29% | 0.40% | 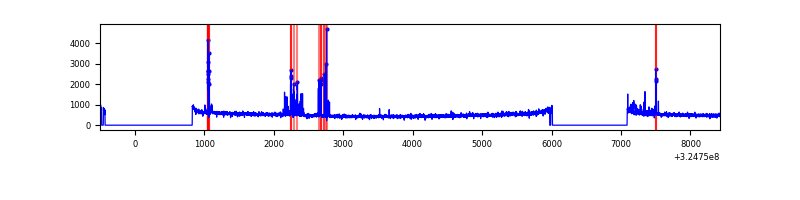 |
| B | 8925 | 6558 | 397 | 397 | 4.45% | 6.05% | 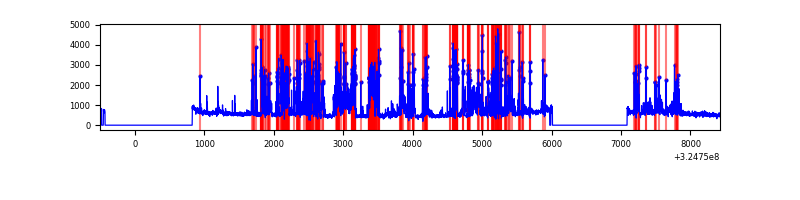 |
| C | 8925 | 6557 | 23 | 23 | 0.26% | 0.35% | 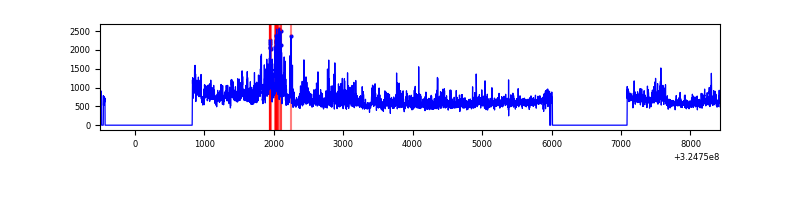 |
| D | 8925 | 6556 | 86 | 86 | 0.96% | 1.31% |  |
Top three noisy pixels from each quadrant. If the there are fewer than three noisy pixels in the level2.evt file, extra rows are filled as -1
| Pixel properties | Quadrant properties | ||||||
|---|---|---|---|---|---|---|---|
| Quadrant | DetID | PixID | Counts | Sigma | Mean | Median | Sigma |
| A | 12 | 96 | 205392 | 1202.08 | 856 | 841 | 170.2 |
| A | 6 | 16 | 10326 | 55.74 | 856 | 841 | 170.2 |
| A | 13 | 254 | 9493 | 50.84 | 856 | 841 | 170.2 |
| B | 3 | 64 | 2273378 | 14582.4 | 826 | 805 | 155.8 |
| B | 12 | 111 | 19126 | 117.56 | 826 | 805 | 155.8 |
| B | 11 | 111 | 17021 | 104.05 | 826 | 805 | 155.8 |
| C | 7 | 247 | 1177056 | 6099.28 | 831 | 838 | 192.8 |
| C | 14 | 238 | 131954 | 679.9 | 831 | 838 | 192.8 |
| C | 3 | 233 | 70257 | 359.97 | 831 | 838 | 192.8 |
| D | 8 | 195 | 353443 | 1749.54 | 843 | 820 | 201.6 |
| D | 9 | 1 | 283444 | 1402.24 | 843 | 820 | 201.6 |
| D | 1 | 255 | 141460 | 697.79 | 843 | 820 | 201.6 |
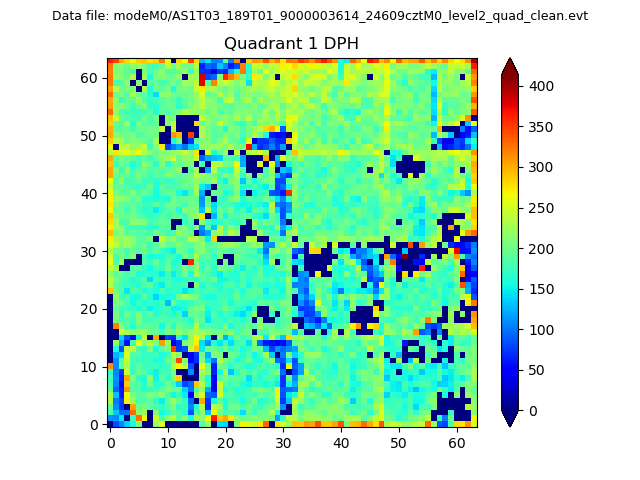
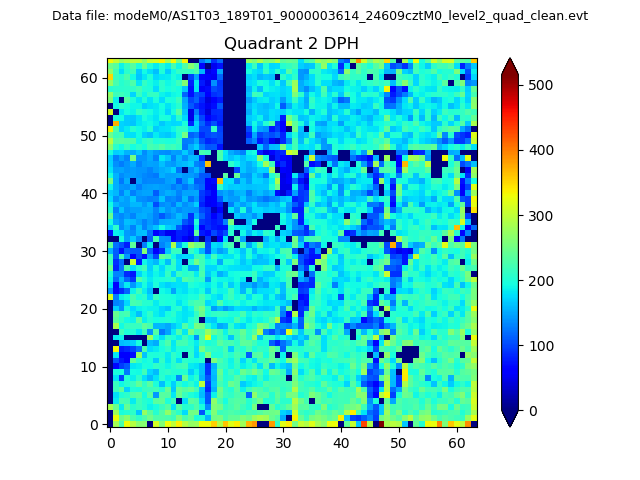
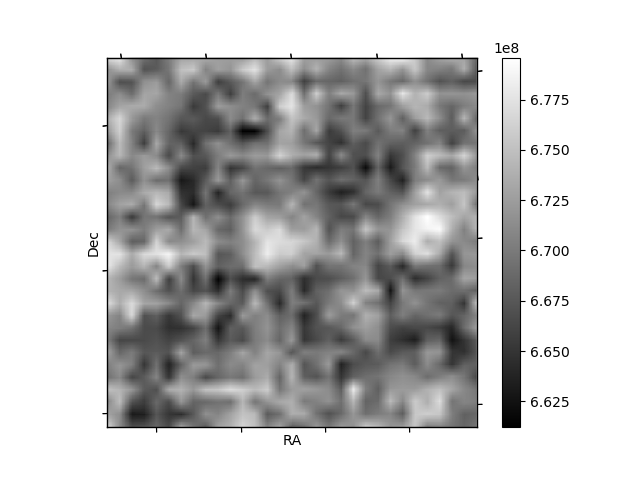
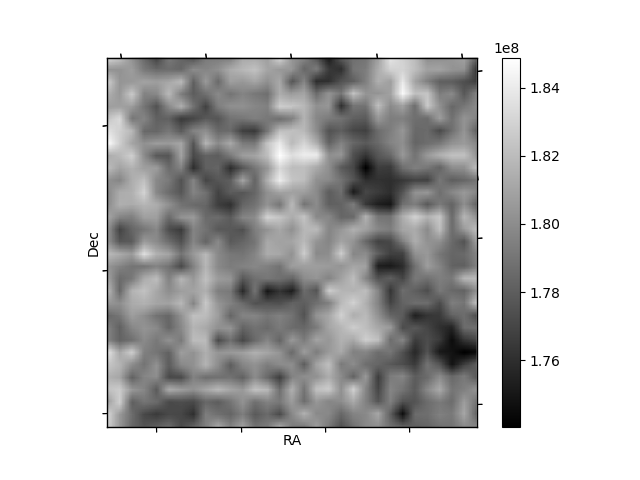
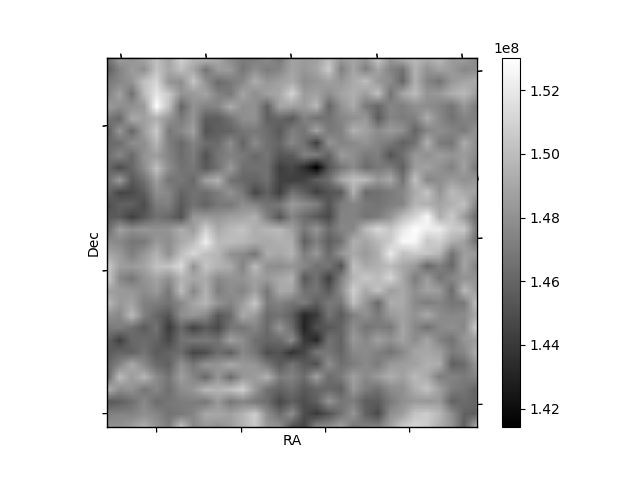
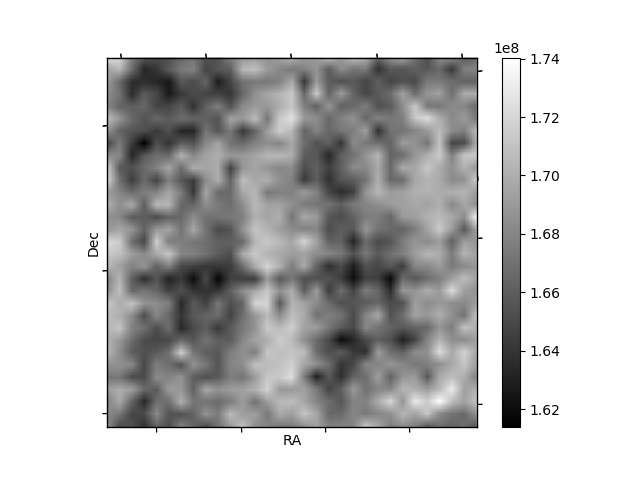
Histogram calculated using DETX and DETY for each event in the final _common_clean file
| Quadrant A | 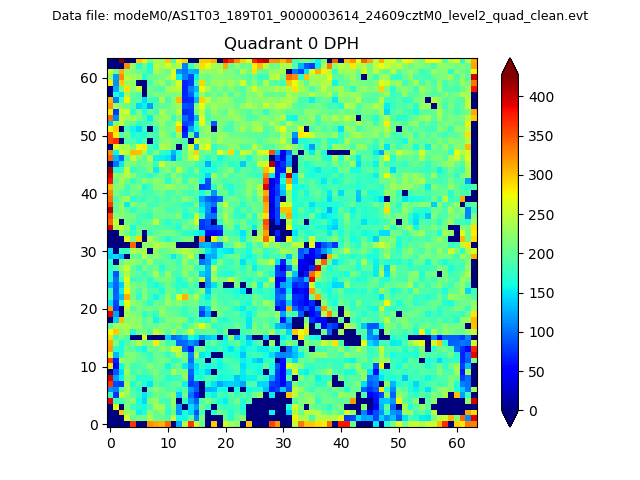 |
 |
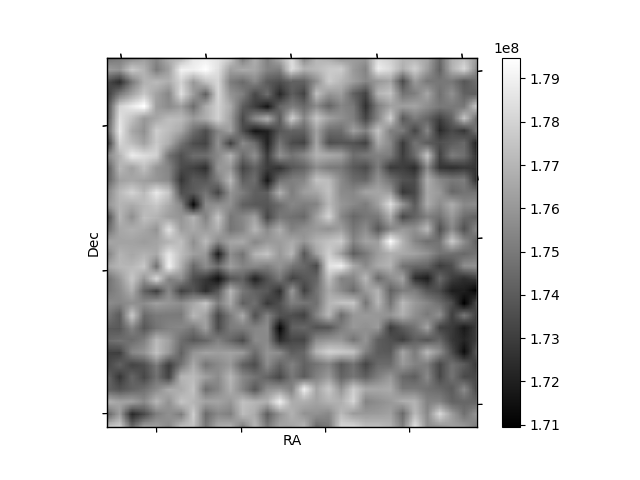
Quadrant B |
|---|---|---|---|
| Quadrant D | 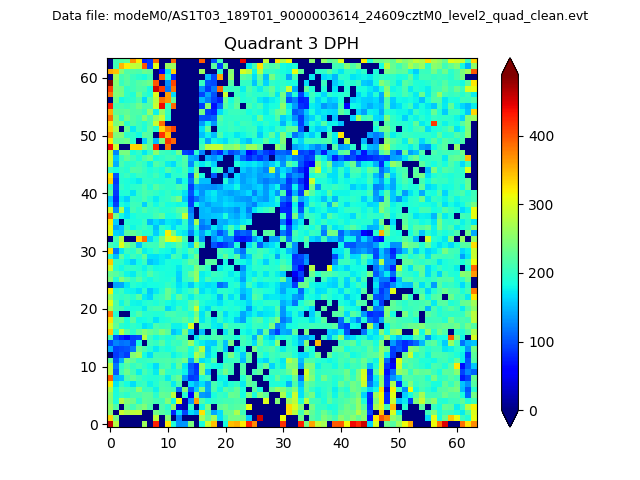 |
 |
Quadrant C |
| Plot type | Count rate plots | Images |
|---|---|---|
| Comparison with Poisson distribution Blue bars denote a histogram of data divided into 1 sec bins. Red curve is a Poisson curve with rate = median count rate of data. |
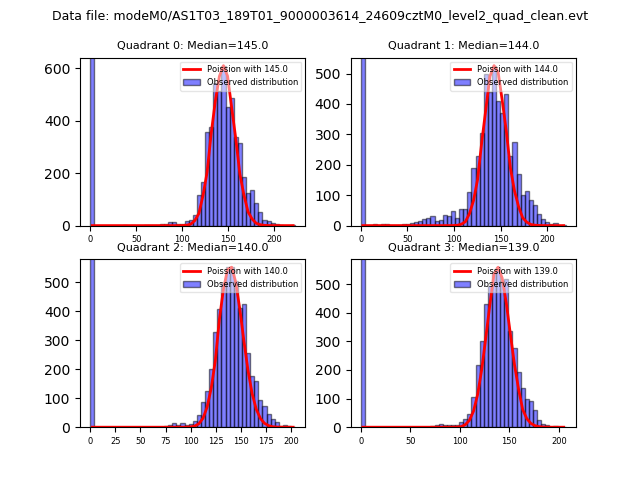 |
 |
| Quadrant-wise count rates Data is divided into 100 sec bins |
 |
|
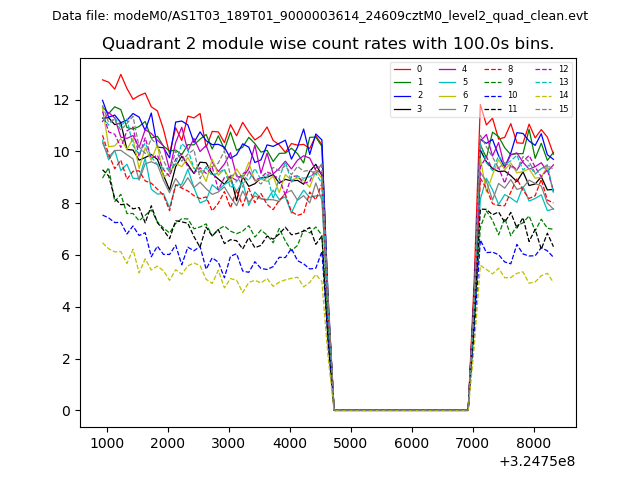
| Module-wise count rates for Quadrant A Data is divided into 100 sec bins |
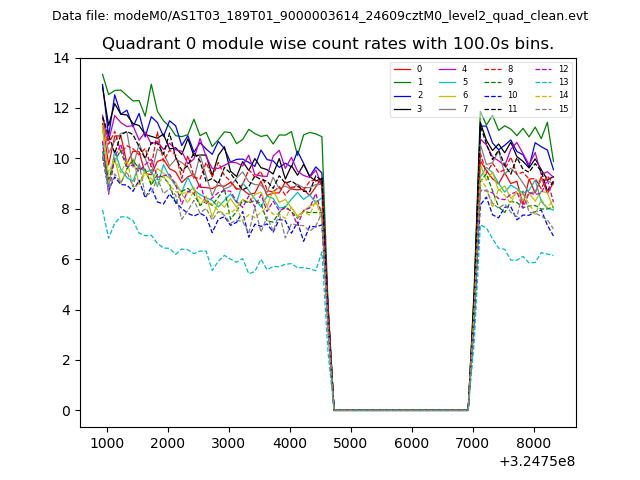 |
 |
| Module-wise count rates for Quadrant B Data is divided into 100 sec bins |
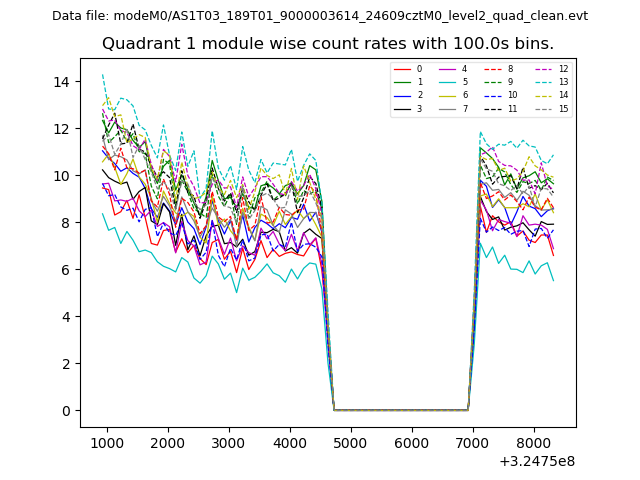 |
 |
| Module-wise count rates for Quadrant C Data is divided into 100 sec bins |
 |
 |
| Module-wise count rates for Quadrant D Data is divided into 100 sec bins |
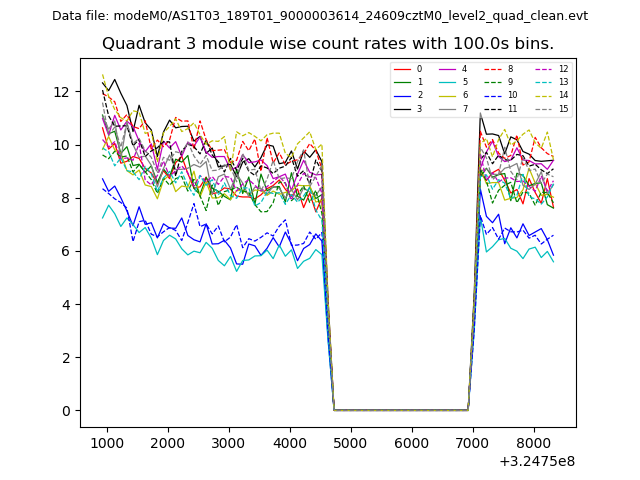 |
 |
| Parameter | Plot |
|---|---|
| CZT HV Monitor | 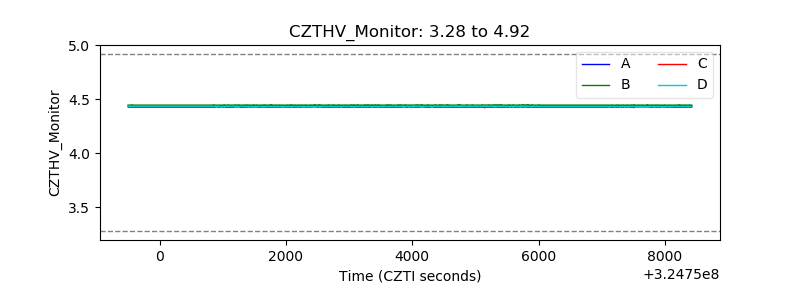 |
| D_VDD | 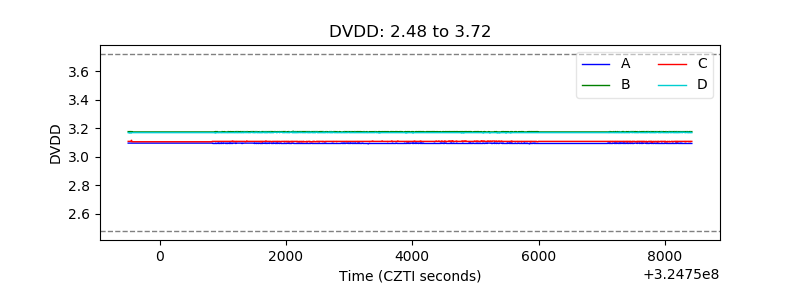 |
| Temperature 1 | 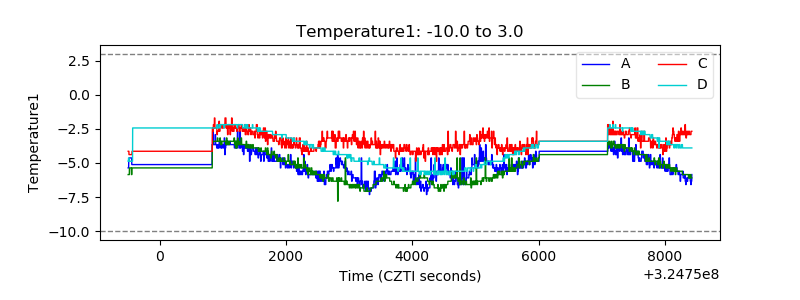 |
| Veto HV Monitor | 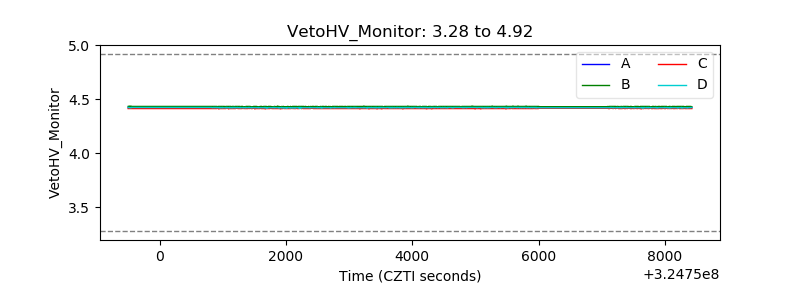 |
| Veto LLD | 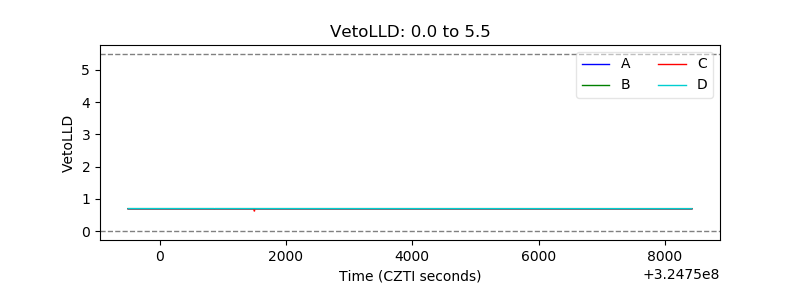 |
| Alpha Counter | 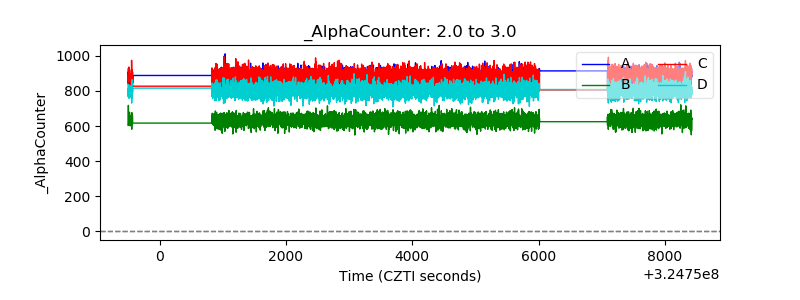 |
| _CPM_Rate | 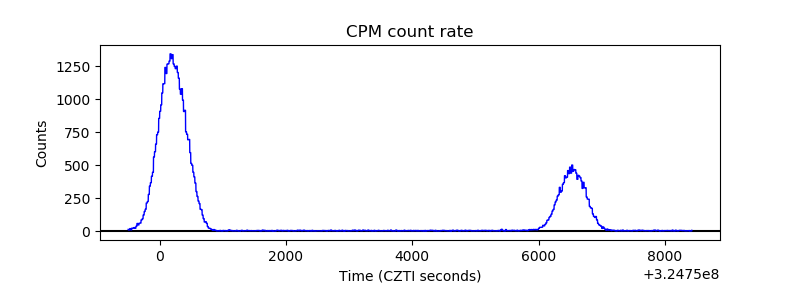 |
| CZT Counter | 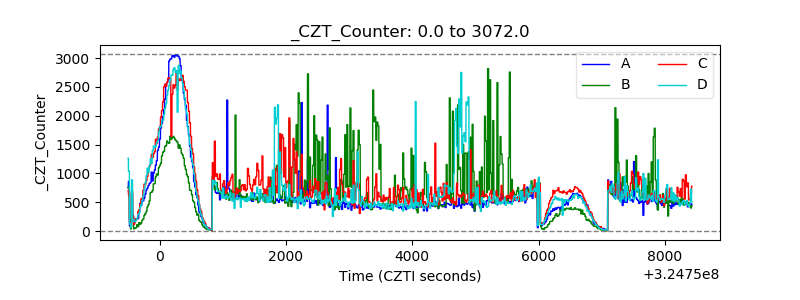 |
| +2.5 Volts monitor |  |
| +5 Volts monitor |  |
| _ROLL_ROT | 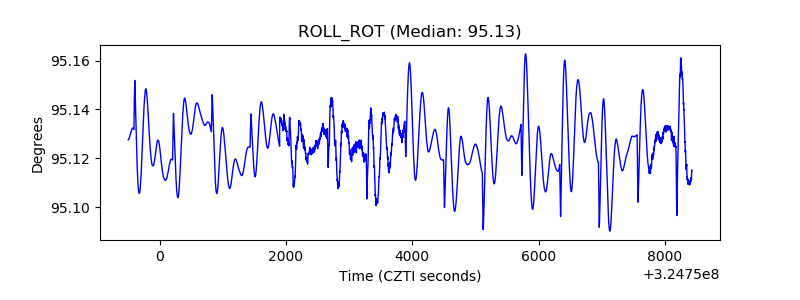 |
| _Roll_DEC | 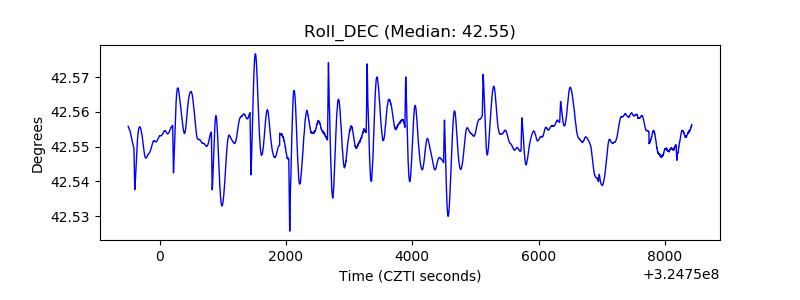 |
| _Roll_RA | 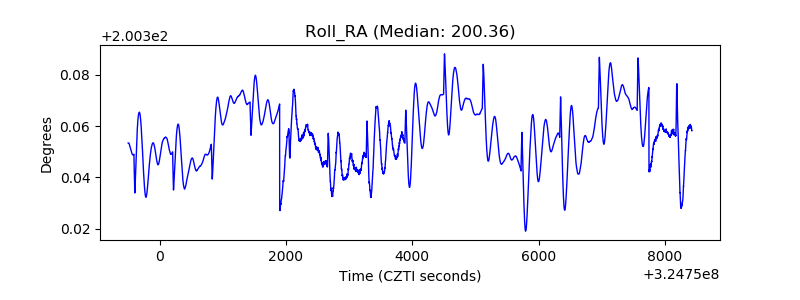 |
| Veto Counter | 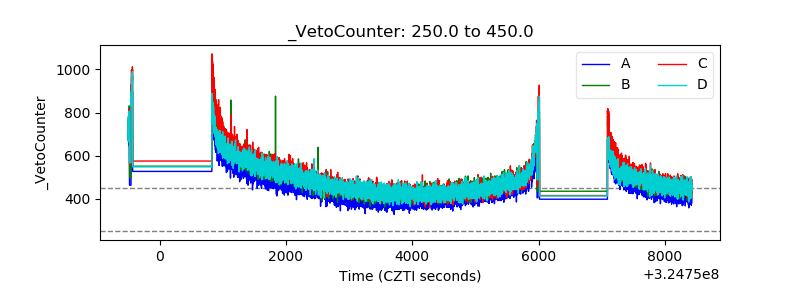 |