| Param | Original file | Final file |
|---|---|---|
| Filename | modeM0/AS1T03_189T01_9000003614_24611cztM0_level2.evt | modeM0/AS1T03_189T01_9000003614_24611cztM0_level2_quad_clean.evt |
| Size (bytes) | 560,842,560 | 110,113,920 |
| Size | 534.9 MB | 105.0 MB |
| Events in quadrant A | 3,619,928 | 722,262 |
| Events in quadrant B | 4,836,309 | 703,894 |
| Events in quadrant C | 4,186,427 | 695,900 |
| Events in quadrant D | 3,831,785 | 688,898 |
| Mode M9 | |||
|---|---|---|---|
| Quadrant | BADHDUFLAG | Total packets | Discarded packets |
| A | 0 | 3 | 0 |
| B | 0 | 4 | 0 |
| C | 0 | 4 | 0 |
| D | 0 | 4 | 0 |
| Mode M0 | |||
|---|---|---|---|
| Quadrant | BADHDUFLAG | Total packets | Discarded packets |
| A | 0 | 15762 | 2 |
| B | 0 | 19289 | 2 |
| C | 0 | 17206 | 3 |
| D | 0 | 16475 | 2 |
| Mode SS | |||
|---|---|---|---|
| Quadrant | BADHDUFLAG | Total packets | Discarded packets |
| A | 0 | 154 | 0 |
| B | 0 | 154 | 0 |
| C | 0 | 154 | 0 |
| D | 0 | 154 | 0 |
| Quadrant | Total seconds | Saturated seconds | Saturation percentage |
|---|---|---|---|
| A | 7522 | 66 | 0.877426% |
| B | 7522 | 495 | 6.580697% |
| C | 7521 | 191 | 2.539556% |
| D | 7521 | 61 | 0.811062% |
Noise dominated data is calculated using 1-second bins in cleaned event files. If a bin has >2000 counts, and if more than 50% of those come from <1% of pixels, then it is considered to be noise-dominated and hence unusable.
| Quadrant | # 1 sec bins | Bins with >0 counts | Bins with >2000 counts | High rate bins dominated by noise | Noise dominated (total time) | Noise dominated (detector-on time) | Marked lightcurve |
|---|---|---|---|---|---|---|---|
| A | 7772 | 7524 | 1 | 1 | 0.01% | 0.01% | 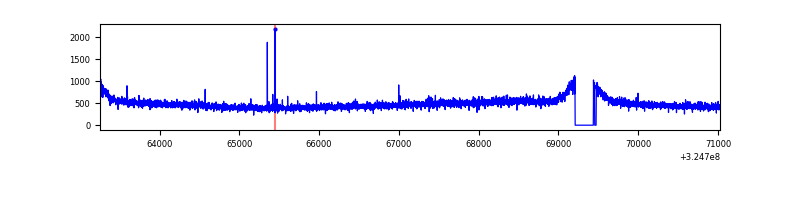 |
| B | 7772 | 7524 | 218 | 218 | 2.80% | 2.90% | 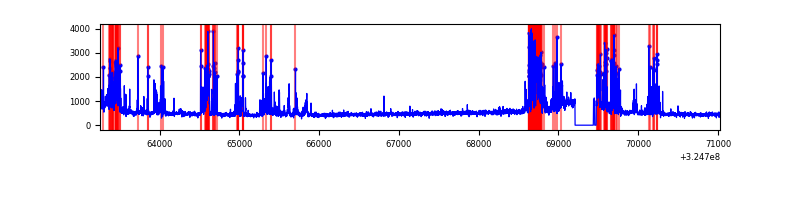 |
| C | 7771 | 7523 | 7 | 7 | 0.09% | 0.09% | 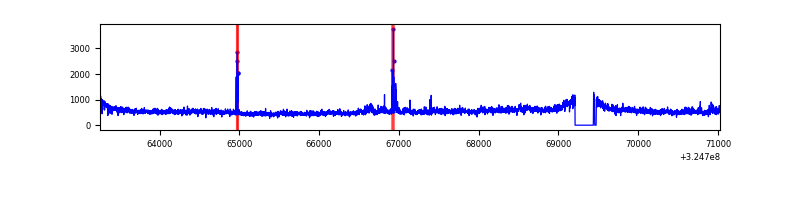 |
| D | 7771 | 7523 | 19 | 19 | 0.24% | 0.25% | 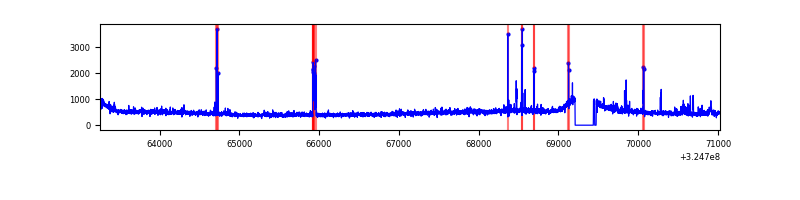 |
Top three noisy pixels from each quadrant. If the there are fewer than three noisy pixels in the level2.evt file, extra rows are filled as -1
| Pixel properties | Quadrant properties | ||||||
|---|---|---|---|---|---|---|---|
| Quadrant | DetID | PixID | Counts | Sigma | Mean | Median | Sigma |
| A | 13 | 254 | 11404 | 55.88 | 936 | 916 | 187.7 |
| A | 3 | 137 | 9164 | 43.95 | 936 | 916 | 187.7 |
| A | 0 | 226 | 7961 | 37.54 | 936 | 916 | 187.7 |
| B | 3 | 64 | 1193566 | 6809.74 | 913 | 888 | 175.1 |
| B | 7 | 202 | 33060 | 183.69 | 913 | 888 | 175.1 |
| B | 12 | 111 | 22119 | 121.22 | 913 | 888 | 175.1 |
| C | 7 | 247 | 425021 | 1997.46 | 906 | 913 | 212.3 |
| C | 14 | 238 | 143516 | 671.63 | 906 | 913 | 212.3 |
| C | 9 | 54 | 36550 | 167.84 | 906 | 913 | 212.3 |
| D | 1 | 52 | 178769 | 794.52 | 917 | 889 | 223.9 |
| D | 8 | 195 | 161073 | 715.48 | 917 | 889 | 223.9 |
| D | 2 | 234 | 33344 | 144.96 | 917 | 889 | 223.9 |
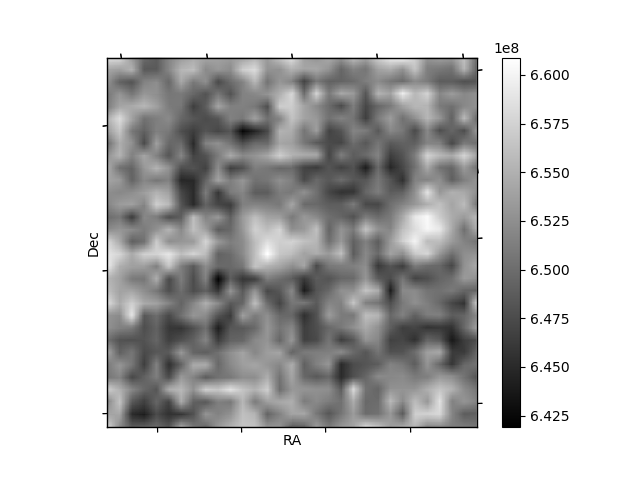
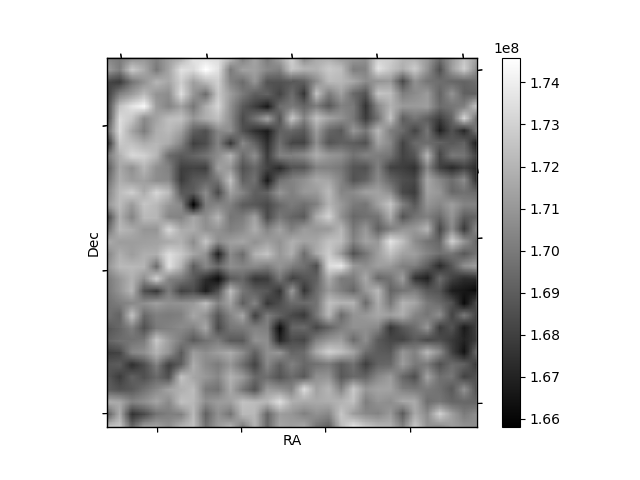
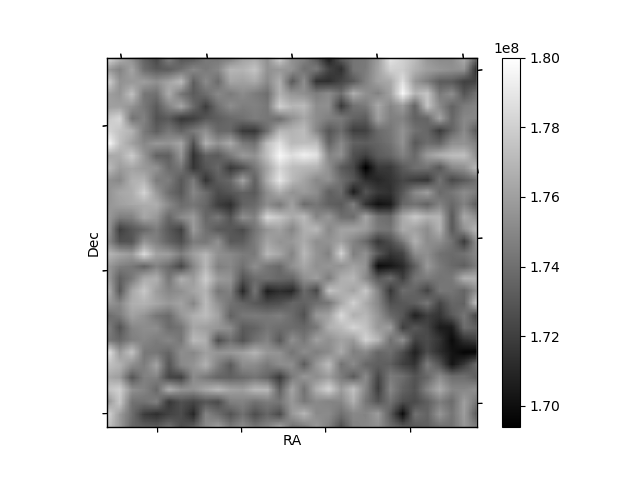
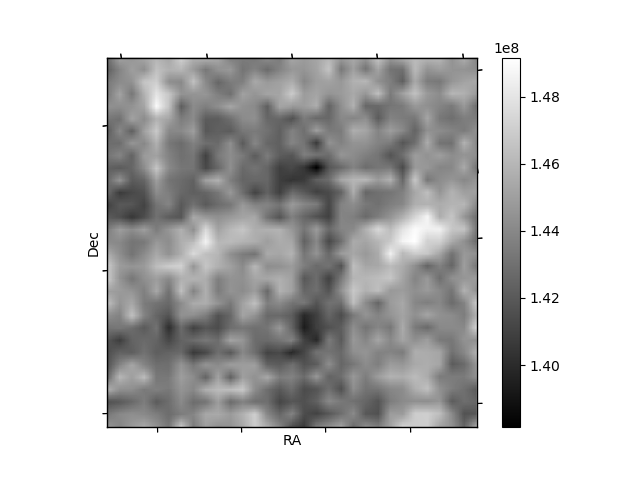
Histogram calculated using DETX and DETY for each event in the final _common_clean file
| Quadrant A | 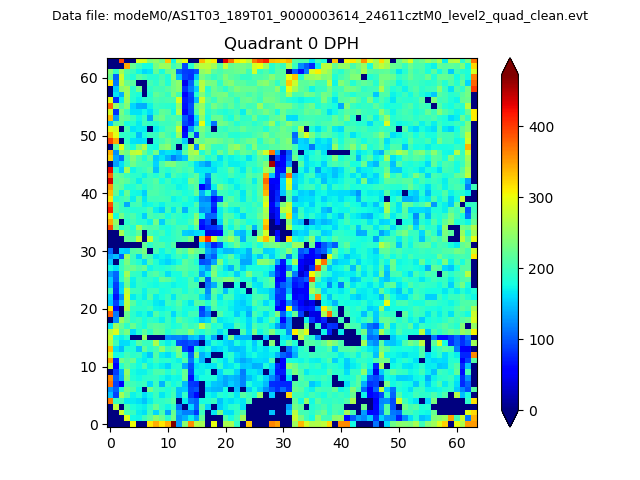 |
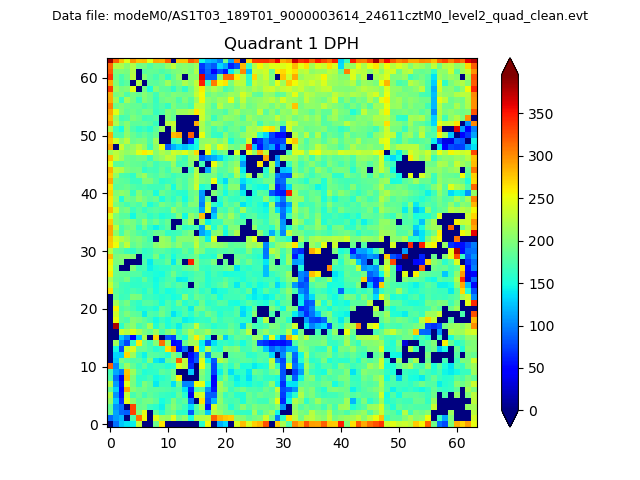 |
Quadrant B |
|---|---|---|---|
| Quadrant D | 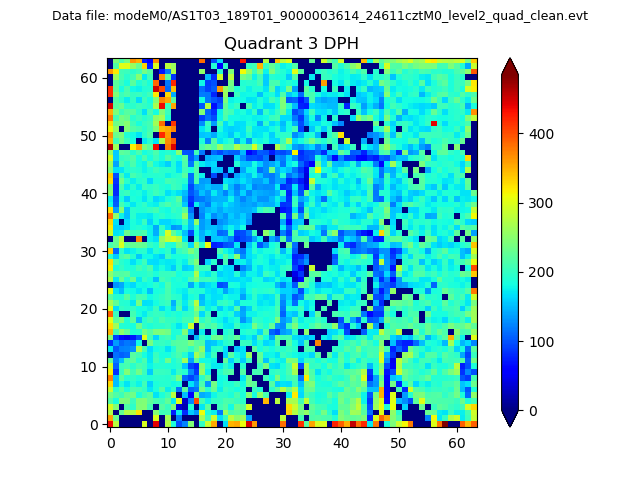 |
 |
Quadrant C |
| Plot type | Count rate plots | Images |
|---|---|---|
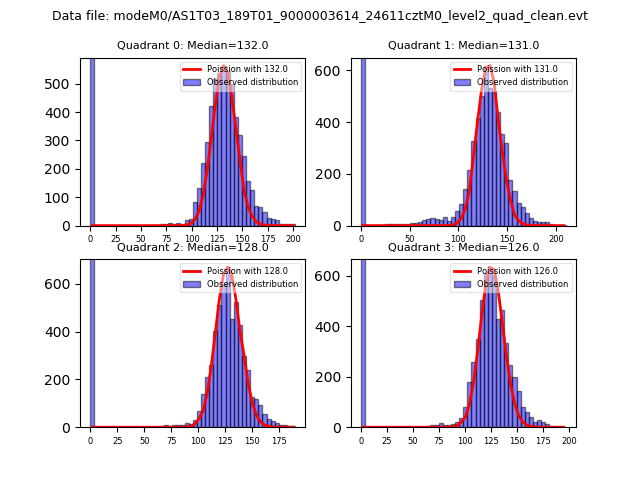
| Comparison with Poisson distribution Blue bars denote a histogram of data divided into 1 sec bins. Red curve is a Poisson curve with rate = median count rate of data. |
 |
 |
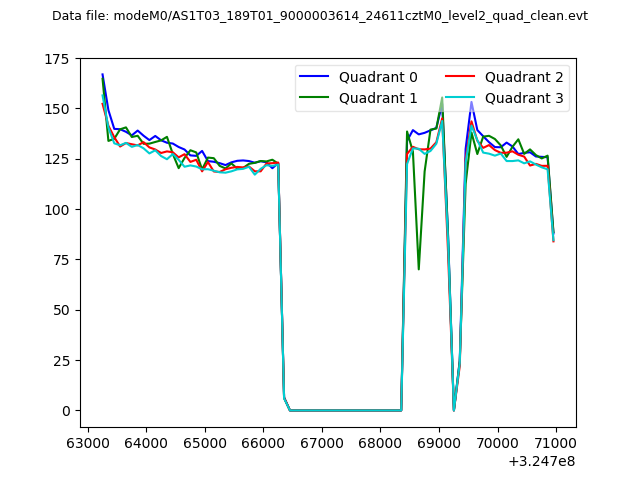
| Quadrant-wise count rates Data is divided into 100 sec bins |
 |
|
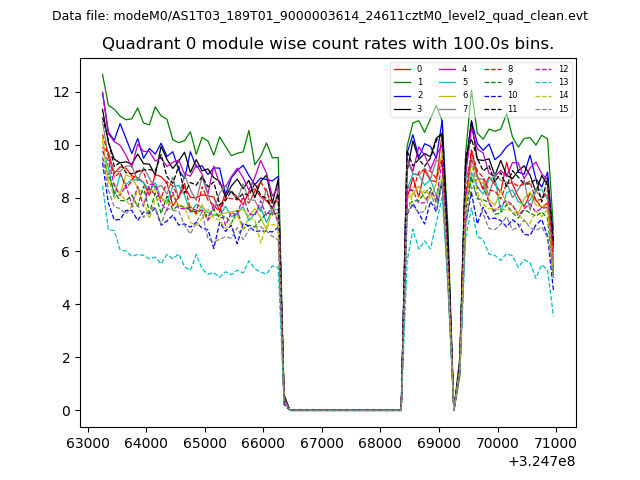
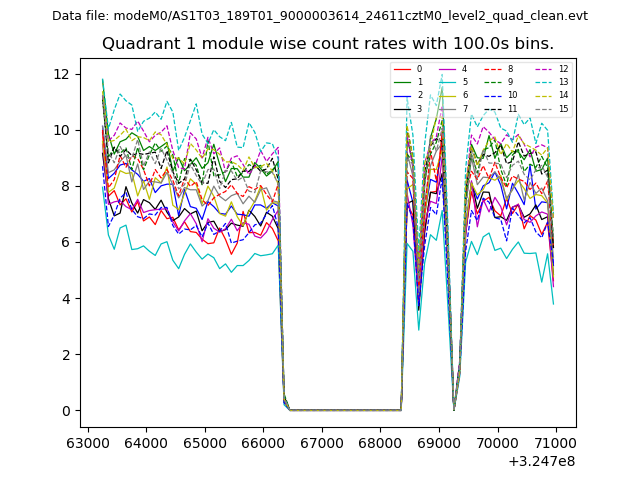
| Module-wise count rates for Quadrant A Data is divided into 100 sec bins |
 |
 |
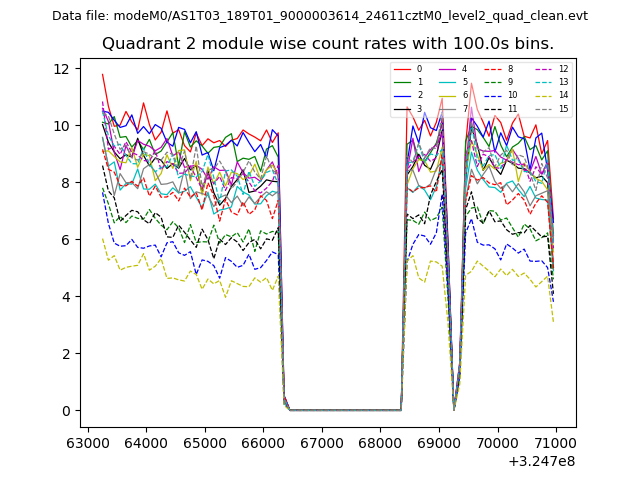
| Module-wise count rates for Quadrant B Data is divided into 100 sec bins |
 |
 |
| Module-wise count rates for Quadrant C Data is divided into 100 sec bins |
 |
 |
| Module-wise count rates for Quadrant D Data is divided into 100 sec bins |
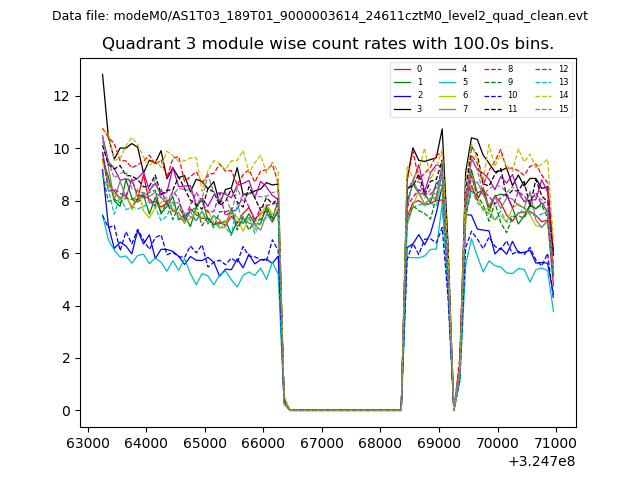 |
 |
| Parameter | Plot |
|---|---|
| CZT HV Monitor | 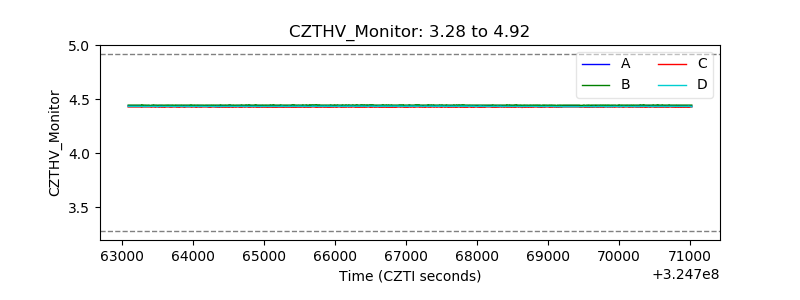 |
| D_VDD |  |
| Temperature 1 | 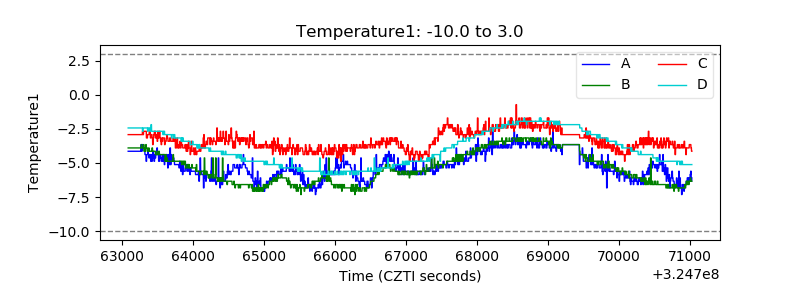 |
| Veto HV Monitor | 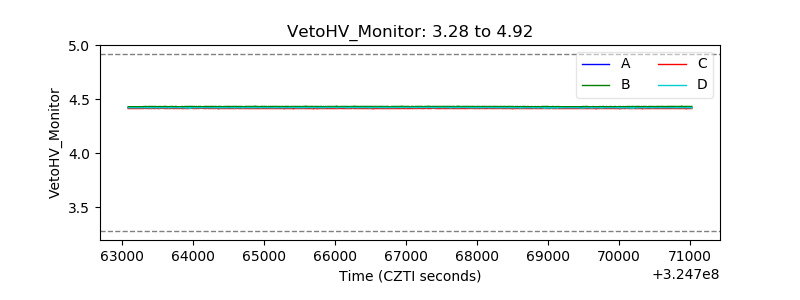 |
| Veto LLD | 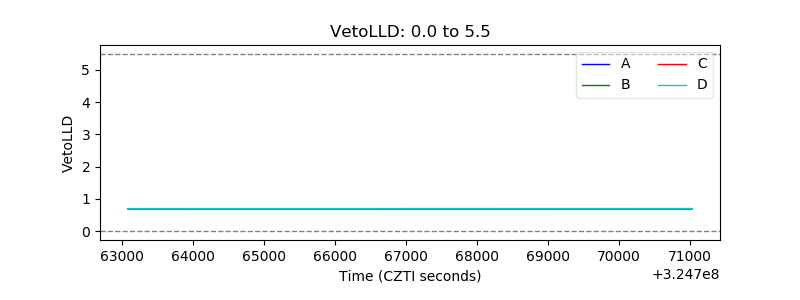 |
| Alpha Counter | 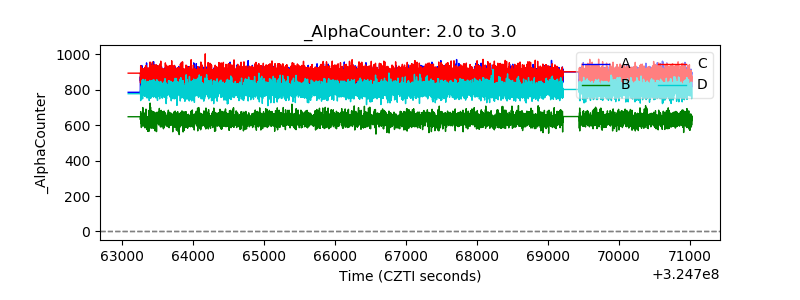 |
| _CPM_Rate | 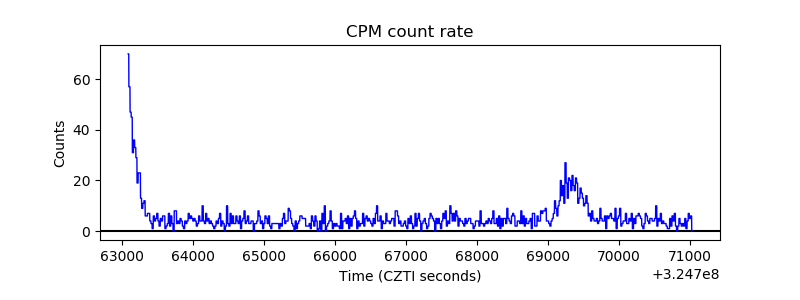 |
| CZT Counter |  |
| +2.5 Volts monitor |  |
| +5 Volts monitor |  |
| _ROLL_ROT | 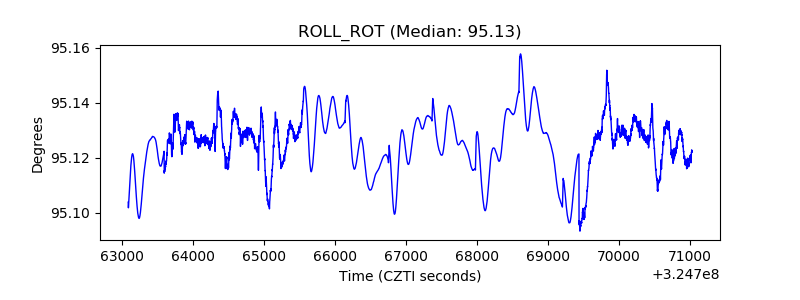 |
| _Roll_DEC | 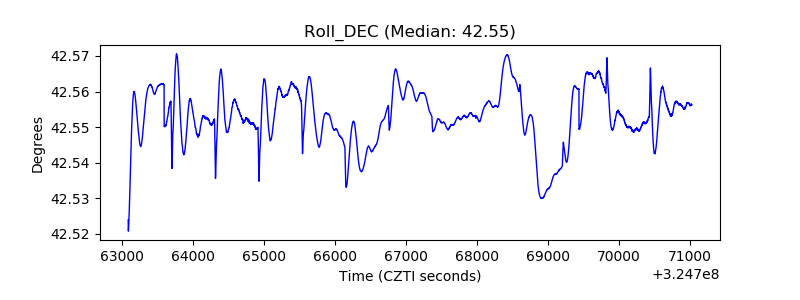 |
| _Roll_RA | 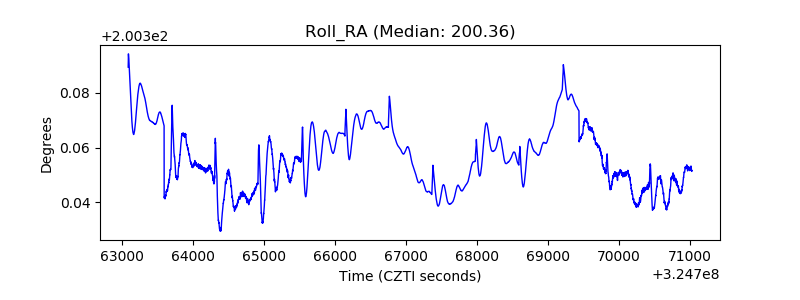 |
| Veto Counter | 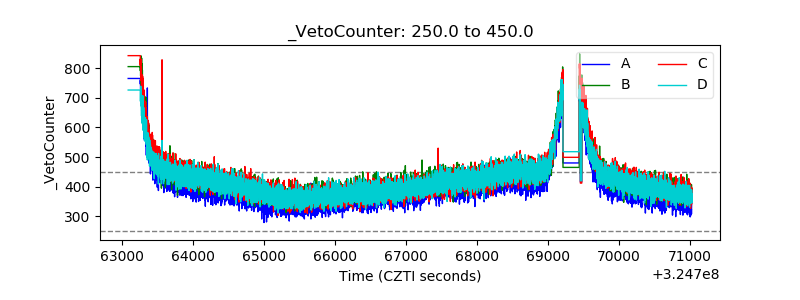 |