| Param | Original file | Final file |
|---|---|---|
| Filename | modeM0/AS1T03_189T01_9000003614_24612cztM0_level2.evt | modeM0/AS1T03_189T01_9000003614_24612cztM0_level2_quad_clean.evt |
| Size (bytes) | 677,839,680 | 123,819,840 |
| Size | 646.4 MB | 118.1 MB |
| Events in quadrant A | 3,998,132 | 817,463 |
| Events in quadrant B | 5,569,138 | 788,372 |
| Events in quadrant C | 5,851,193 | 781,771 |
| Events in quadrant D | 4,547,106 | 784,669 |
| Mode M9 | |||
|---|---|---|---|
| Quadrant | BADHDUFLAG | Total packets | Discarded packets |
| A | 0 | 5 | 0 |
| B | 0 | 5 | 0 |
| C | 0 | 5 | 0 |
| D | 0 | 5 | 0 |
| Mode M0 | |||
|---|---|---|---|
| Quadrant | BADHDUFLAG | Total packets | Discarded packets |
| A | 0 | 17454 | 2 |
| B | 0 | 22222 | 2 |
| C | 0 | 23067 | 2 |
| D | 0 | 18977 | 2 |
| Mode SS | |||
|---|---|---|---|
| Quadrant | BADHDUFLAG | Total packets | Discarded packets |
| A | 0 | 174 | 0 |
| B | 0 | 174 | 0 |
| C | 0 | 174 | 0 |
| D | 0 | 174 | 0 |
| Quadrant | Total seconds | Saturated seconds | Saturation percentage |
|---|---|---|---|
| A | 8313 | 77 | 0.926260% |
| B | 8314 | 658 | 7.914361% |
| C | 8314 | 358 | 4.305990% |
| D | 8314 | 95 | 1.142651% |
Noise dominated data is calculated using 1-second bins in cleaned event files. If a bin has >2000 counts, and if more than 50% of those come from <1% of pixels, then it is considered to be noise-dominated and hence unusable.
| Quadrant | # 1 sec bins | Bins with >0 counts | Bins with >2000 counts | High rate bins dominated by noise | Noise dominated (total time) | Noise dominated (detector-on time) | Marked lightcurve |
|---|---|---|---|---|---|---|---|
| A | 8803 | 8319 | 0 | 0 | 0.00% | 0.00% | 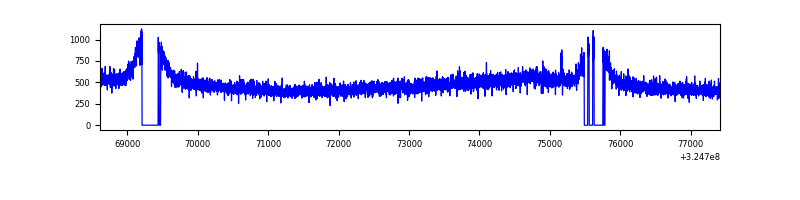 |
| B | 8804 | 8320 | 366 | 366 | 4.16% | 4.40% | 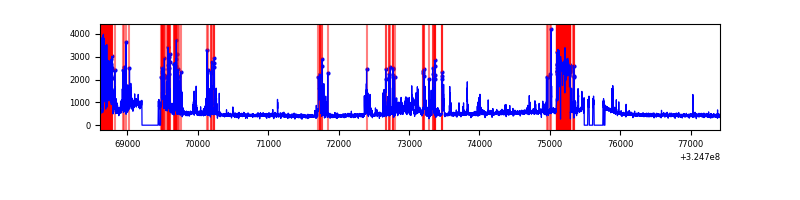 |
| C | 8804 | 8320 | 2 | 2 | 0.02% | 0.02% | 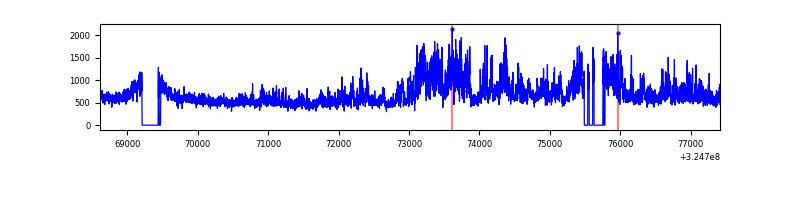 |
| D | 8804 | 8320 | 29 | 29 | 0.33% | 0.35% | 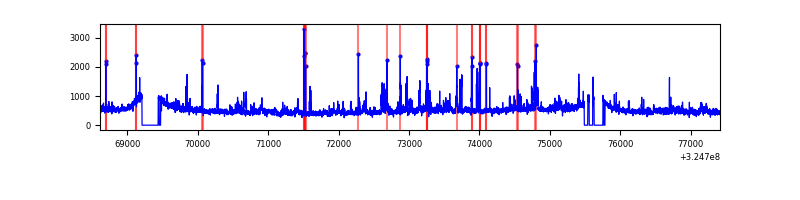 |
Top three noisy pixels from each quadrant. If the there are fewer than three noisy pixels in the level2.evt file, extra rows are filled as -1
| Pixel properties | Quadrant properties | ||||||
|---|---|---|---|---|---|---|---|
| Quadrant | DetID | PixID | Counts | Sigma | Mean | Median | Sigma |
| A | 13 | 254 | 13433 | 59.49 | 1034 | 1012 | 208.8 |
| A | 3 | 137 | 9853 | 42.35 | 1034 | 1012 | 208.8 |
| A | 0 | 226 | 8826 | 37.43 | 1034 | 1012 | 208.8 |
| B | 3 | 64 | 1657495 | 8602.92 | 993 | 965 | 192.6 |
| B | 12 | 111 | 24065 | 119.96 | 993 | 965 | 192.6 |
| B | 11 | 111 | 21535 | 106.82 | 993 | 965 | 192.6 |
| C | 7 | 247 | 1785325 | 7606.63 | 993 | 999 | 234.6 |
| C | 14 | 238 | 154171 | 652.98 | 993 | 999 | 234.6 |
| C | 3 | 233 | 12714 | 49.94 | 993 | 999 | 234.6 |
| D | 1 | 52 | 266135 | 1074.74 | 1012 | 982 | 246.7 |
| D | 8 | 195 | 215447 | 869.28 | 1012 | 982 | 246.7 |
| D | 7 | 238 | 194796 | 785.58 | 1012 | 982 | 246.7 |
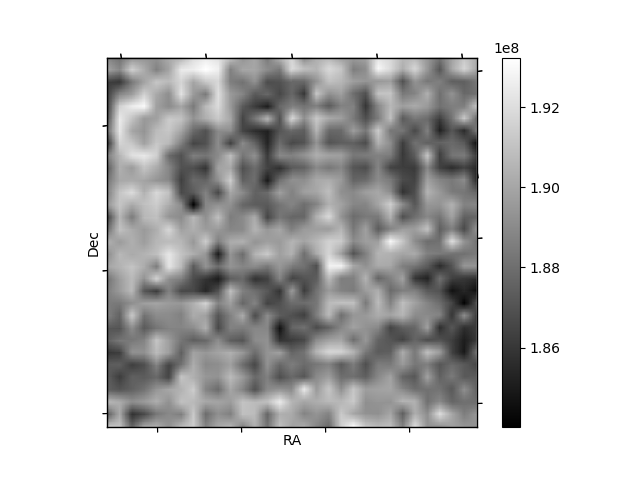
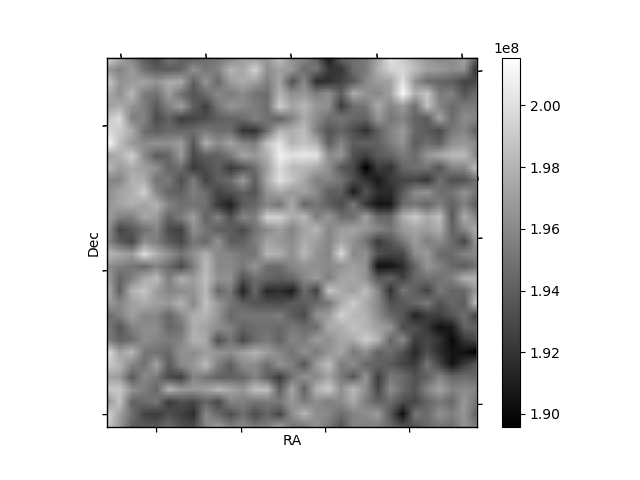
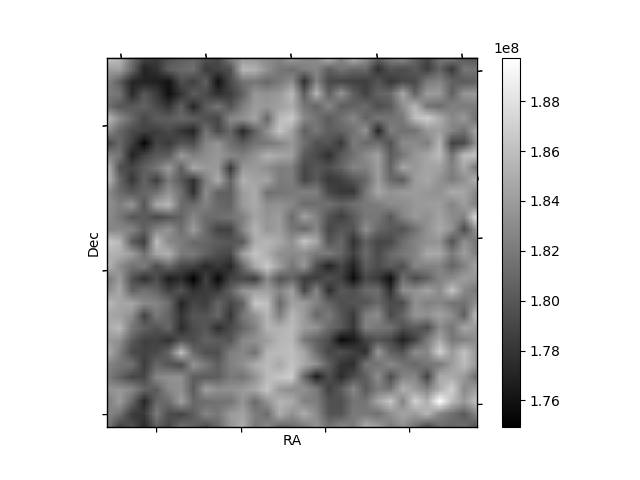
Histogram calculated using DETX and DETY for each event in the final _common_clean file
| Quadrant A | 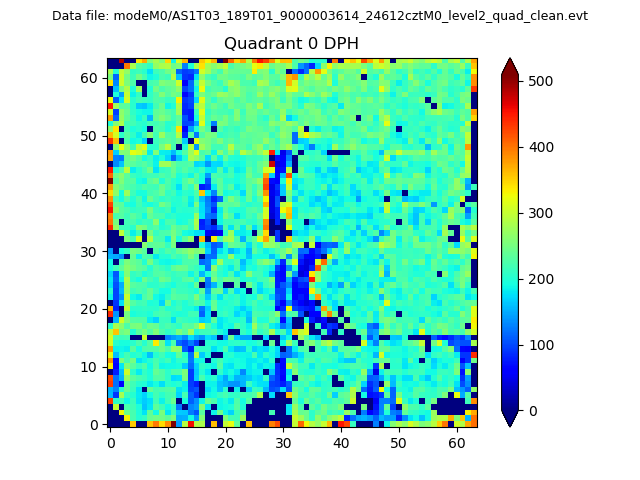 |
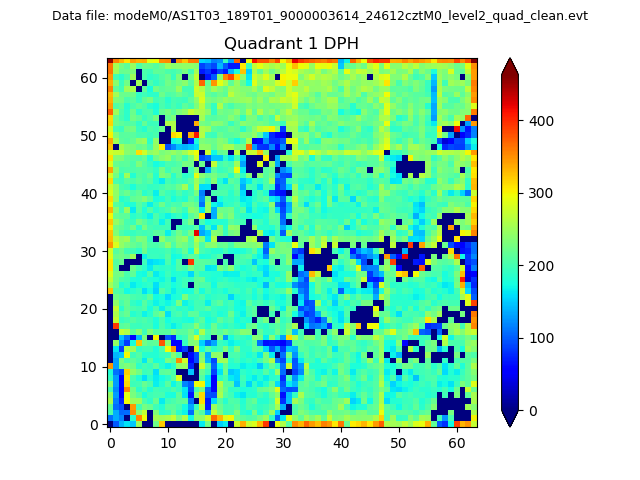 |
Quadrant B |
|---|---|---|---|
| Quadrant D | 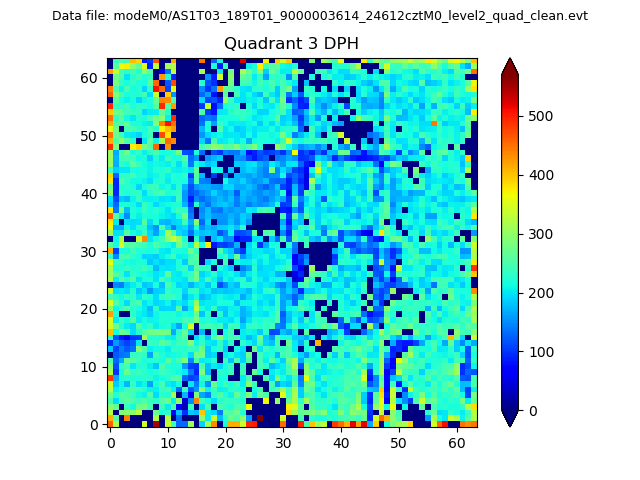 |
 |
Quadrant C |
| Plot type | Count rate plots | Images |
|---|---|---|
| Comparison with Poisson distribution Blue bars denote a histogram of data divided into 1 sec bins. Red curve is a Poisson curve with rate = median count rate of data. |
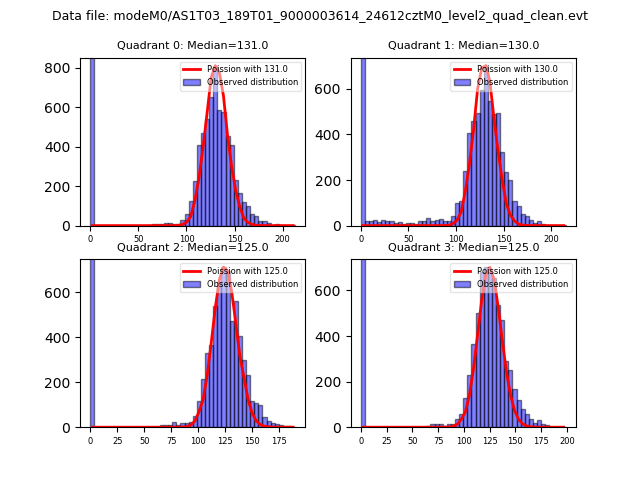 |
 |
| Quadrant-wise count rates Data is divided into 100 sec bins |
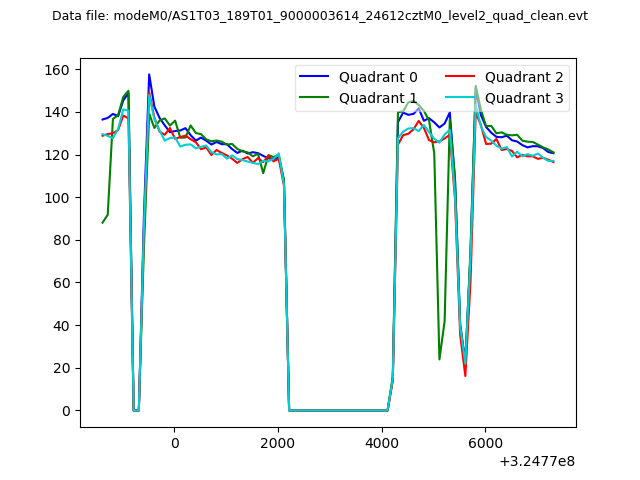 |
|
| Module-wise count rates for Quadrant A Data is divided into 100 sec bins |
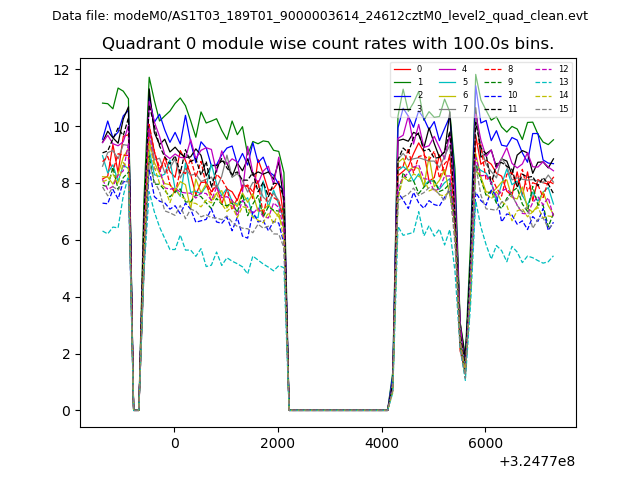 |
 |
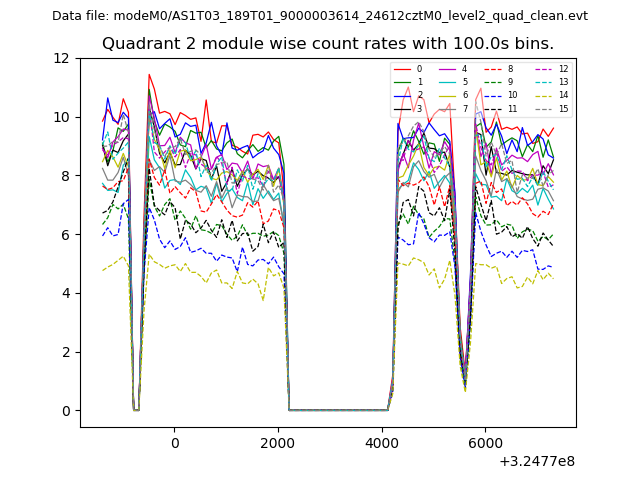
| Module-wise count rates for Quadrant B Data is divided into 100 sec bins |
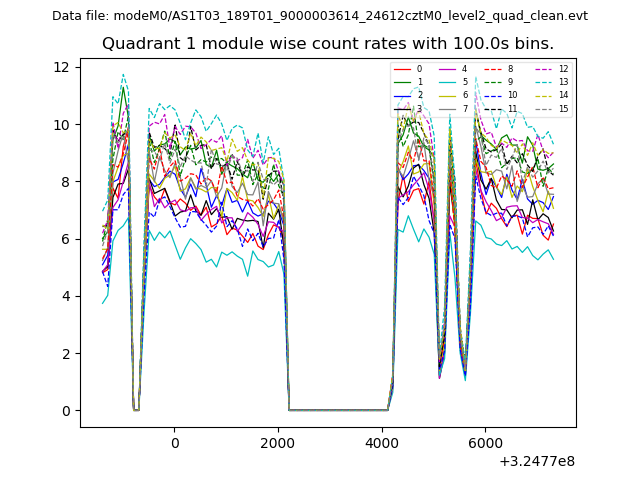 |
 |
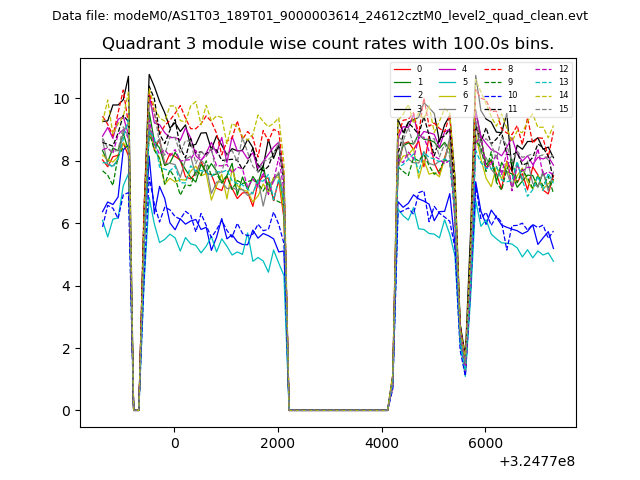
| Module-wise count rates for Quadrant C Data is divided into 100 sec bins |
 |
 |
| Module-wise count rates for Quadrant D Data is divided into 100 sec bins |
 |
 |
| Parameter | Plot |
|---|---|
| CZT HV Monitor | 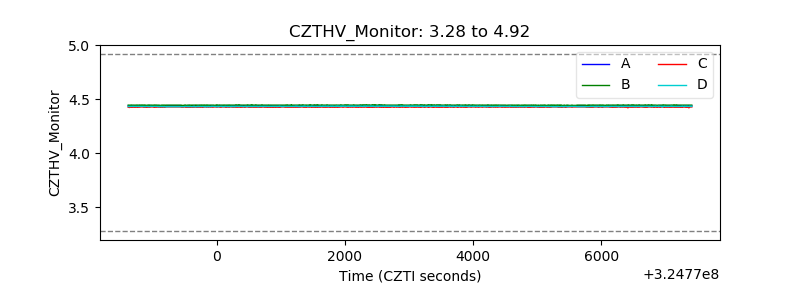 |
| D_VDD | 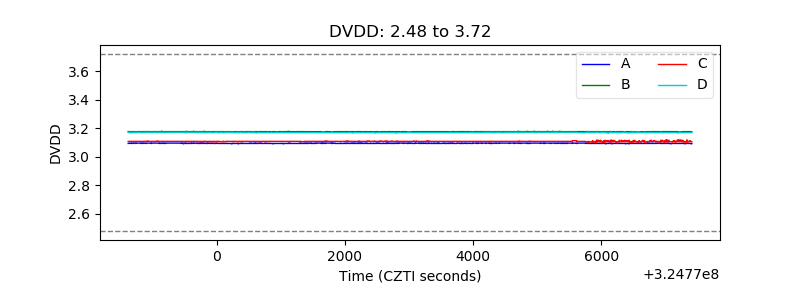 |
| Temperature 1 | 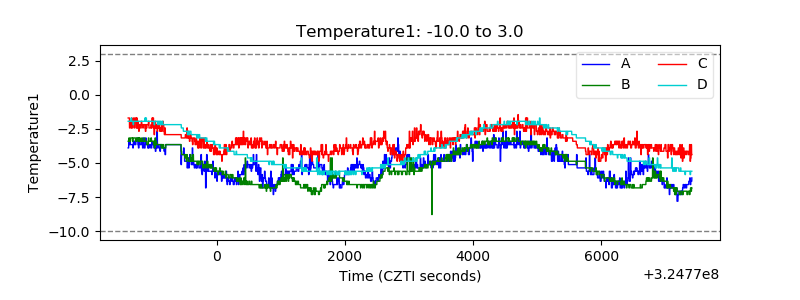 |
| Veto HV Monitor |  |
| Veto LLD | 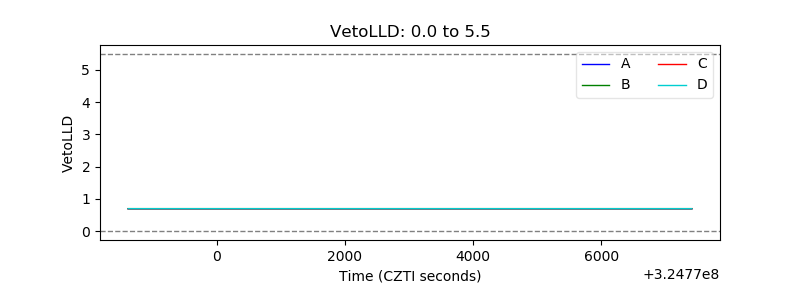 |
| Alpha Counter | 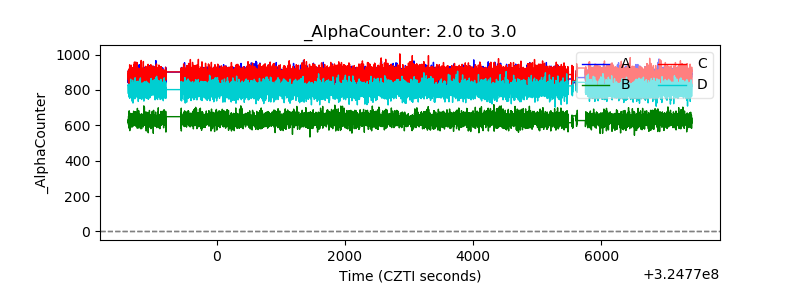 |
| _CPM_Rate | 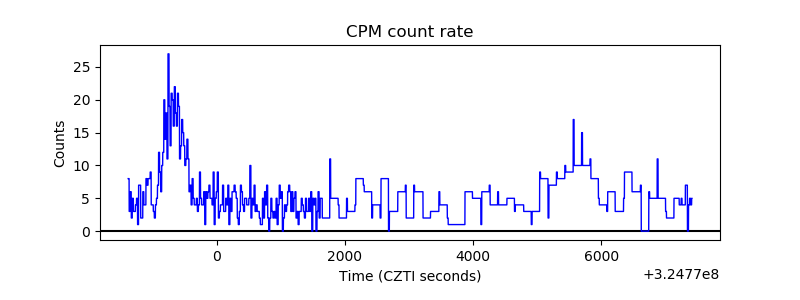 |
| CZT Counter | 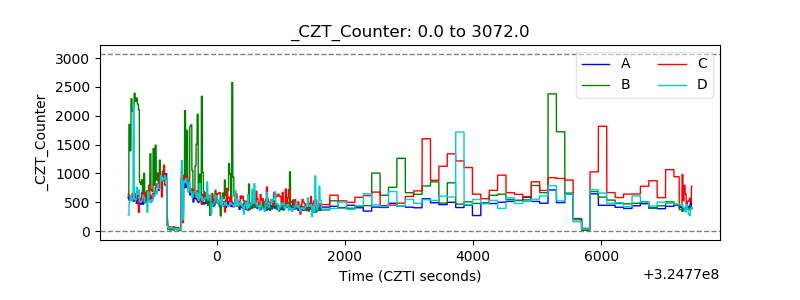 |
| +2.5 Volts monitor |  |
| +5 Volts monitor |  |
| _ROLL_ROT | 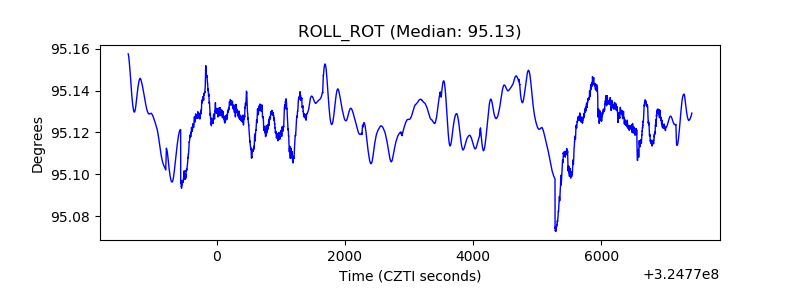 |
| _Roll_DEC | 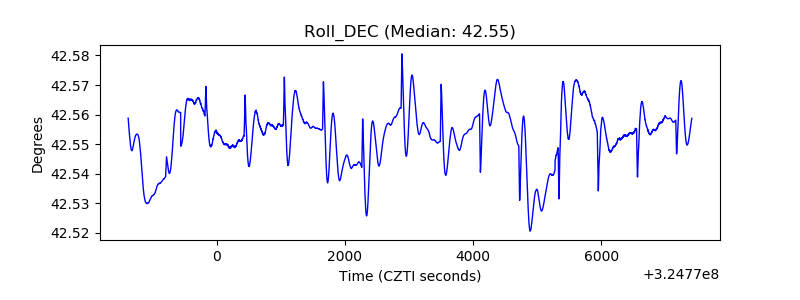 |
| _Roll_RA |  |
| Veto Counter | 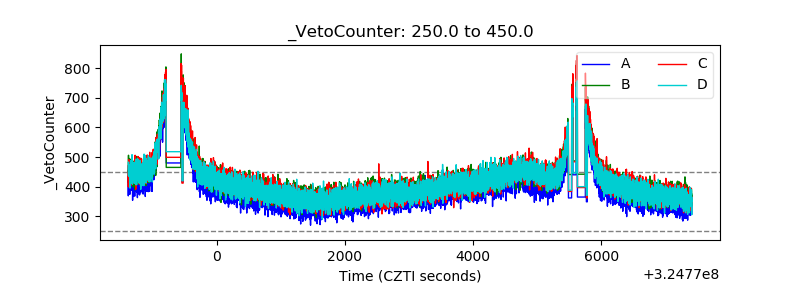 |