| Param | Original file | Final file |
|---|---|---|
| Filename | modeM0/AS1T03_189T01_9000003614_24613cztM0_level2.evt | modeM0/AS1T03_189T01_9000003614_24613cztM0_level2_quad_clean.evt |
| Size (bytes) | 764,049,600 | 124,384,320 |
| Size | 728.7 MB | 118.6 MB |
| Events in quadrant A | 3,963,246 | 822,355 |
| Events in quadrant B | 4,835,458 | 806,455 |
| Events in quadrant C | 9,188,002 | 763,780 |
| Events in quadrant D | 4,582,363 | 788,929 |
| Mode M9 | |||
|---|---|---|---|
| Quadrant | BADHDUFLAG | Total packets | Discarded packets |
| A | 0 | 7 | 0 |
| B | 0 | 7 | 0 |
| C | 0 | 7 | 0 |
| D | 0 | 7 | 0 |
| Mode M0 | |||
|---|---|---|---|
| Quadrant | BADHDUFLAG | Total packets | Discarded packets |
| A | 0 | 17423 | 2 |
| B | 0 | 20056 | 2 |
| C | 0 | 33258 | 2 |
| D | 0 | 19109 | 2 |
| Mode SS | |||
|---|---|---|---|
| Quadrant | BADHDUFLAG | Total packets | Discarded packets |
| A | 0 | 176 | 0 |
| B | 0 | 176 | 0 |
| C | 0 | 176 | 0 |
| D | 0 | 176 | 0 |
| Quadrant | Total seconds | Saturated seconds | Saturation percentage |
|---|---|---|---|
| A | 8428 | 46 | 0.545800% |
| B | 8429 | 393 | 4.662475% |
| C | 8429 | 1767 | 20.963341% |
| D | 8429 | 44 | 0.522007% |
Noise dominated data is calculated using 1-second bins in cleaned event files. If a bin has >2000 counts, and if more than 50% of those come from <1% of pixels, then it is considered to be noise-dominated and hence unusable.
| Quadrant | # 1 sec bins | Bins with >0 counts | Bins with >2000 counts | High rate bins dominated by noise | Noise dominated (total time) | Noise dominated (detector-on time) | Marked lightcurve |
|---|---|---|---|---|---|---|---|
| A | 9038 | 8433 | 0 | 0 | 0.00% | 0.00% | 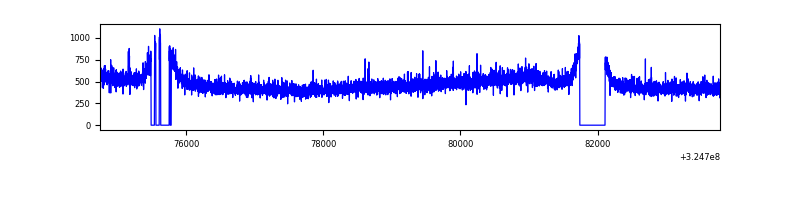 |
| B | 9039 | 8434 | 225 | 225 | 2.49% | 2.67% | 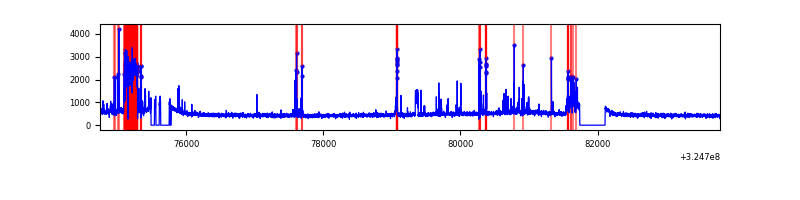 |
| C | 9039 | 8434 | 1125 | 1125 | 12.45% | 13.34% | 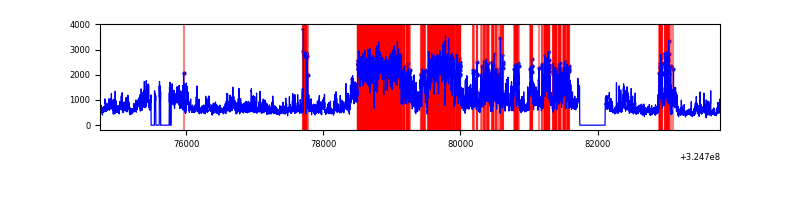 |
| D | 9039 | 8434 | 4 | 4 | 0.04% | 0.05% |  |
Top three noisy pixels from each quadrant. If the there are fewer than three noisy pixels in the level2.evt file, extra rows are filled as -1
| Pixel properties | Quadrant properties | ||||||
|---|---|---|---|---|---|---|---|
| Quadrant | DetID | PixID | Counts | Sigma | Mean | Median | Sigma |
| A | 13 | 254 | 13526 | 60.29 | 1025 | 1004 | 207.7 |
| A | 3 | 137 | 9764 | 42.18 | 1025 | 1004 | 207.7 |
| A | 0 | 226 | 8622 | 36.68 | 1025 | 1004 | 207.7 |
| B | 3 | 64 | 906889 | 4717.48 | 998 | 971 | 192.0 |
| B | 12 | 111 | 24413 | 122.07 | 998 | 971 | 192.0 |
| B | 11 | 111 | 22013 | 109.57 | 998 | 971 | 192.0 |
| C | 7 | 247 | 5165908 | 23499.0 | 938 | 944 | 219.8 |
| C | 2 | 16 | 156771 | 708.97 | 938 | 944 | 219.8 |
| C | 14 | 238 | 145028 | 655.54 | 938 | 944 | 219.8 |
| D | 8 | 195 | 405449 | 1654.78 | 1004 | 975 | 244.4 |
| D | 1 | 52 | 317593 | 1295.35 | 1004 | 975 | 244.4 |
| D | 2 | 234 | 34458 | 136.99 | 1004 | 975 | 244.4 |
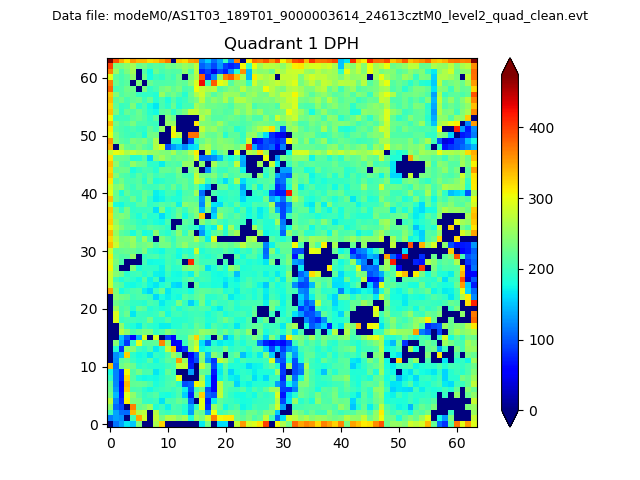
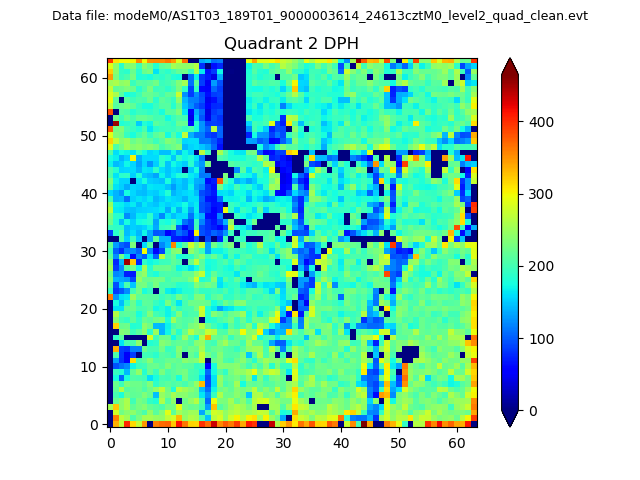
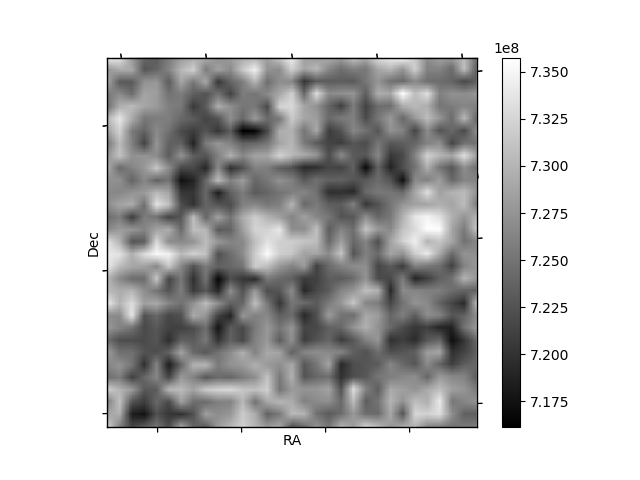
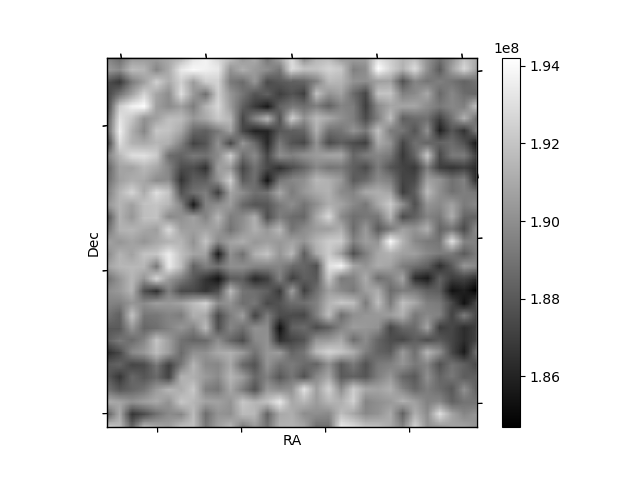
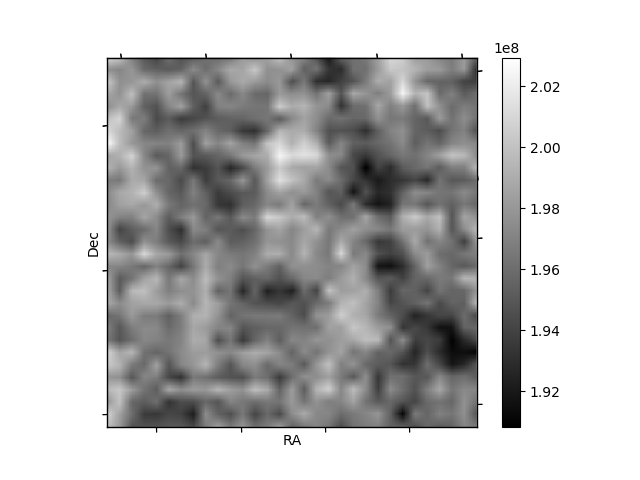
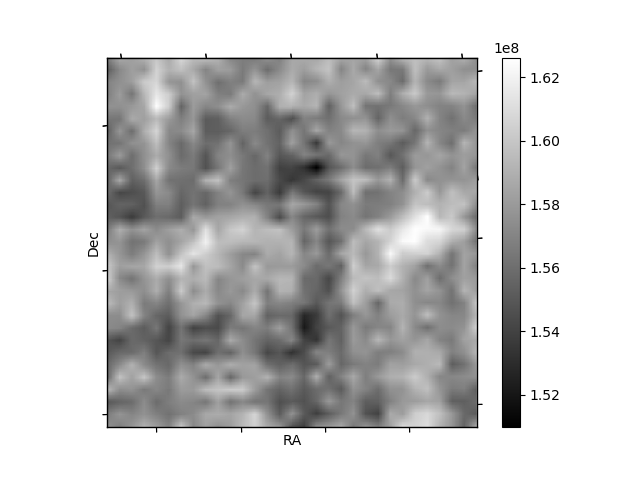
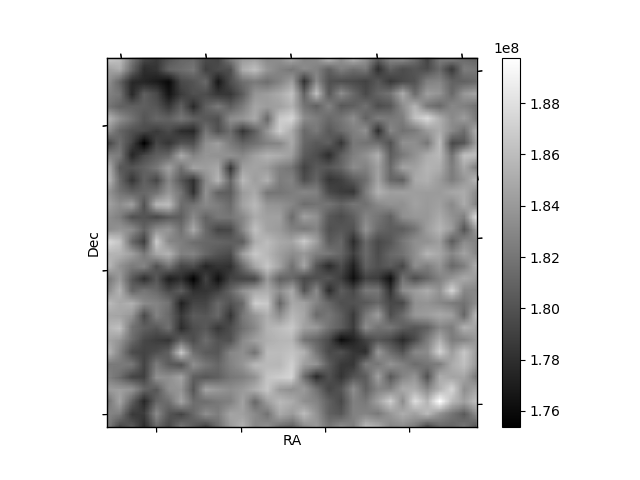
Histogram calculated using DETX and DETY for each event in the final _common_clean file
| Quadrant A | 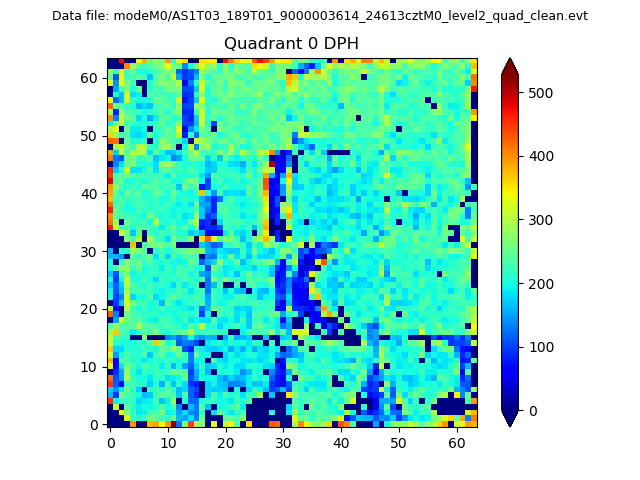 |
 |
Quadrant B |
|---|---|---|---|
| Quadrant D | 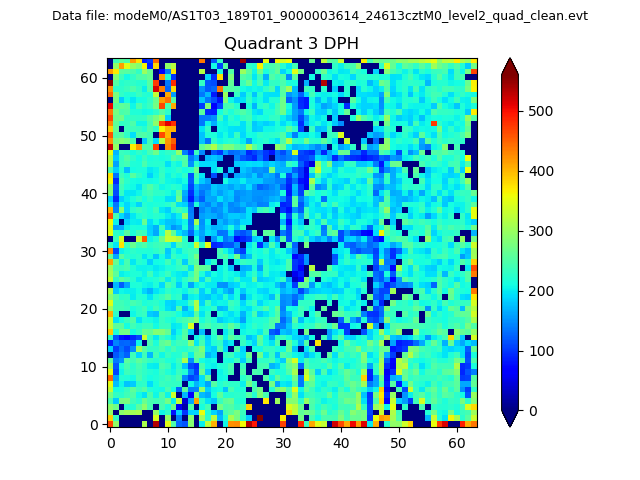 |
 |
Quadrant C |
| Plot type | Count rate plots | Images |
|---|---|---|
| Comparison with Poisson distribution Blue bars denote a histogram of data divided into 1 sec bins. Red curve is a Poisson curve with rate = median count rate of data. |
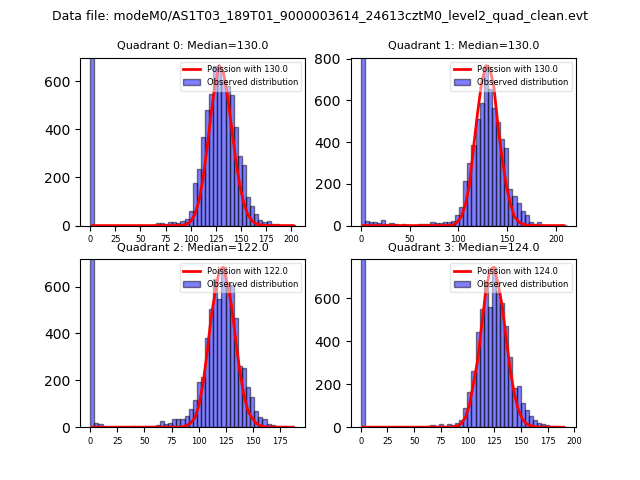 |
 |
| Quadrant-wise count rates Data is divided into 100 sec bins |
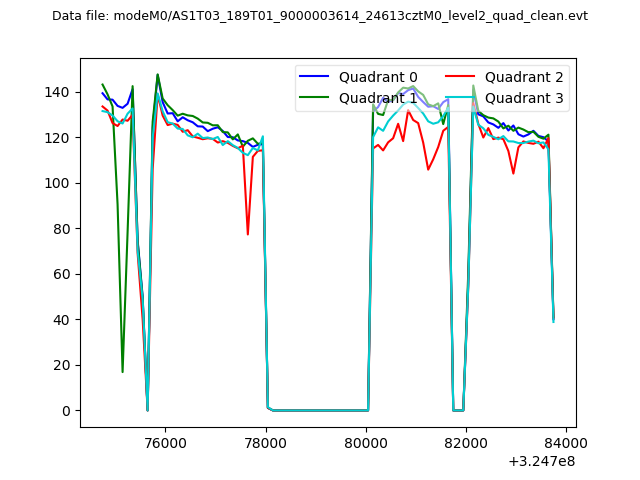 |
|
| Module-wise count rates for Quadrant A Data is divided into 100 sec bins |
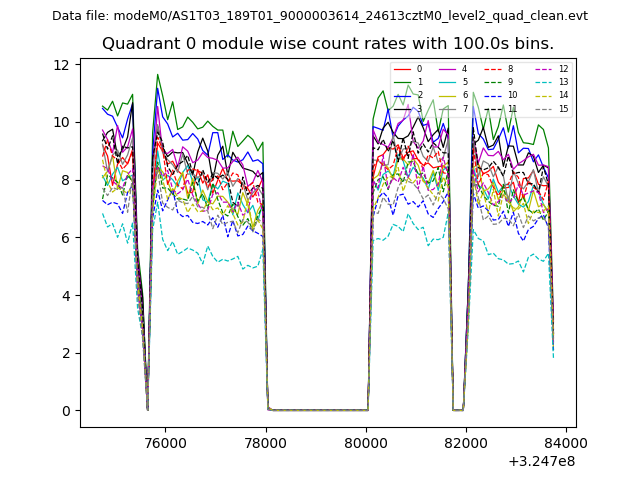 |
 |
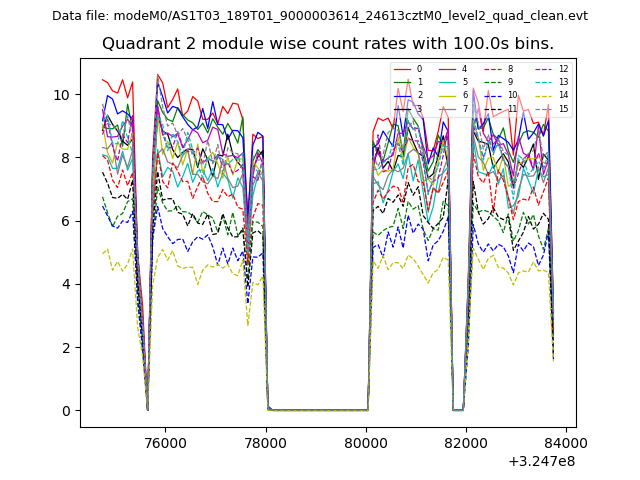
| Module-wise count rates for Quadrant B Data is divided into 100 sec bins |
 |
 |
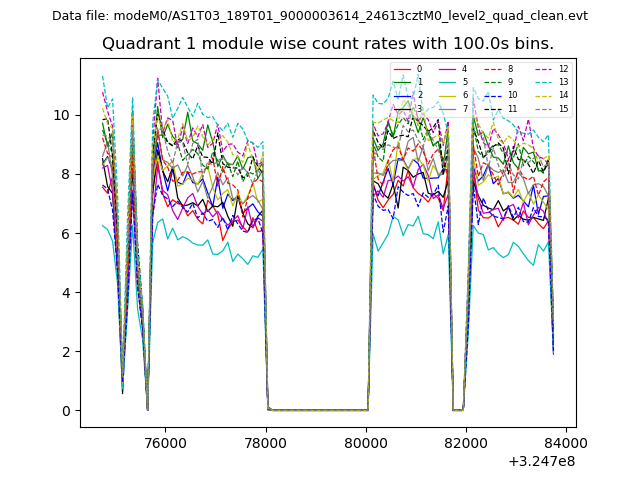
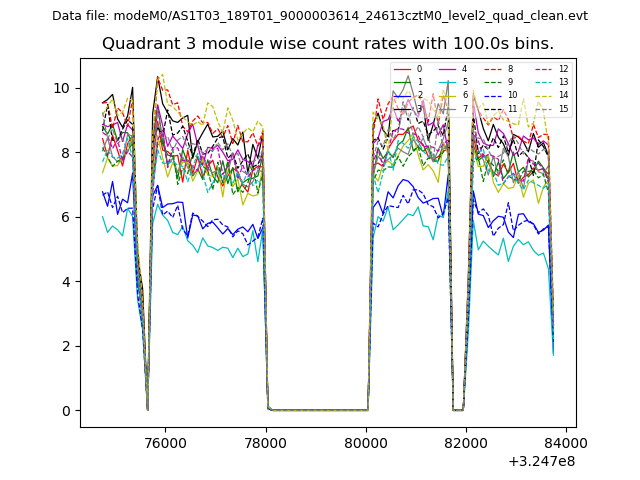
| Module-wise count rates for Quadrant C Data is divided into 100 sec bins |
 |
 |
| Module-wise count rates for Quadrant D Data is divided into 100 sec bins |
 |
 |
| Parameter | Plot |
|---|---|
| CZT HV Monitor |  |
| D_VDD |  |
| Temperature 1 | 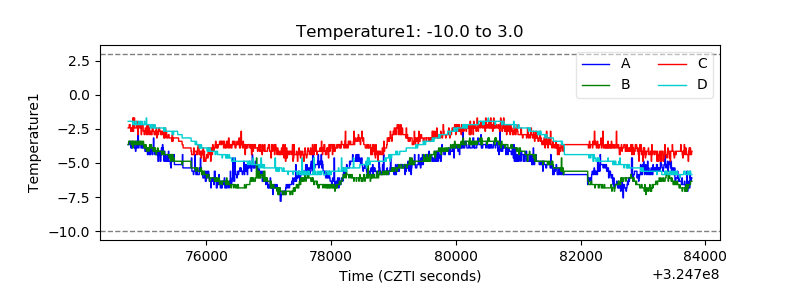 |
| Veto HV Monitor | 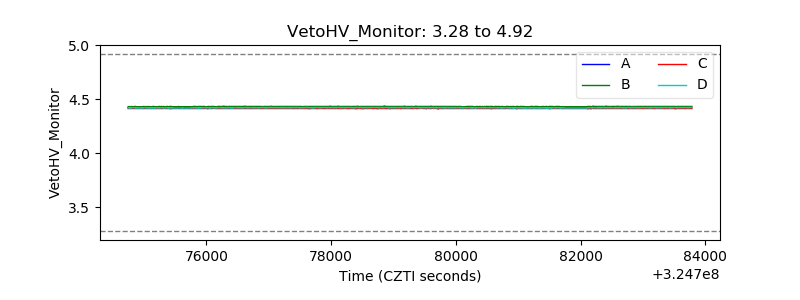 |
| Veto LLD | 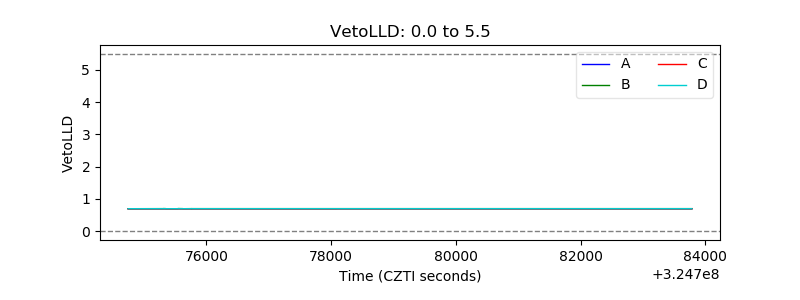 |
| Alpha Counter | 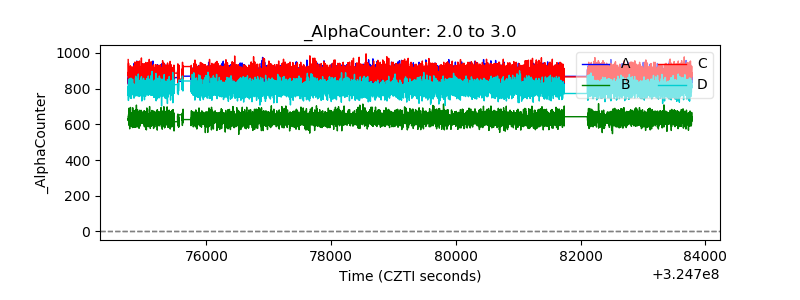 |
| _CPM_Rate | 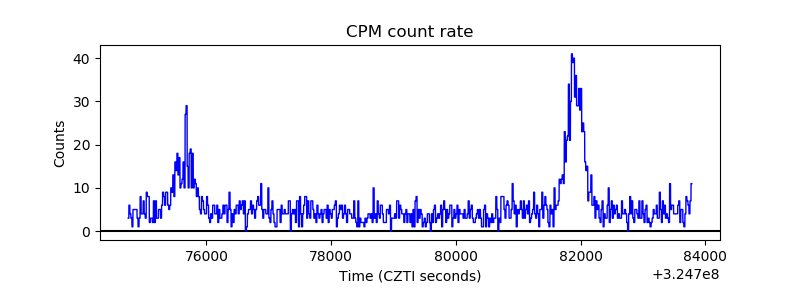 |
| CZT Counter | 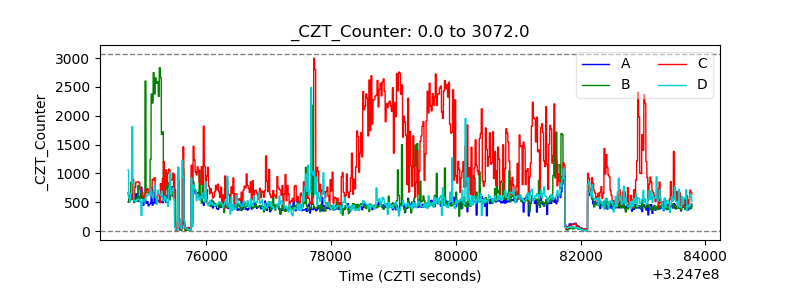 |
| +2.5 Volts monitor |  |
| +5 Volts monitor |  |
| _ROLL_ROT | 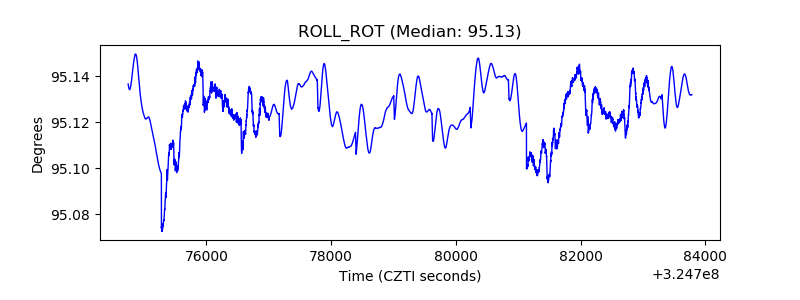 |
| _Roll_DEC | 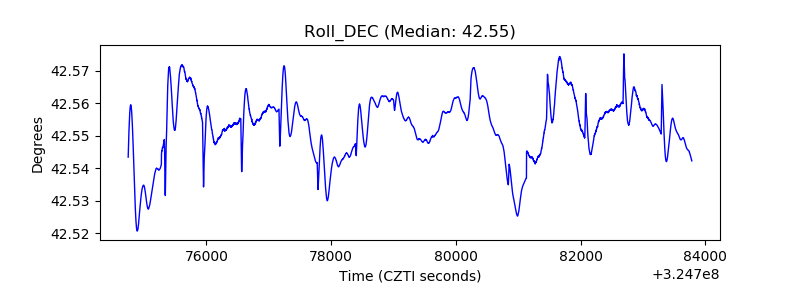 |
| _Roll_RA |  |
| Veto Counter | 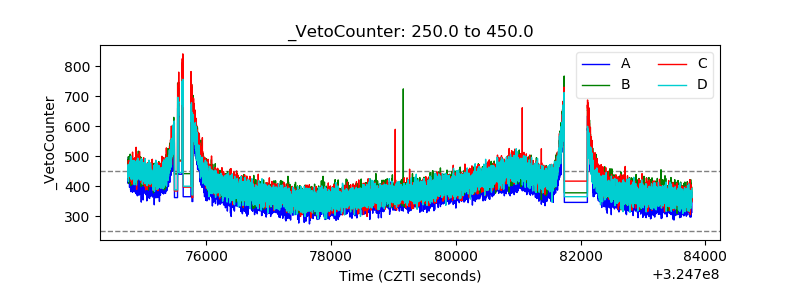 |