| Param | Original file | Final file |
|---|---|---|
| Filename | modeM0/AS1T03_189T01_9000003614_24615cztM0_level2.evt | modeM0/AS1T03_189T01_9000003614_24615cztM0_level2_quad_clean.evt |
| Size (bytes) | 909,918,720 | 159,206,400 |
| Size | 867.8 MB | 151.8 MB |
| Events in quadrant A | 5,817,782 | 1,007,331 |
| Events in quadrant B | 6,597,871 | 1,012,667 |
| Events in quadrant C | 7,173,653 | 969,937 |
| Events in quadrant D | 7,115,496 | 961,259 |
| Mode M9 | |||
|---|---|---|---|
| Quadrant | BADHDUFLAG | Total packets | Discarded packets |
| A | 0 | 12 | 0 |
| B | 0 | 12 | 0 |
| C | 0 | 12 | 0 |
| D | 0 | 12 | 0 |
| Mode M0 | |||
|---|---|---|---|
| Quadrant | BADHDUFLAG | Total packets | Discarded packets |
| A | 0 | 25498 | 2 |
| B | 0 | 27633 | 2 |
| C | 0 | 29169 | 2 |
| D | 0 | 29470 | 2 |
| Mode SS | |||
|---|---|---|---|
| Quadrant | BADHDUFLAG | Total packets | Discarded packets |
| A | 0 | 258 | 0 |
| B | 0 | 258 | 0 |
| C | 0 | 258 | 0 |
| D | 0 | 258 | 0 |
| Quadrant | Total seconds | Saturated seconds | Saturation percentage |
|---|---|---|---|
| A | 12586 | 84 | 0.667408% |
| B | 12587 | 254 | 2.017955% |
| C | 12587 | 292 | 2.319854% |
| D | 12586 | 81 | 0.643572% |
Noise dominated data is calculated using 1-second bins in cleaned event files. If a bin has >2000 counts, and if more than 50% of those come from <1% of pixels, then it is considered to be noise-dominated and hence unusable.
| Quadrant | # 1 sec bins | Bins with >0 counts | Bins with >2000 counts | High rate bins dominated by noise | Noise dominated (total time) | Noise dominated (detector-on time) | Marked lightcurve |
|---|---|---|---|---|---|---|---|
| A | 13851 | 12588 | 0 | 0 | 0.00% | 0.00% | 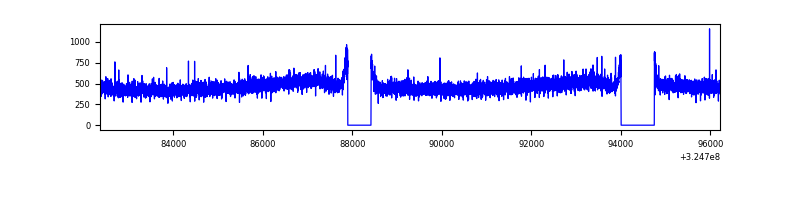 |
| B | 13852 | 12589 | 93 | 93 | 0.67% | 0.74% | 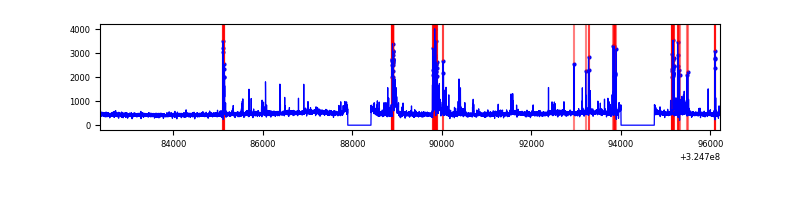 |
| C | 13852 | 12589 | 93 | 93 | 0.67% | 0.74% | 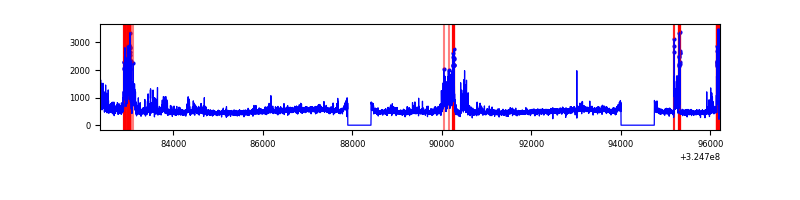 |
| D | 13851 | 12588 | 19 | 19 | 0.14% | 0.15% | 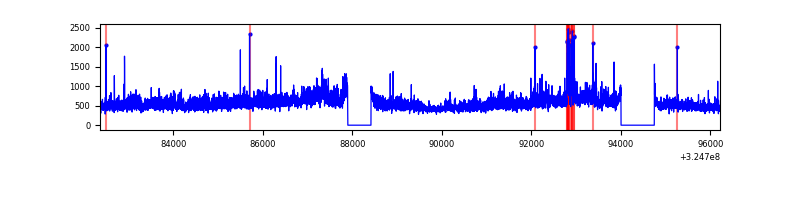 |
Top three noisy pixels from each quadrant. If the there are fewer than three noisy pixels in the level2.evt file, extra rows are filled as -1
| Pixel properties | Quadrant properties | ||||||
|---|---|---|---|---|---|---|---|
| Quadrant | DetID | PixID | Counts | Sigma | Mean | Median | Sigma |
| A | 13 | 254 | 19551 | 59.51 | 1505 | 1472 | 303.8 |
| A | 3 | 137 | 14262 | 42.1 | 1505 | 1472 | 303.8 |
| A | 6 | 16 | 13823 | 40.66 | 1505 | 1472 | 303.8 |
| B | 3 | 64 | 704018 | 2445.18 | 1490 | 1447 | 287.3 |
| B | 7 | 202 | 36973 | 123.64 | 1490 | 1447 | 287.3 |
| B | 12 | 111 | 36175 | 120.87 | 1490 | 1447 | 287.3 |
| C | 7 | 247 | 1087151 | 3231.5 | 1439 | 1448 | 336.0 |
| C | 14 | 238 | 229944 | 680.1 | 1439 | 1448 | 336.0 |
| C | 9 | 54 | 217186 | 642.12 | 1439 | 1448 | 336.0 |
| D | 8 | 195 | 1253294 | 3553.68 | 1459 | 1415 | 352.3 |
| D | 7 | 238 | 209095 | 589.54 | 1459 | 1415 | 352.3 |
| D | 1 | 52 | 76299 | 212.57 | 1459 | 1415 | 352.3 |
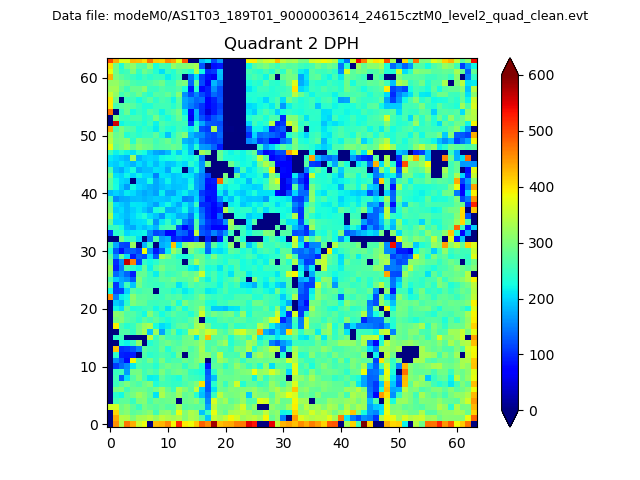
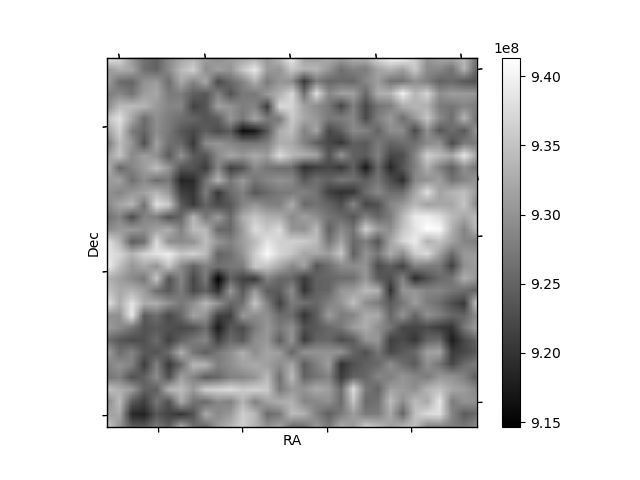
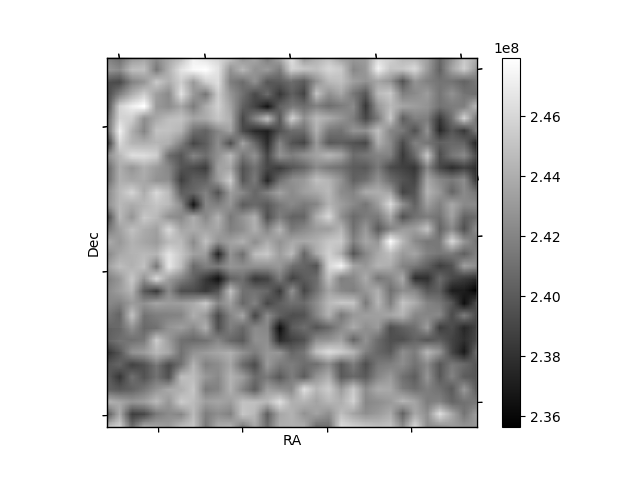
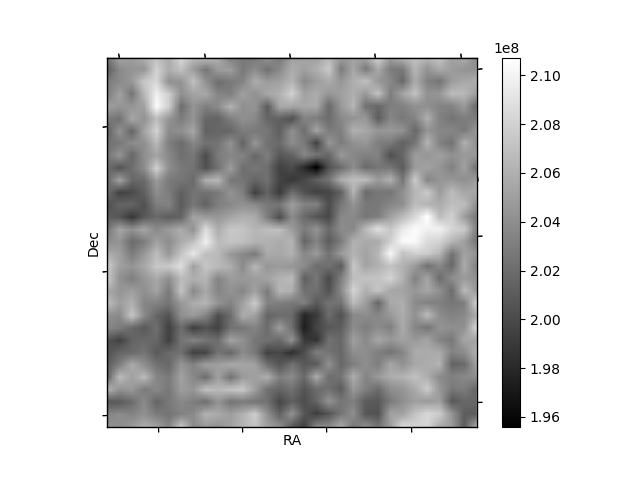
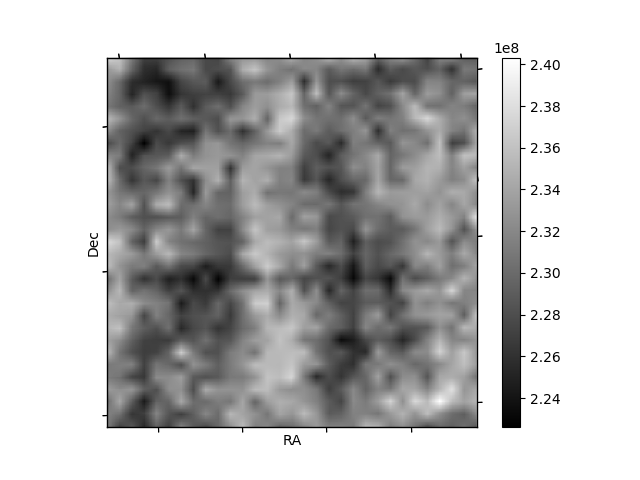
Histogram calculated using DETX and DETY for each event in the final _common_clean file
| Quadrant A | 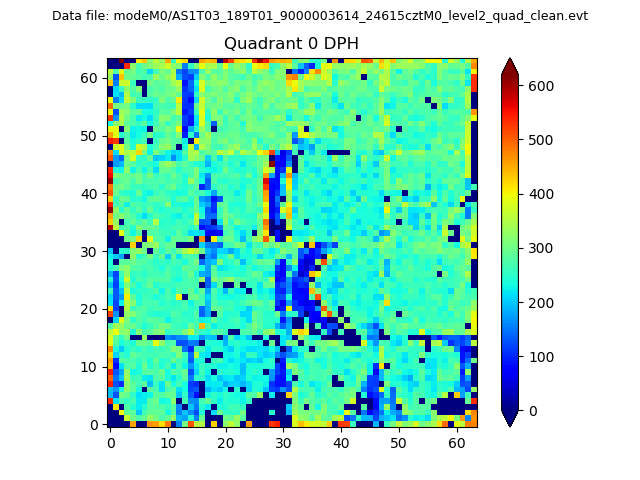 |
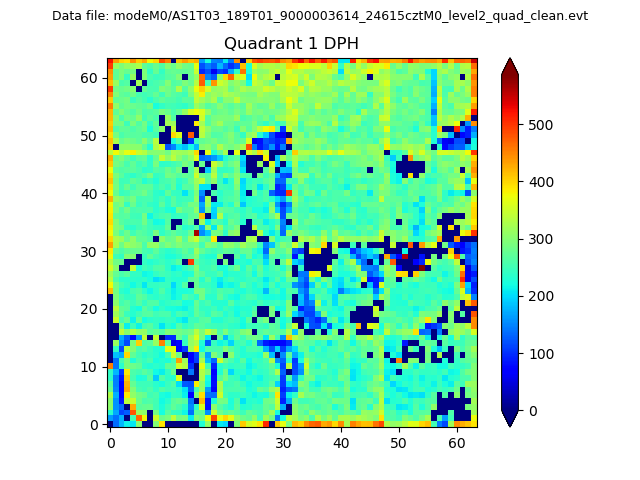 |
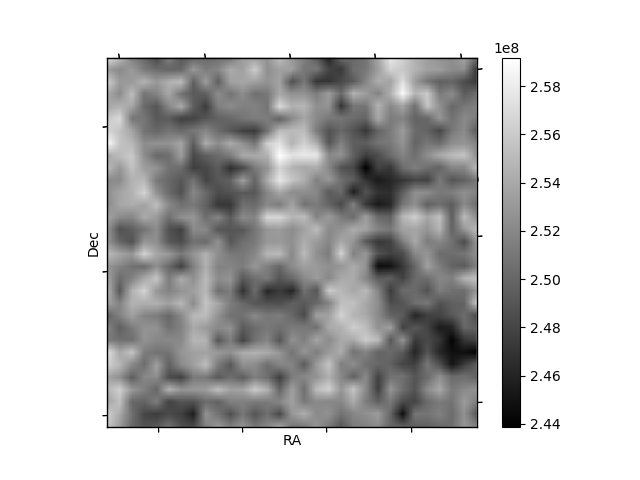
Quadrant B |
|---|---|---|---|
| Quadrant D | 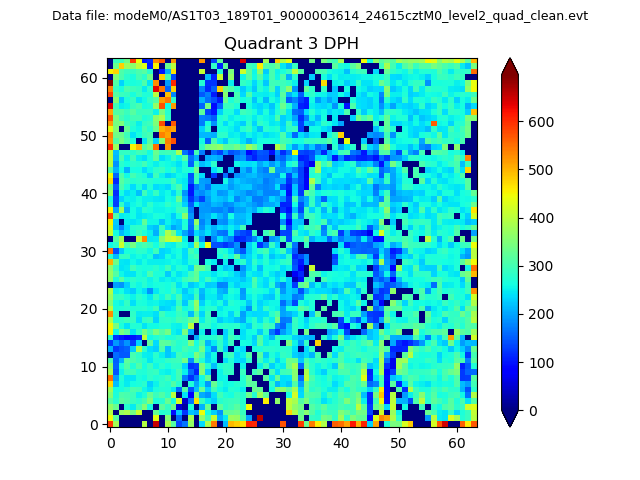 |
 |
Quadrant C |
| Plot type | Count rate plots | Images |
|---|---|---|
| Comparison with Poisson distribution Blue bars denote a histogram of data divided into 1 sec bins. Red curve is a Poisson curve with rate = median count rate of data. |
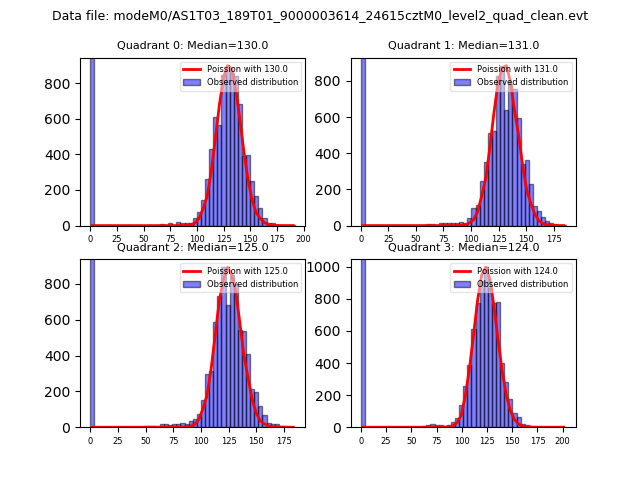 |
 |
| Quadrant-wise count rates Data is divided into 100 sec bins |
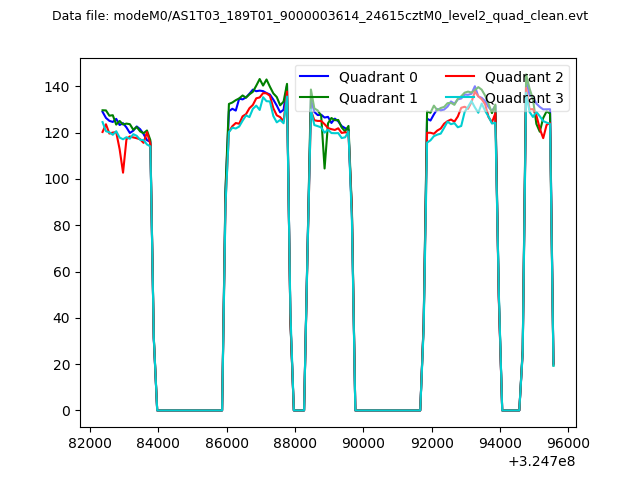 |
|
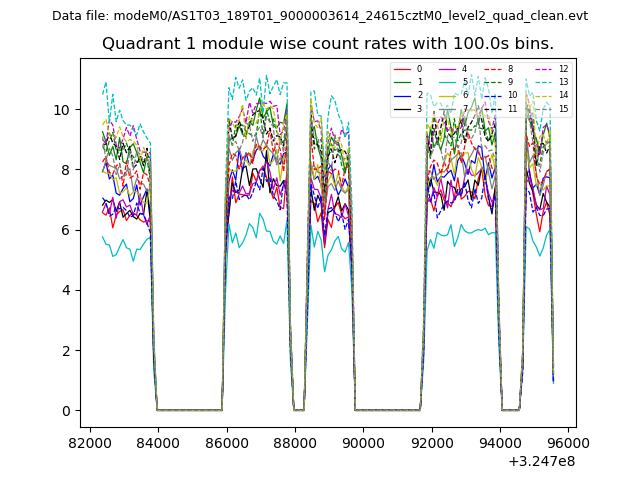
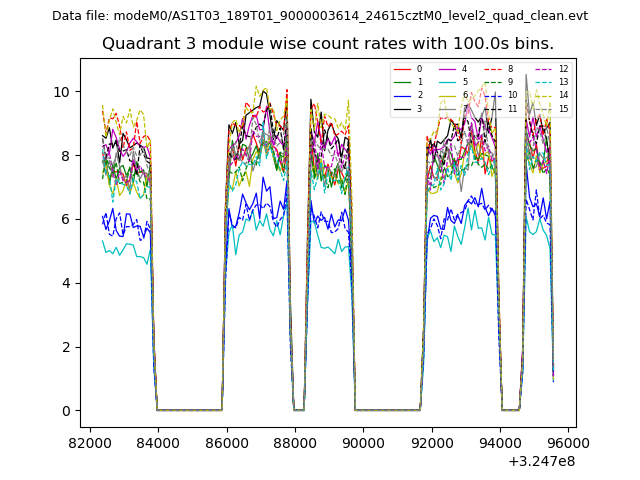
| Module-wise count rates for Quadrant A Data is divided into 100 sec bins |
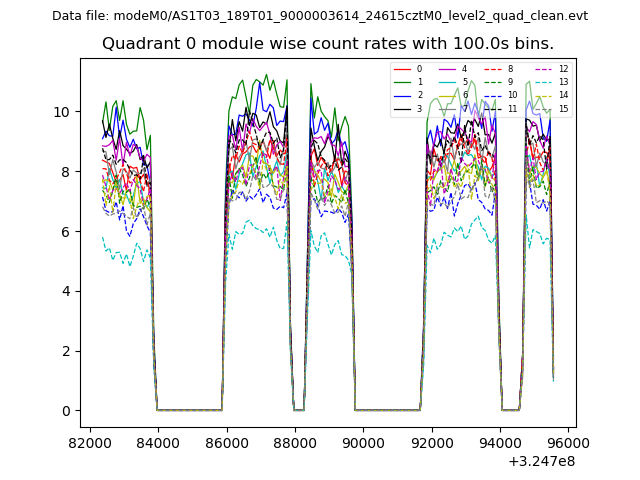 |
 |
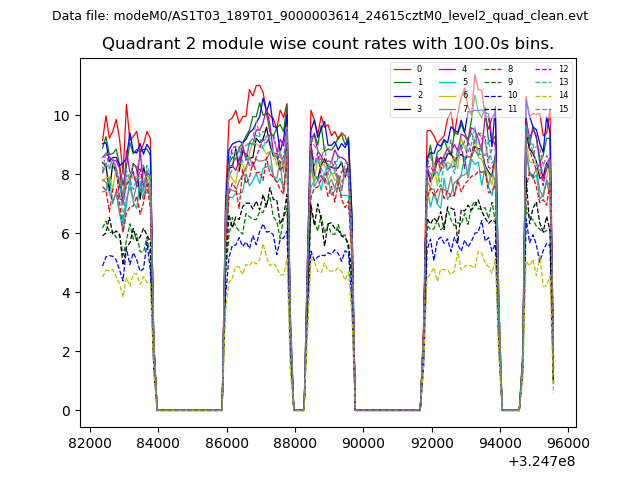
| Module-wise count rates for Quadrant B Data is divided into 100 sec bins |
 |
 |
| Module-wise count rates for Quadrant C Data is divided into 100 sec bins |
 |
 |
| Module-wise count rates for Quadrant D Data is divided into 100 sec bins |
 |
 |
| Parameter | Plot |
|---|---|
| CZT HV Monitor | 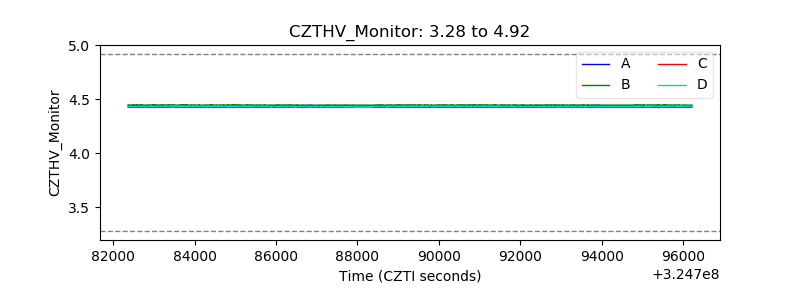 |
| D_VDD | 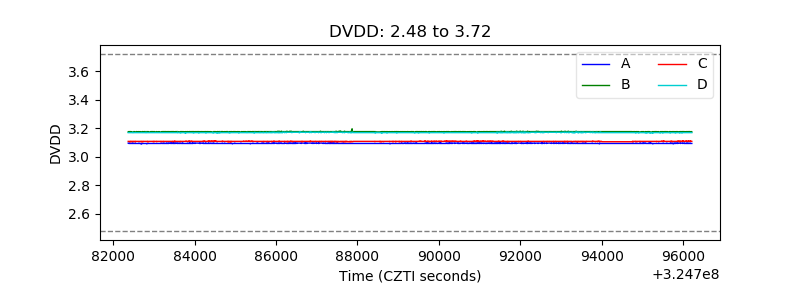 |
| Temperature 1 | 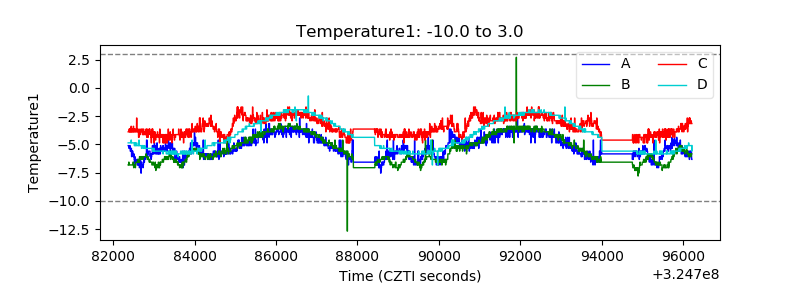 |
| Veto HV Monitor |  |
| Veto LLD | 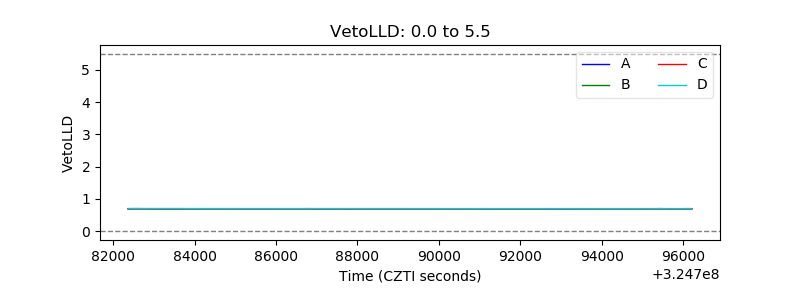 |
| Alpha Counter | 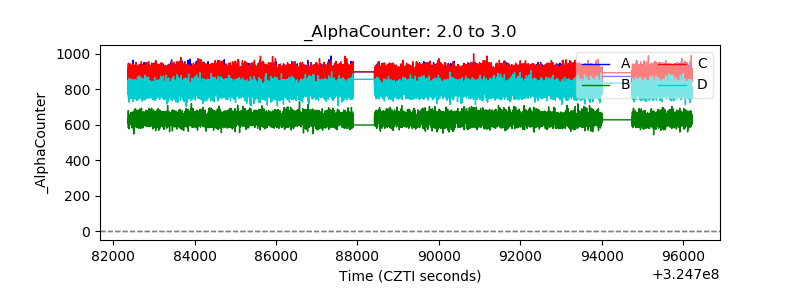 |
| _CPM_Rate | 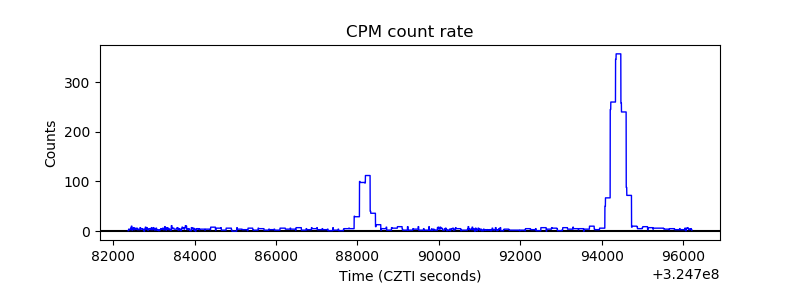 |
| CZT Counter | 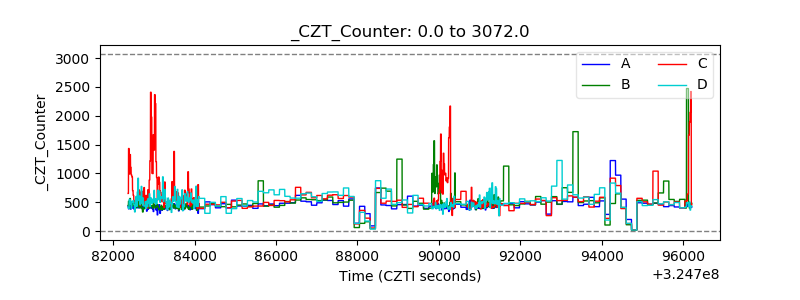 |
| +2.5 Volts monitor |  |
| +5 Volts monitor |  |
| _ROLL_ROT | 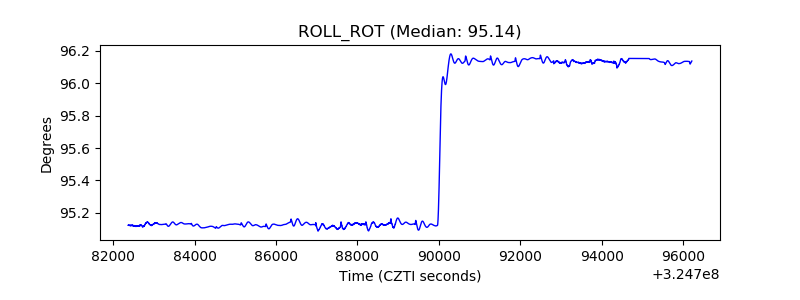 |
| _Roll_DEC | 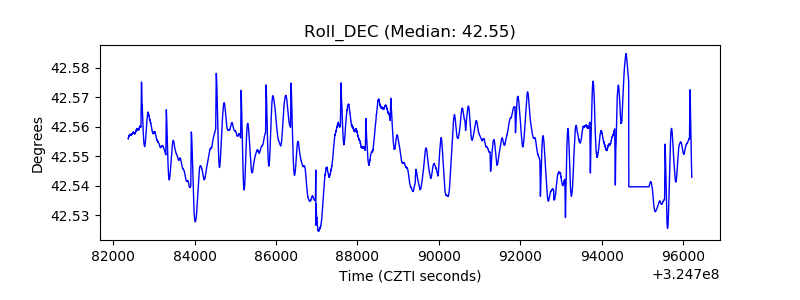 |
| _Roll_RA | 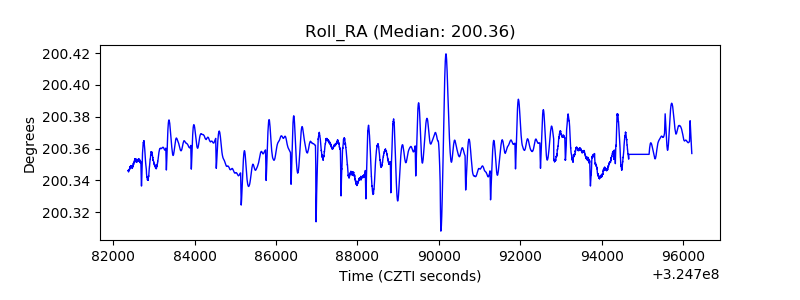 |
| Veto Counter | 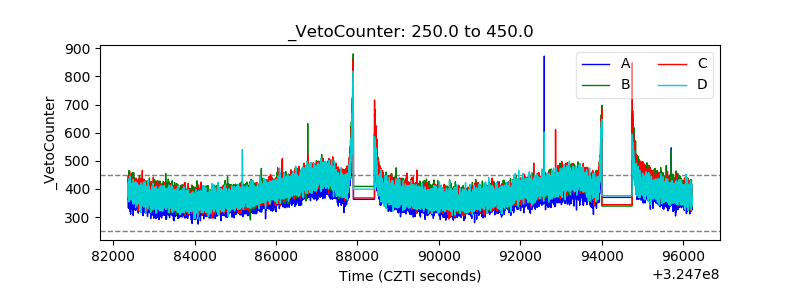 |